


In technical analysis and price action trading, the ability to identify decisive turning points is one of the most valuable skills a trader can develop. Over the years, various tools and concepts have been introduced to help traders capture these shifts.
Within the ICT methodology, one of the most powerful tools is the rejection block. This formation not only offers a strong reversal signal but also reveals the footprint of smart money and the intentions of major market participants.
In this article, you will learn what a rejection block is and how to accurately identify it on price charts. You will also discover how to build profitable trading strategies using the ICT rejection block.

- A rejection block candle becomes more reliable when its wick measures at least two to three times the size of its body.
- The strength of the reversal is often confirmed when the following candle closes in the direction suggested by the ICT rejection block signal.
- In liquid markets like forex, rejection blocks work best during volatile sessions, especially near the London and New York Opens.
What Is a Rejection Block?
According to HowToTrade, a rejection block is a candlestick pattern that reflects a sharp rejection of the price at a key support or resistance level. It forms when price drives forcefully into an important level to access resting liquidity. This liquidity usually includes the stop-loss orders of retail traders. Price then quickly reverses in the opposite direction, leaving a long wick behind.
The candle’s body is usually relatively small and closes on the opposite side of the long wick. Within ICT rejection block concepts in rejection block forex trading, this structure is often seen as the footprint of smart money.
Why Is the Rejection Block Considered a Key Reversal Zone?
A rejection block is widely recognised as a key reversal zone. It highlights the point where smart money, including institutional traders and major banks, enters the market decisively.
Large players require substantial liquidity to execute their positions. The most concentrated liquidity pools are usually clusters of stop-loss orders above previous highs or below previous lows.
The price is therefore intentionally pushed into these areas to trigger those stops. Once liquidity has been collected, institutions deploy orders in the opposite direction, creating the sharp and impulsive reversal that characterises a rejection block within ICT rejection block strategies.
As a result, a rejection block usually reflects:
- Liquidity grab:
The long wick of the candle marks the zone where liquidity (mainly stop-loss orders) has been collected. - Entry of major players:
The swift reversal and relatively small candle body suggest strong participation by smart money in the opposite direction of the initial move. - Weakening of the current trend:
The failure of price to stabilise beyond the broken level signals a loss of momentum in the prevailing trend and often precedes a meaningful reversal.
Types of Rejection Blocks
Rejection blocks in Forex are generally divided into two main categories, based on the direction of the price reversal:
- A bullish rejection block;
- A bearish rejection block.
Bullish Rejection Block
Referring to Tradingview, a bullish rejection block is a strong buy signal. It typically forms near major support zones, often at significant swing lows. It can also appear within areas of high demand. Imagine price declining towards a key support level, such as a previous low, before suddenly reversing.
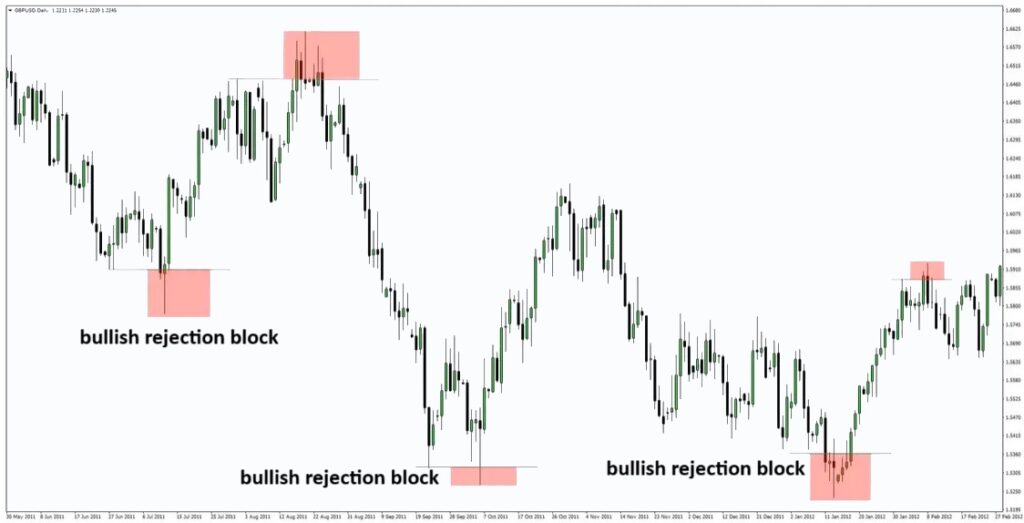
What Happens Inside a Bullish Rejection Block?
- Seller Trap:
Sellers aggressively push prices below support, triggering buyers’ stop-loss orders and encouraging further selling. This stop-hunt creates a long lower wick; the classic liquidity sweep that defines many rejection block forex scenarios. - Institutional Buy Orders:
Smart money steps in with substantial buy volume, absorbing all selling pressure and driving price sharply back above the support level. - Final Outcome:
The candle closes with a small body near its upper half, signalling that buyers have taken full control of the market.
In essence, a bullish rejection block indicates that sellers have exhausted themselves but failed to sustain the breakdown, suggesting a strong probability of upward continuation.

Pro Tip:
Rejection blocks that form during the London Kill Zone or New York Kill Zone tend to be of higher quality due to increased institutional activity.
Bearish Rejection Block
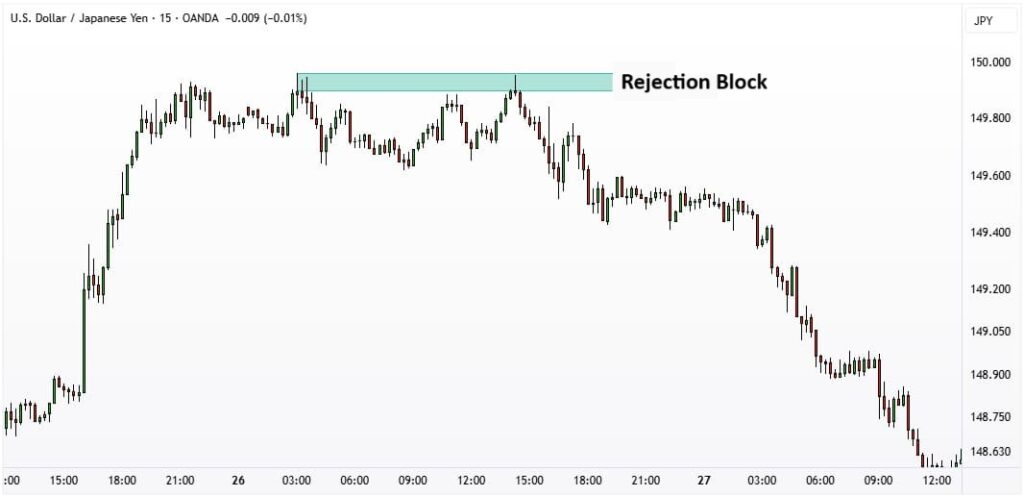
A bearish rejection block is a highly reliable sell signal that typically forms near resistance zones, levels where price has historically struggled to break higher.
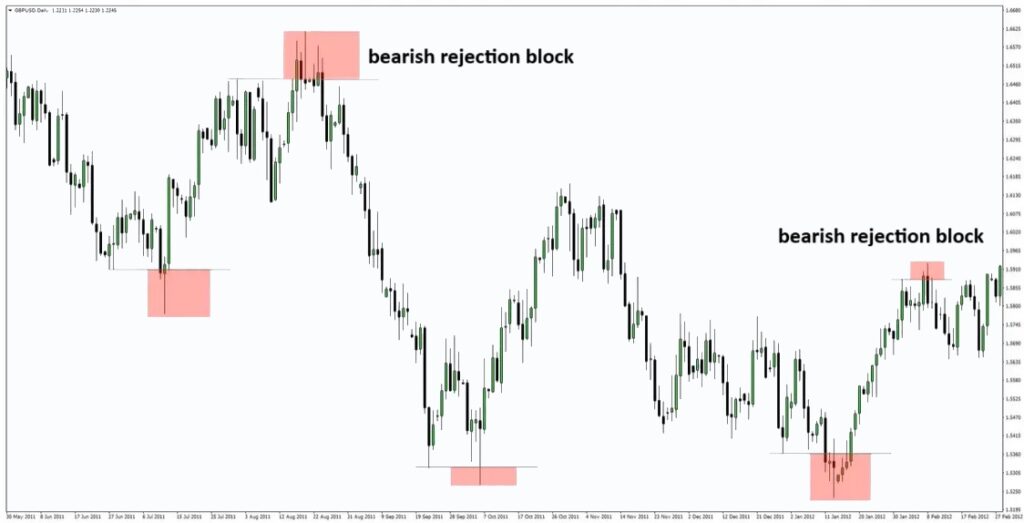
What Happens Inside a Bearish Rejection Block?
- Buyer Trap:
Buyers attempt to force the price above resistance, triggering the stop-loss orders of sellers and attracting additional buyers into the move. This false breakout creates a long upper wick, signalling a liquidity sweep. - Institutional Sell Orders:
Institutional traders, anticipating higher prices to execute sell orders, enter the market aggressively. Their selling pressure overwhelms the buyers, driving the price sharply back below the resistance zone. - Final Outcome:
The candle closes with a small body near the lower half, indicating that sellers have decisively taken control.
A bearish rejection block shows that buyers tried to push the price higher but failed to sustain the breakout. This failure strongly indicates that the price is likely preparing for a downward reversal.
Characteristics and Structure of the Rejection Block
To properly understand a rejection block, first observe how it forms on the chart. Identify the candlestick types most likely to create this zone. Determine which timeframes are best suited for trading it.
These elements together shape the logic behind concepts such as the ICT rejection block, helping traders distinguish it.
How Does a Rejection Block Form on Price Charts?
A rejection block typically develops when the price approaches a liquidity pool, usually a significant previous high or low.
Price then makes a fast, impulsive move beyond that level, sweeping the liquidity sitting there. At this point, many traders either exit their positions or enter new trades in the wrong direction, just as smart money steps in.
Institutional orders then aggressively reverse price back in the opposite direction, and the candle finally closes with a long wick and a relatively small body.
Which Candlestick Types Are Most Likely to Form a Rejection Block?
While any candle with a long wick can contribute to a rejection block, some candlestick structures align more closely with smart-money behavior. Here is the primary candlestick pattern most commonly associated with rejection blocks:
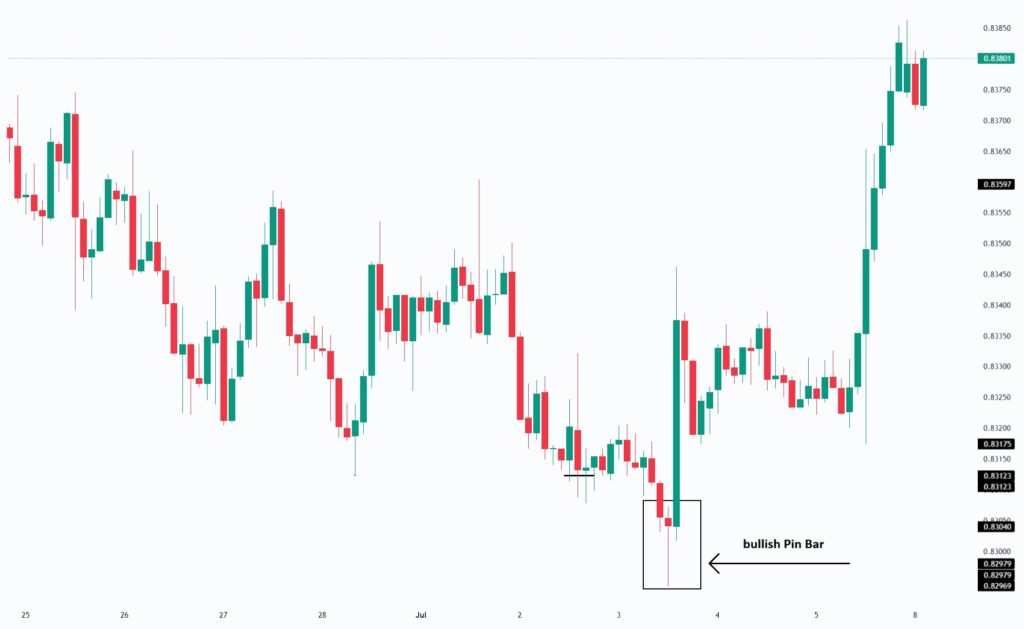
- Pin Bar:
The pin bar is the most classic and unmistakable signal of a developing rejection block. Its long wick and compact body encapsulate the entire story:
price was pushed aggressively in one direction to capture liquidity, immediately rejected, and then pulled back by institutional orders. This precise behaviour mirrors the structural foundation of the rejection block.
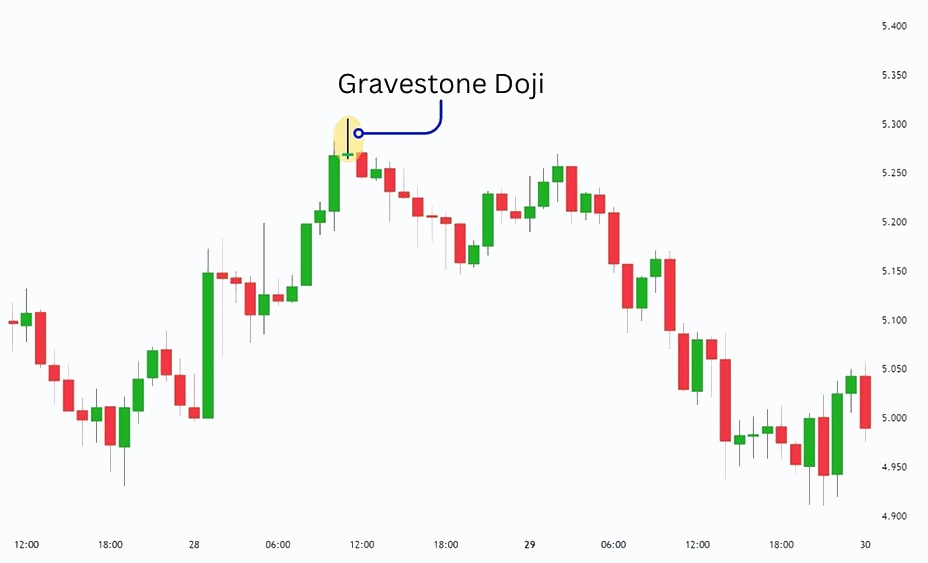
- Gravestone Doji
The gravestone doji is another candlestick pattern strongly associated with the formation of a bearish rejection block.
With its long upper wick and virtually non-existent body, it delivers a powerful signal of downward rejection.
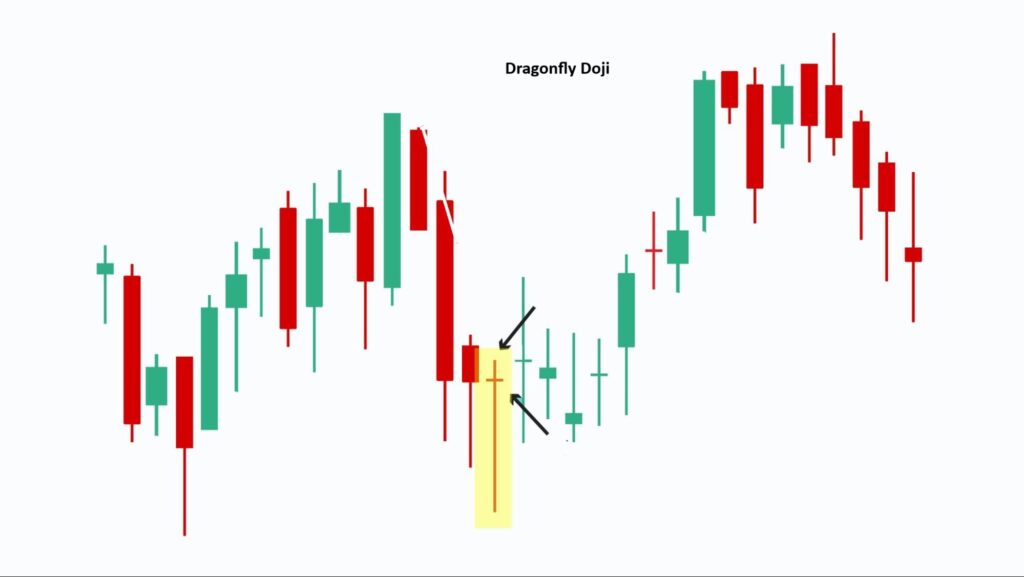
- Dragonfly Doji
The dragonfly doji is another candlestick formation that often contributes to a bullish rejection block. Characterised by its long lower wick and a body positioned near the top of the candle, it provides a strong indication of upward rejection.
Best Timeframes for Identifying and Trading Rejection Blocks
A rejection block can appear on virtually any timeframe, but its reliability increases significantly as you move higher up the chart.
In rejection block forex analysis, higher-timeframe structures like Daily, H4, and Weekly reflect genuine institutional order flow. These higher-timeframe blocks are far more trustworthy than those formed on lower time intervals.
Anyway, Intraday traders can still use bullish and bearish rejection block setups on lower timeframes, but with an essential condition:
The pattern must form at a key level derived from a higher timeframe.
Practical Question:
Q: Should a day trader take a 5-minute rejection block that forms in the middle of a range?
A: No. Low-timeframe rejection blocks are only meaningful when they respect liquidity levels, order flow, or structural points identified on higher timeframes.
Pro Tip:
Avoid trading rejection blocks that form against the dominant order flow, as they significantly increase the probability of false breakouts.
How to Identify a Rejection Block in Technical Analysis
Identifying a Rejection Block Using ICT Price Action
In ICT-style price action, a single rejection block candle is never enough on its own. A rejection block becomes meaningful only when it forms within a valid, well-defined trading scenario.
According to TradingFinder, traders use three essential criteria to identify high-probability setups. This checklist ensures the pattern is driven by institutional order flow, not random volatility.
1.Has the Rejection Block Swept Liquidity?
The first and most crucial step is to confirm whether the long wick of the rejection block has broken a key previous high or low.
In other words, did price break past a significant swing point, trigger stop-loss orders, and then immediately snap back?
If the answer is yes, that’s your first green light.
2. Has Market Structure Shifted?
After liquidity is taken, we look for confirmation through a shift in market structure. This typically means:
- In a bearish scenario, the price breaks a prior short-term low.
- In a bullish scenario, the price breaks a prior short-term high.
This market structure shift (often clearer on lower timeframes) indicates that control has shifted, from buyers to sellers, or vice versa.
3.Did the Rejection Block Form at a Key Level?
Finally, a high-quality rejection block should appear at a predefined, meaningful area. These zones may include:
- Order Block:
The last opposite-coloured candle before a strong displacement move. - Fair Value Gap (FVG):
A pricing inefficiency or gap where the market is likely to rebalance. - Key Fibonacci retracement Levels:
Particularly, 61.8% or 78.6% retracements, where institutional reactions often occur.
When a rejection block satisfies all three criteria, you identify a high-probability trading setup. This setup aligns strongly with institutional price-action concepts used in rejection block forex strategies.
Combining the Rejection Block with the RSI Indicator
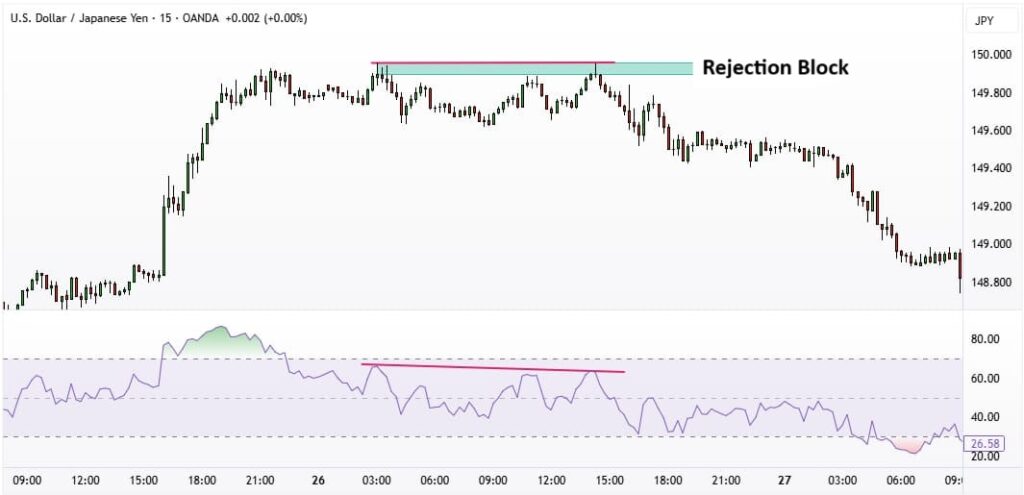
Integrating a rejection block with the Relative Strength Index (RSI) is a highly effective way to filter out weak signals and validate potential reversal points. In this combined approach, traders primarily look for the presence of divergence, a powerful tool for anticipating momentum shifts.
Divergence occurs when the price and RSI fail to confirm each other’s movement. This mismatch often serves as a strong warning that the current trend is losing strength and that a reversal may be imminent.
Types of Divergence to Confirm Rejection Blocks with the RSI Indicator
- Bearish Divergence:
Price prints a higher high, often seen as the elongated wick of a rejection block, yet the RSI fails to form a new high. This combination produces a highly reliable sell signal. - Bullish Divergence:
Price creates a lower low, reflected in the long lower wick of a bullish rejection block, while the RSI forms a higher low. This is a strong and credible buy signal.
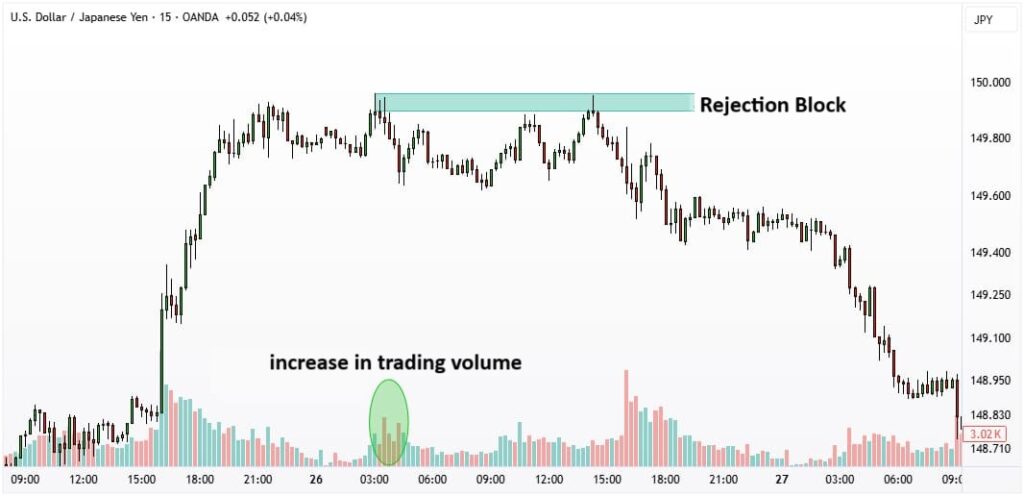
The Role of Trading Volume in Confirming a Rejection Block
Volume acts as a crucial confirmation filter for any rejection block. A strong and reliable setup usually appears alongside a sharp increase in trading volume, showing intense order flow and clear dominance by buyers or sellers.
If the rejection block forms on low or average volume, its credibility drops significantly, and the pattern is more likely to be a false signal.
How to Trade Using a Rejection Block
Once you’ve identified a valid rejection block, the next step is to execute the trade correctly. Below is a structured, step-by-step guide designed for practical trading across forex, equities, crypto, or even options.
Entering a Trade After a Rejection Block
After confirming a reliable rejection block, timing your entry becomes critical. Your choice will largely depend on your risk appetite and overall trading approach.
The most effective entry is usually when the price retests the rejection block zone and reacts to it.
- In a bullish rejection block, the retest often provides the ideal opportunity for a long position.
- In a bearish rejection block, the same retest offers a cleaner short entry.
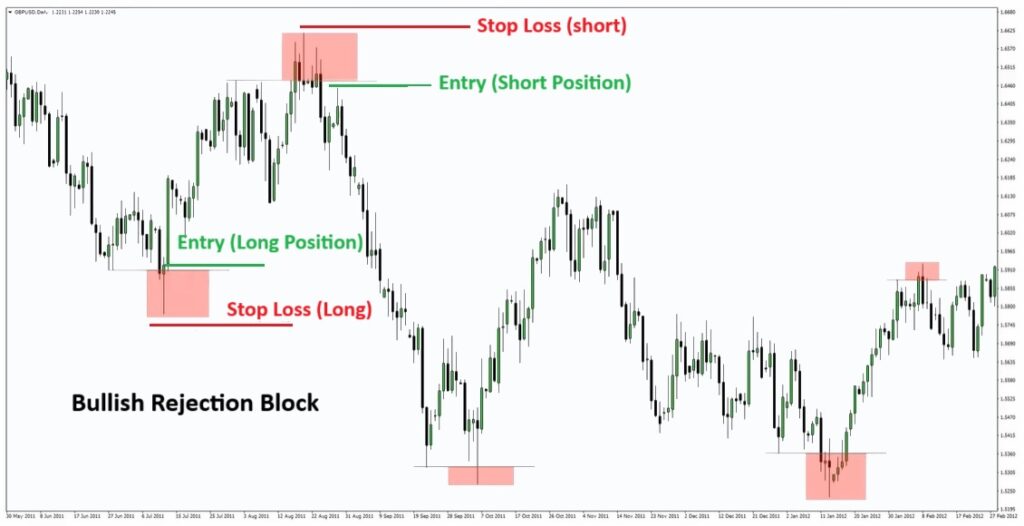
Entering the moment you spot the block tends to be risky. Waiting for a confirmation candle, or for the price to revisit the zone, generally yields a higher-probability setup.
Key Insight:
ICT entries become more reliable when rejection block retests align with short-term market structure shifts.
How to Set a Stop-Loss When Trading a Rejection Block
Stop-loss placement is straightforward and rooted in logic. According to smart money ict, place your stop just beyond the wick of the rejection block. This ensures the trade only fails if your bias is genuinely invalid.
- For a short position (bearish rejection block):
Place the stop-loss a few pips above the tip of the upper wick of the rejection block. - For a long position (bullish rejection block):
Place the stop-loss a few pips below the tip of the lower wick.
Optimal Risk-to-Reward Ratio for Trading a Rejection Block
When trading a rejection block, aim for a minimum 1:2 risk-to-reward ratio. Because this setup provides a very tight and precise stop-loss, your risk stays small, making it realistic to target profits that are 2×, 3×, or even more than your initial risk.
How to Set Logical Profit Targets
Take-profit levels should never be chosen randomly. In any rejection block setup, profit targets must align with market structure and areas where price is naturally drawn. The following key zones provide reliable, objective benchmarks for setting realistic targets in rejection block forex trading:
1. Liquidity Pools
Your first logical target is the nearest significant swing high or swing low in the direction of your trade.
Liquidity pools act like magnets: price is naturally attracted to these levels because they contain clustered stop orders. Hitting this zone often provides a clean, high-probability partial exit.
2. Fair Value Gaps (FVGs)
If an unfilled Fair Value Gap lies along your trade’s path, especially on higher timeframes, it makes an excellent profit target.
3. Order Blocks
A valid higher-timeframe order block located ahead of price is often the best candidate for your final target.
Key Insight:
A rejection block that forms immediately after a liquidity grab on the opposite side often marks the beginning of a strong, sustained price move.
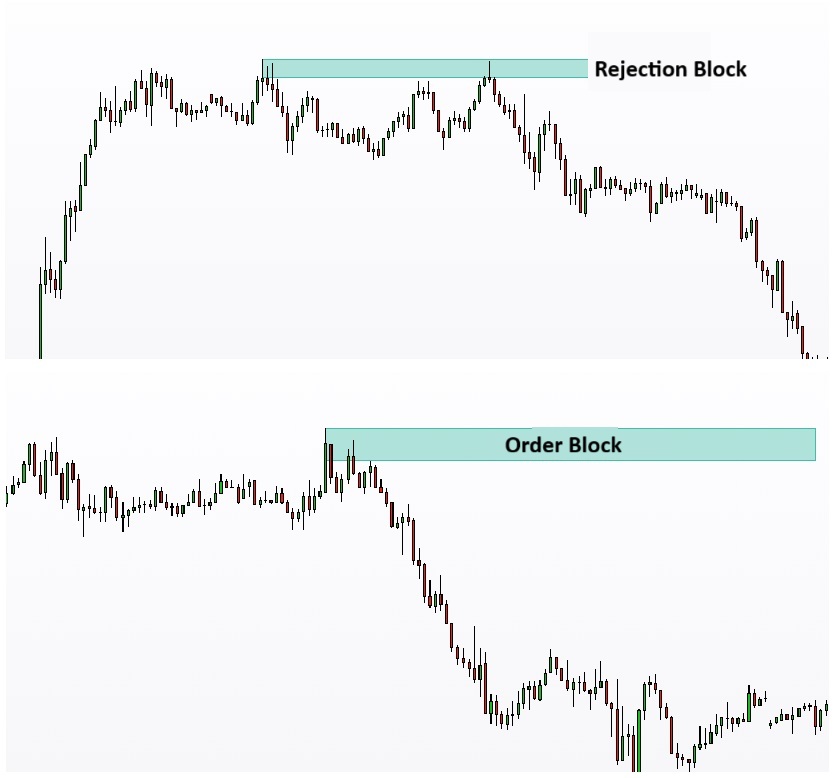
The Difference Between a Rejection Block and an Order Block
These two concepts are often confused, yet they serve very different purposes within market structure and ICT methodology.
- Order Block
An order block is the last bearish candle before a strong bullish displacement, or the last bullish candle before a significant bearish move.
This candle establishes an institutional zone, an area where large buy or sell orders were placed. Traders anticipate that the price will eventually revisit this zone and react to it, making order blocks key reference points in trend continuation and reversal setups.
- Rejection Block
A rejection block, by contrast, is a specific candlestick pattern characterised by a long wick, signalling an immediate rejection of price and a liquidity grab.
A rejection block can form within an order block, acting as a powerful confirmation signal for the activation of that higher-timeframe zone.
The Difference Between a Rejection Block and Supply–Demand Zones
Although traders often group these concepts together, supply–demand zones and rejection blocks represent different layers of price behaviour. Understanding how they interact can significantly improve precision in rejection block forex setups.
- Supply and Demand Zones
Supply and demand zones form when the price pauses and consolidates within a narrow range before a major rally or sell-off.
This temporary stagnation signals that substantial buy and sell orders are accumulating. Once one side, buyers or sellers, decisively gains control, price breaks out with force, leaving behind a zone that is likely to influence future movements.
Key characteristics include:
- A period of tight consolidation;
- Accumulation of institutional orders;
A strong, impulsive move that follows the pause.
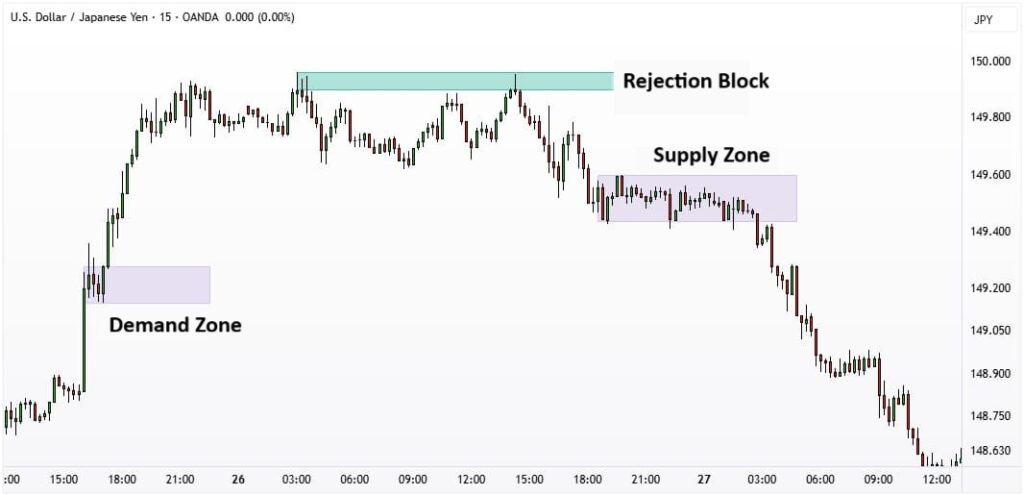
- Rejection Block
A rejection block, on the other hand, is a single-candle or multi-candle event that marks an extreme point and an immediate reversal.
In essence, a rejection block provides the fine-grained confirmation that a supply or demand zone is ready to produce a trade.
Summary Table: Rejection Block vs Order Block vs Supply–Demand Zones
| Concept | Definition | Key Characteristics | Relation to Rejection Block |
|---|---|---|---|
| Order Block | Final bearish candle before bullish displacement, or final bullish candle before a major drop. | • Institutional zone • Origin of strong moves • Price often revisits | A rejection block can form inside an order block and act as confirmation. |
| Rejection Block | Candlestick pattern with a long wick showing rejection and a liquidity grab. | • Long wick • Liquidity sweep • Immediate reversal | Confirms reactions at order blocks and supply–demand zones. |
| Supply & Demand Zones | Areas of consolidation before a strong rally or decline. | • Tight range • Order accumulation • Impulsive breakout | Often appears at the edge of these zones, validating them. |
Conclusion
The rejection block is a highly effective ICT tool that reveals smart-money behaviour rather than merely signalling a basic reversal. When paired with strong confirmations, such as rising volume or RSI divergence, its reliability increases significantly within rejection block forex setups.


