Performance represents more than just total earnings; it reflects how reliably you generated those profits and the risk involved. While two equity curves may reach the same profit, they often imply vastly different levels of account control.
Risk-adjusted return transforms these qualitative differences into a measurable comparison for better decision-making. This metric ensures you evaluate the efficiency of your strategy, not just the final balance of your account.
- Serial correlation can inflate the Sharpe ratio unless you adjust for the standard error.
- Negative skew can matter more than volatility for tail-heavy strategies.
- Stability across regimes matters more than the best historical ratio value.
- Return smoothing can improve ratios while hiding liquidity and gap risk.
What Is Risk-Adjusted Return?
According to CFA, Risk-adjusted return is the return earned per unit of risk taken. In trading, “risk” can mean volatility, downside volatility, drawdown, or benchmark-relative risk. The metric is designed for comparison across strategies with different return paths.
Key Point
Risk-adjusted metrics compare fairly only when returns and risk use the same sampling frequency.
Raw return vs risk-adjusted return
Raw return measures the total change in your account balance but ignores the distribution of outcomes during the investment period. Risk-adjusted return provides this essential context by accounting for the volatility experienced to achieve those specific gains.
A strategy may deliver high monthly performance while remaining fundamentally fragile due to unstable volatility or significant historical drawdowns. These risk factors are particularly critical when operating under real-world constraints, such as limited funding, margin requirements, and psychological pressure.
| Question | Raw return | Risk-adjusted return |
|---|---|---|
| What does it measure? | Profit over time | Profit relative to risk |
| What does it reward? | Higher returns | Efficient returns |
| What can it hide? | Drawdown and volatility | Assumptions and sampling |
| Common use | Headlines and marketing | Risk control and review |
Did You Know
Many proprietary trading challenges fail traders due to drawdown rules, not low returns.
Essential Risk Inputs for Traders
Risk-adjusted returns use specific definitions of risk to evaluate a strategy’s true performance. You must validate these individual inputs to ensure you can accurately interpret and trust the resulting performance data.
Volatility and Downside Risk
- According to Investopedia, Standard deviation measures how widely returns disperse around their average and serves as the primary volatility input for the Sharpe ratio.
- Downside deviation focuses only on returns below a specific threshold, providing the core data for the Sortino ratio.
Drawdown and Benchmarking
- Maximum drawdown measures the largest peak-to-trough decline in an equity curve, highlighting the worst observed loss path.
- A benchmark provides a reference return series, while tracking error measures the volatility of active returns relative to that index.
Market Sensitivity and Excess Return
- Beta represents sensitivity to benchmark movements, whereas alpha captures the specific return not explained by the market’s performance.
- The risk-free rate, usually proxied by government yields, serves as the baseline for calculating a strategy’s excess return.
More Info
A benchmark mismatch can convert market exposure into skill on paper, especially in short samples.
Q: Which risk-free rate should a trader use?
A: Use a government yield that matches your return frequency and base currency.
The Primary Risk-Adjusted Metrics
These three ratios are widely used in performance assessment because they answer different questions, each using a distinct definition of risk. You should select the specific ratio that most accurately matches your actual trading constraints and risk tolerance.
Sharpe Ratio: Excess Return per Unit of Volatility
The Sharpe ratio compares excess return to total return volatility.
Sharpe ratio formula:
Sharpe Ratio = (Rp − Rf) / σp
- Rp is the strategy return over a period.
- Rf is the risk-free rate over the same period.
- σp is the standard deviation of periodic returns.
The Sharpe ratio allows for broad comparability across diversified strategies but becomes less informative when returns exhibit skewness or fat tails. This metric also treats upside volatility as a risk, which does not align with how many traders actually experience profit.
Key Insight
A Sharpe ratio can rise when returns look smoother, even if rare losses grow larger.
Sortino Ratio: Excess Return per Unit of Downside Risk
The Sortino ratio replaces total volatility with downside deviation to focus specifically on variability below a minimum acceptable return. This metric provides a more accurate view of risk by ignoring the positive price swings that the Sharpe ratio penalises.
Sortino ratio formula:
Sortino Ratio = (Rp − MAR) / Downside Deviation
The Sortino ratio is ideal for strategies with positively skewed payoffs because it ignores the volatility generated during profitable trend runs. While the Sharpe ratio penalises these winning streaks, the Sortino ratio focuses exclusively on downside risk that actually affects performance.
Did You Know
Sortino ratios are comparable only when the same MAR is used for all strategies.
Calmar Ratio: Return Relative to Maximum Drawdown
The Calmar ratio compares annual return to maximum drawdown over a window.
It is widely used where drawdown limits constrain risk-taking.
Calmar ratio formula:
Calmar Ratio = Annualised Return / Maximum Drawdown
Calmar is sensitive to one severe drawdown. That makes it worthwhile for risk limits in funded accounts. It can be unstable in short histories because one event dominates MDD.
Key Point
Calmar can collapse after one crisis week, even if the strategy’s expected return remains similar.
Sharpe vs Sortino vs Calmar
Each ratio highlights a specific risk constraint, meaning a single metric cannot capture every potential failure mode in a strategy. You should use multiple ratios simultaneously whenever significant capital is at stake to gain a more complete performance perspective.
Table: When Does Each Ratio Help Most?
| Metric | Risk definition | Best for | Common failure mode |
|---|---|---|---|
| Sharpe | Total volatility | Diversified comparisons | Penalises upside volatility |
| Sortino | Downside deviation | Asymmetric pay-offs | Sensitive to MAR choice |
| Calmar | Maximum drawdown | Drawdown-limited accounts | Unstable in short samples |
Q: Which ratio is fairer for crypto and gold traders?
A: Sortino can be more informative when downside events are the binding constraint.
Evaluating Absolute and Relative Performance
Absolute return measures whether a strategy generated profit, while relative return determines if you outperformed a specific benchmark given your active risk.
Many institutional performance reviews, such as Deborahkidd, prioritise these relative results to evaluate a manager’s actual skill against the market.
Information Ratio: Performance Against Benchmarks
The Information Ratio measures active return relative to tracking error, quantifying how consistently a strategy beats its chosen benchmark. It is calculated by dividing the excess return over the benchmark by the standard deviation of those active returns.
Information ratio formula:
Information Ratio = (Rp − Rb) / Tracking Error
- Rb is the benchmark return.
- Tracking error is the standard deviation of (Rp − Rb).
This metric suits traders who maintain systematic exposure to a single market. Benchmark choice is the most common source of misuse.
More Info
If the benchmark is too easy, information ratios inflate and hide the true opportunity cost.
Measuring Systematic Risk via Treynor and Alpha
The Treynor ratio uses beta as the primary risk input instead of total volatility to measure returns relative to market sensitivity. Jensen’s alpha estimates actual performance relative to the results predicted by a strategy’s beta under the chosen model.
These measures assume a well-diversified portfolio and are generally less suitable for concentrated or single-instrument trading strategies. Because beta often drifts over time, interpreting these metrics requires constant validation against current market conditions.
Analysing Efficiency Beyond Basic Performance
Win rate functions strictly as a trade-level statistic and fails to provide a comprehensive measure of portfolio-level risk. It ignores critical factors like loss severity, clustering, and rare tail events that can devastate an account despite frequent wins.
Long-term survival depends more heavily on your risk-reward ratios and maximum drawdowns than on how often you win trades. Focusing on these metrics ensures that a few large losses do not outweigh the gains from a high win frequency.
Comparative Performance Metrics
- ROI: Determines the total amount of money made over a specific period.
- Risk-Adjusted Return: Evaluates how efficiently and safely profits were generated.
- Win Rate: Tracks how often trades result in a profit regardless of size.
- Risk-Reward: Compares the average size of winning trades against the average size of losses.
Key Insight
If your average loss is unbounded, ratios can look acceptable until a single trade wipes out months of progress.
Q: Can a low win rate still produce high risk-adjusted returns?
A: Yes, if losses are controlled and winners are meaningfully larger than losers.
Establishing Performance Hurdles and Required Returns
Every trading strategy requires a hurdle rate to reflect essential costs, time investment, and specific drawdown limitations. A practical hurdle is your Minimum Acceptable Return (MAR), which serves as the baseline for evaluating your strategy’s true success.
You must set your MAR explicitly to prevent the Sortino ratio from shifting unexpectedly and losing its analytical value. Maintaining a consistent hurdle rate across your portfolio also significantly improves your ability to accurately compare different trading strategies.
More Info
If funding rules allow a 5% drawdown, your hurdle rate should reflect the limited-risk budget.
Utilising RORAC and Model Portfolios
- Return on Risk-Adjusted Capital (RORAC)
Divides total returns by risk-weighted capital to compare various business lines or trading strategies. For individual traders, this represents the return generated per unit of risk capital consumed by margin, stress losses, and drawdowns. - Model portfolios
Aim to balance risk and return within specific constraints, such as minimum-variance or volatility-targeted allocations. While these models seek higher risk-adjusted returns, remember that correlations often rise during stress, making diversification conditional rather than guaranteed.
Key Point: Capital is frequently the binding constraint on a strategy, even when the market opportunity appears exceptionally large.
How to Calculate Risk-Adjusted Return in Excel
Calculating risk-adjusted returns in Excel forces consistent inputs and transparent assumptions. That consistency matters more than automation when you compare strategies fairly.
Step 1: Define your frequency
Use daily returns for swing strategies and hourly returns for intraday systems.
Do not mix frequencies across strategies, because ratios will not be comparable.
Step 2: Structure your data
Create a simple table with date, equity, and period return.
| Date | Equity | Period Return |
|---|---|---|
| 2026-01-01 | 10,000 | — |
| 2026-01-02 | 10,120 | 1.20% |
| 2026-01-03 | 10,060 | -0.59% |
| 2026-01-04 | 10,180 | 1.19% |
Did You Know:
Ratios based on simple equity changes can differ from log-return calculations, especially in volatile markets.
Step 3: Build the return series in Excel
If your equity values are in column B, calculate period returns in column C:
=(B3/B2)-1
Step 4: Sync the risk-free rate
If the annual risk-free rate is stored in F1, convert it to a daily rate:
=F1/252
Use the same convention in every workbook and backtest.
Step 5: Quantify risk inputs
Calculate the mean return and volatility from your returns column.
=AVERAGE(C3:C252)
=STDEV.S(C3:C252)
Volatility here is the standard deviation of periodic returns.
Step 6: Calculate the Sharpe ratio
Sharpe compares the excess return to the total volatility.
=(AvgRet – RF)/StDev
Where:
- AvgRet is the average periodic return.
- RF is the periodic risk-free rate.
- StDev is the standard deviation of periodic returns.
Step 7: Calculate the Sortino ratio
Sortino uses downside deviation instead of total volatility.
First, isolate downside returns in a helper column.
=MIN(0, C3 – MAR)
Then, calculate downside deviation as the standard deviation of that helper column. Finally, compute the Sortino ratio:
=(AvgRet – MAR)/DownDev
Quick Excel reference table
Pro Tip:
If you set MAR = 0, Sortino becomes a loss-focused efficiency metric that suits drawdown-limited trading.
Locating Risk Metrics in MetaTrader 5
MetaTrader 5 displays the Sharpe ratio and detailed drawdown statistics directly within its Strategy Tester reports for performance evaluation. You should use these automated values as a starting point, but always validate the underlying assumptions against your own data.
The platform’s documentation offers informal interpretation bands for the Sharpe ratio, but you should treat these as general guidance. If your spreadsheet results differ from MT5, verify the return definitions, compounding methods, and calculation frequencies used by the platform.
Common Implementation Questions
- Q: Can I export MT5 metrics to a journal?
A: Yes, but ensure you record the specific test period and settings to maintain reproducibility. - Q: Where are the drawdown stats located?
A: Look in the “Backtest” or “Summary” tabs after running a strategy simulation or optimisation.
Selecting Analytical Tools and Platforms
Effective platforms provide transparent assumptions and reproducible reporting, allowing you to audit every input for your risk-adjusted metrics. If a platform hides its assumptions about annualization or the risk-free rate, you should treat the resulting data as a rough indicator.
Essential Platform Features
- Customisation: Adjustable return frequency and annualization settings to match your specific trading timeframe.
- Cost Accounting: Clear treatment of all trading expenses, including spreads, commissions, and overnight financing costs.
- Benchmarking: Flexible selection of reference indexes to calculate relative performance and tracking error accurately.
- Drawdown Analysis: Detailed reporting of peak-to-trough series, including specific recovery dates and duration.
Optimising Real-World Risk-Adjusted Returns
Improving performance metrics usually requires tighter risk control rather than increasing trade frequency. Lowering volatility while maintaining the same expectancy will raise most ratios, while reducing maximum drawdowns will directly improve your Calmar ratio.
Strategies for Volatility Dampening
- Correlation Management: Reduce total exposure when correlations rise across different instruments to prevent simultaneous losses.
- Volatility Awareness: Avoid increasing position sizes immediately after volatility spikes to protect against unstable market regimes.
- Risk Segmentation: Distinguish high-impact event risks from normal session volatility to manage your exposure more effectively.
Position Sizing and Execution Costs
Position sizing is your most direct lever; reducing size as stop distances widen keeps your cash risk stable. Furthermore, execution costs like spreads and commissions must be integrated into your return series rather than treated as external adjustments.
Broker Selection and Discipline
Select brokers offering transparent cost reporting and stable execution to ensure your calculated metrics remain accurate and reliable. Remember that risk-adjusted metrics require a significant number of observations to stabilise before you can judge a strategy’s true quality.
Did You Know:
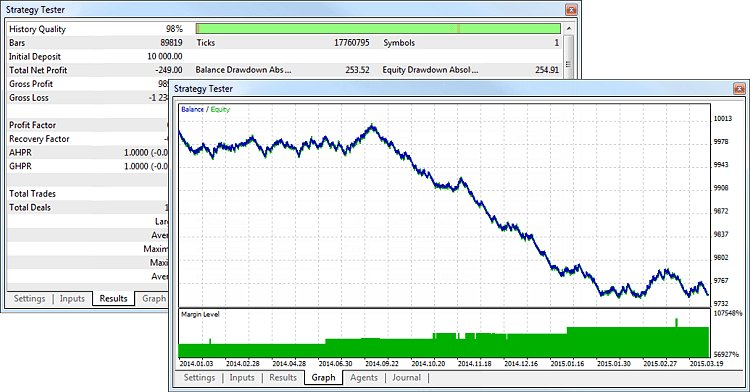
A backtest may appear stable, but it can lose its high Sharpe ratio once realistic slippage is applied.
Conclusion
Risk-adjusted return is a reporting discipline that reduces self-deception by forcing you to specify benchmarks, hurdles, and clear risk definitions. Adopting these metrics improves communication and transparency when allocating capital across multiple strategies or comparing diverse trading systems.
A performance ratio is only useful when you can reproduce it consistently using your own validated data and assumptions. By focusing on efficiency rather than just raw gains, you ensure your trading remains sustainable under real-world market constraints.