


Have you ever wondered how oil, gold, or wheat prices affect your investments? In commodity markets, an accurate benchmark is essential. The S&P GSCI Index, which covers commodities such as energy, metals, agricultural products, and livestock, serves as this benchmark.
Using real data and weighting based on each commodity’s production share, the index offers a comprehensive market view. It allows comparisons of trends across different time periods. If you want to understand market performance better and use it in your economic decisions, stay with us throughout the article.

- The S&P GSCI Index, focusing on futures contracts, offers a dynamic benchmark to track real-time commodity market changes.
- The energy-heavy weighting in the S&P GSCI makes it a sensitive tool for analyzing geopolitical impacts.
- Due to its high liquidity, the S&P GSCI Index allows for fast and efficient trading on the Chicago Mercantile Exchange.
- Comparing the S&P GSCI Index with BCOM highlights different approaches in analyzing commodity markets.
What is the S&P GSCI Index?
The S&P GSCI Index tracks the price trends of a broad range of commodities in global markets. It reflects the performance of tangible assets traded via futures contracts. This includes energy, metals, agricultural products, and livestock, providing a comprehensive view of price movements across sectors.
The idea for the index was proposed by Goldman Sachs in 1991. Its goal was to create an investable benchmark with broad market coverage. In 2007, S&P took over the management and publication of the index, further developing it under the S&P brand.
A key feature of the S&P GSCI Index is that each commodity’s weight is based on its global production share. This ensures the index reflects global supply, helping investors diversify portfolios and hedge against price volatility.
What Commodities are Covered by the S&P GSCI Index?
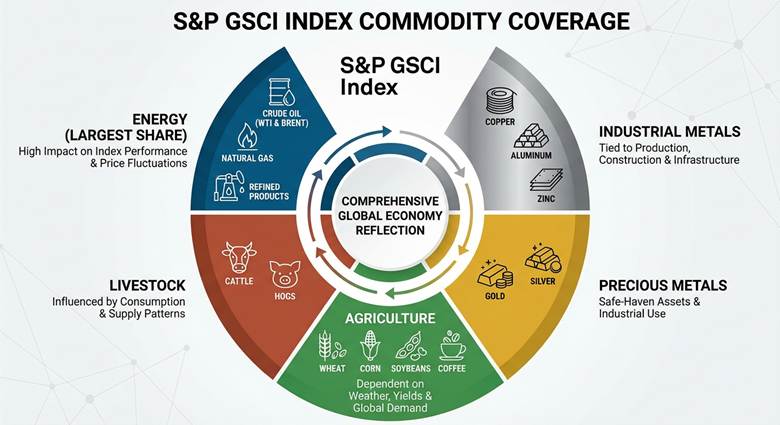
The S&P GSCI Index divides commodities into five main groups, each covering a significant part of the global economy. The largest share is usually allocated to energy, including crude oil (WTI and Brent), natural gas, and refined products. Price fluctuations in this sector can heavily impact the overall performance of the S&P GSCI Index.
The next group is industrial metals, including copper, aluminium, and zinc. These metals are highly correlated with production and industrial activities. Price changes in these metals are indicators of the health of the construction and infrastructure sector.
Precious metals, including gold and silver, form a separate section within the S&P GSCI Index. Besides industrial uses, these metals are known as safe-haven assets. Analysing them alongside the relationship between gold and oil offers valuable insight into economic conditions.
In the agricultural sector, the S&P GSCI Index includes commodities like wheat, corn, soybeans, and coffee. Their prices depend on weather conditions, crop yields, and global demand.
The final group covers livestock, such as cattle and hogs. Consumption patterns and supply dynamics influence these commodities. This diversity makes the S&P GSCI Index a comprehensive benchmark for the commodity market.
How is the S&P GSCI Index Calculated?
The calculation of the S&P GSCI Index follows a four-step process:
- First, global production data for commodities is gathered to determine each commodity’s weight.
- Next, only high-liquidity futures contracts are selected to ensure the commodities can be traded effectively.
- The weights are then determined based on the five-year average production of commodities, giving more weight to items like crude oil.
- Finally, the S&P GSCI Index is reviewed and rebalanced every January to reflect market changes.
Factors like contango (when future prices are higher than spot prices) and backwardation (the opposite of contango) can impact the index’s performance. These factors can either increase or decrease returns. Contango and backwardation are important in intermarket analysis because the S&P GSCI Index is closely tied to the currency and stock markets.
Q: What is the impact of futures contract roll yield on long-term S&P GSCI Index returns?
A: Roll yield plays a critical role in the long-term returns of the S&P GSCI Index. When markets are in contango, rolling futures contracts forward can gradually erode returns. Conversely, in backwardation, roll yield can enhance performance. Therefore, long-term investors should evaluate not only spot price trends but also the structure of the futures curve, especially during energy-heavy periods.

Key Insight
The S&P GSCI Index is primarily calculated based on global production weighting. It includes key physical commodities actively traded in futures markets with high liquidity.
Application of the S&P GSCI Index in Financial Markets
This index is one of the most widely used metrics for evaluating the overall state of commodity markets. Its data plays a significant role in investment decisions, risk analysis, and tracking economic trends.
Given the high diversification of assets in the S&P GSCI index and its low correlation with traditional markets, it is a valuable tool. The S&P GSCI index can be a valuable resource for investors, portfolio managers, and analysts. The following explores three key uses of this index in financial markets.
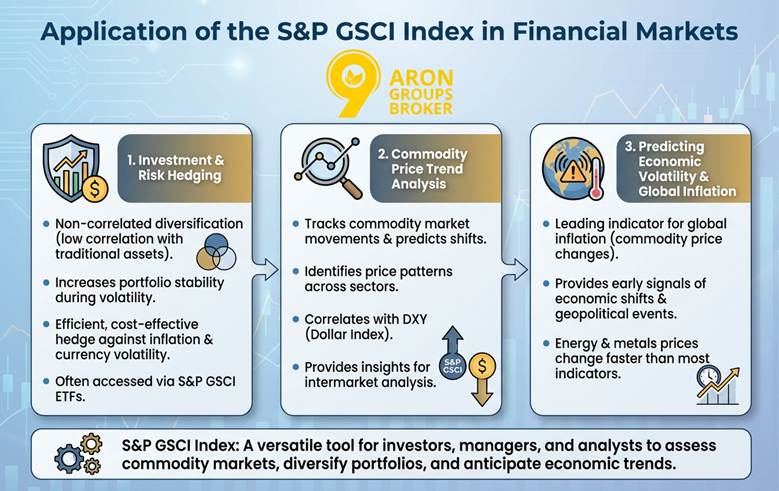
The Role of the S&P GSCI Index in Investment and Risk Hedging
When traditional assets like stocks or bonds are under pressure from volatility or inflation, this index can serve as an effective diversification tool.
Especially with its low correlation to other markets, adding it to a portfolio can provide greater stability. Many investors use ETFs based on this index to access it easily.
These ETFs offer a simple and cost-effective way to hedge against inflation or currency fluctuations while benefiting from commodities.
The Application of the S&P GSCI Index in Analyzing Commodity Price Trends
For analysts and economists, this index is a useful tool for tracking the average movement of the commodity market.It can be used to predict market changes and identify price patterns.
Additionally, studying the correlation between this index and the DXY (Dollar Index) reveals how dollar strength or weakness can affect commodity prices. This insight helps with inter-market analysis.
The Role of the S&P GSCI Index in Predicting Economic Volatility and Global Inflation Trends
Commodity price changes, especially in sectors like energy or metals, often occur faster than other economic indicators. This characteristic has made the S&P GSCI index a leading indicator for global inflation. It can provide early signals about economic shifts or geopolitical events.
Q: How does the S&P GSCI Index perform during periods of high inflation compared to equities and bonds?
A: Historically, the S&P GSCI Index has shown stronger performance during high inflation periods because commodity prices often rise alongside inflation. Unlike equities, which may suffer from higher input costs, or bonds, which lose value as interest rates increase, commodities, especially energy and metals, tend to preserve purchasing power. This makes the index a practical inflation-hedging tool rather than a return-maximisation asset.
Source Box
According to Investopedia, commodity price movements are not only a reflection of supply and demand but also a key indicator for assessing global inflationary pressures.
Difference Between the S&P GSCI and Bloomberg Commodity Index (BCOM)
Both the S&P GSCI and the Bloomberg Commodity Index (BCOM) track commodity market performance, but they have key differences. The S&P GSCI uses global production-based weighting and focuses heavily (around 60%) on energy, with 24 commodities in total.
In contrast, BCOM uses a mix of production (one-third) and liquidity (two-thirds) for its weighting across 23 commodities. It also has restrictions (a maximum of 15% for each commodity and 33% for each sector), leading to a more balanced distribution. This makes the S&P GSCI more sensitive to oil price changes, while BCOM offers greater diversification across sectors.
Source Box
According to Bloomberg, the BCOM index provides broad access to the commodity market without allowing any single commodity or sector to dominate the index.
Challenges and Limitations of the S&P GSCI Index
Despite its applications, the S&P GSCI index has several limitations. Some of these limitations are:
- The high dependence on the energy sector (around 60%) means oil price fluctuations significantly impact the S&P GSCI.
- The commodity market is volatile, which can increase investment risks.
- Contango (when future prices are higher than spot prices) and backwardation (the opposite) affect the index’s returns.
- Contango typically reduces returns, while the automatic rolling strategy of futures contracts can result in losses in these conditions.
- These factors cause the S&P GSCI index to sometimes perform differently from the actual commodity market.
How to Use the S&P GSCI Index for Investment
To invest in the S&P GSCI index:
- First, select an appropriate ETF, such as iShares GSG, that tracks the performance of this index.
- Choose a reputable brokerage that provides access to this ETF.
- Fund your account.
- Determine your investment amount based on your financial goals and risk tolerance; typically, 5 to 10 percent of the portfolio is recommended.
- To manage risk, use diversification and set stop-loss limits.
- Regularly monitor the commodity market, as the S&P GSCI is sensitive to oil price changes and global events.
- Reviewing economic and geopolitical reports will help adjust your strategy.
Q: Is the S&P GSCI Index more suitable for tactical trading or strategic portfolio allocation?
A: The S&P GSCI Index is generally more effective for strategic allocation rather than short-term trading. Due to its broad exposure and production-based weighting, it is better suited for macro-driven positioning, inflation hedging, and long-term diversification. Tactical traders usually prefer sector-specific commodity indices to avoid excessive energy concentration.
Conclusion
The S&P GSCI index is more than a price metric; it bridges market data and global economic interpretation. Its production-based weighting helps assess changes in supply and demand. The index reflects developments across sectors such as energy, metals, and agriculture, revealing hidden patterns in economic cycles. Monitoring it offers deeper insights into macroeconomic and inflation trends, including early indicators.


