icon icon Home
icon icon Accounts
icon icon Quick start
icon icon Symbols

Spike Indicator Guide: Day Trading Volatility Strategy

Author
Abe Cofnas
Abe Cofnas
calendar Last update: 31 December 2025
watch Reading time: 8 min

Market analysis can feel like solving a complex puzzle, but tools like the Spike Indicator make it simpler. This tool helps identify sudden price spikes, allowing for profitable day trading.

Whether you’re a beginner or an experienced trader, learning to use the Spike Indicator can enhance your trading strategies. In this article, we will introduce this powerful tool in simple terms and guide you step by step in making smarter trades with the Spike Indicator.

bookmark
Key Points:
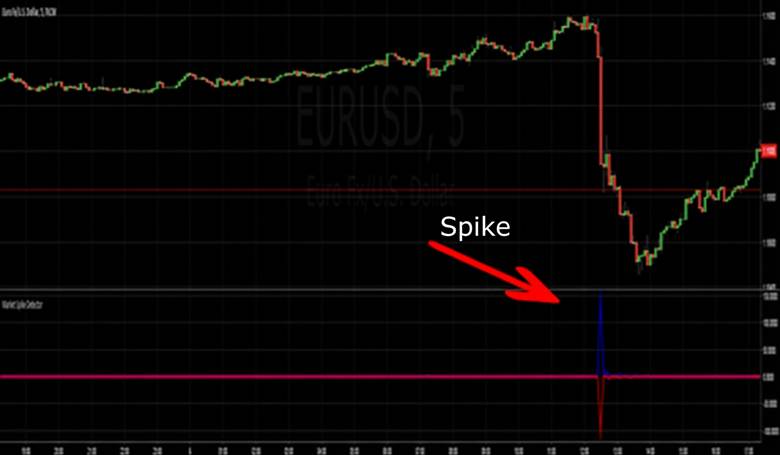
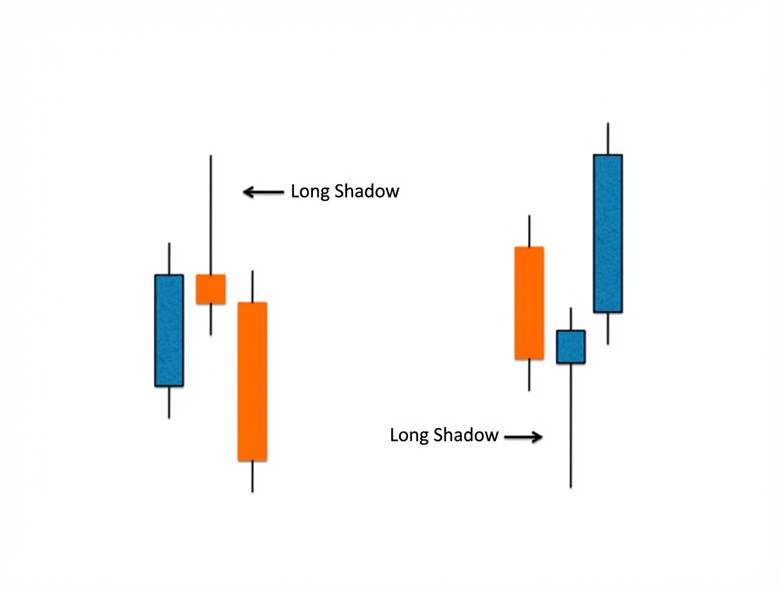
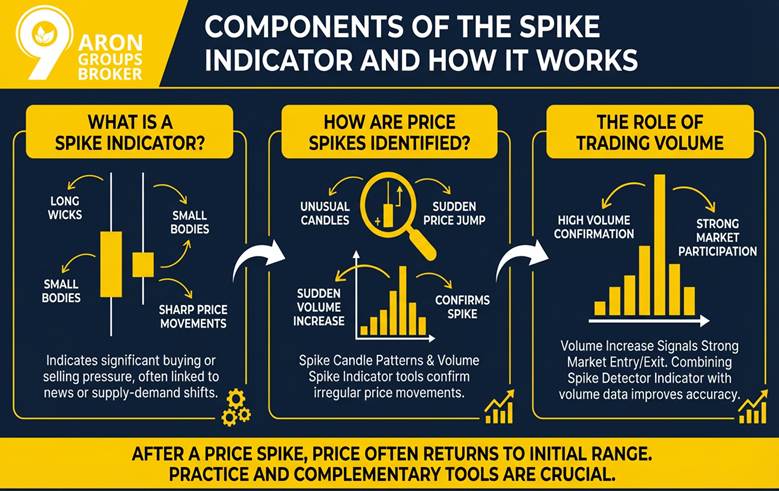
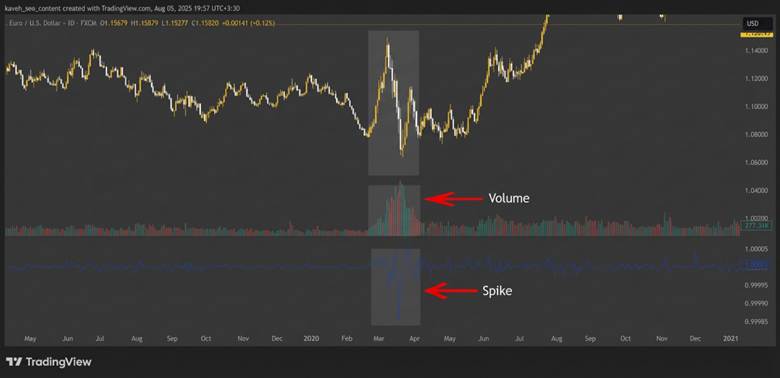
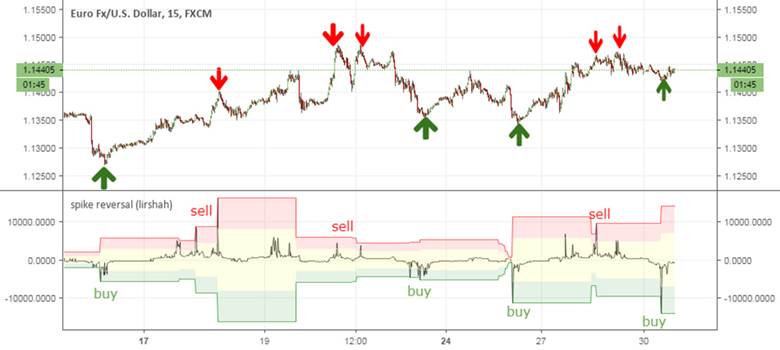
  • The Spike Indicator helps identify critical market moments by focusing on sudden price spikes, but requires confirmation with volume and visual candles.
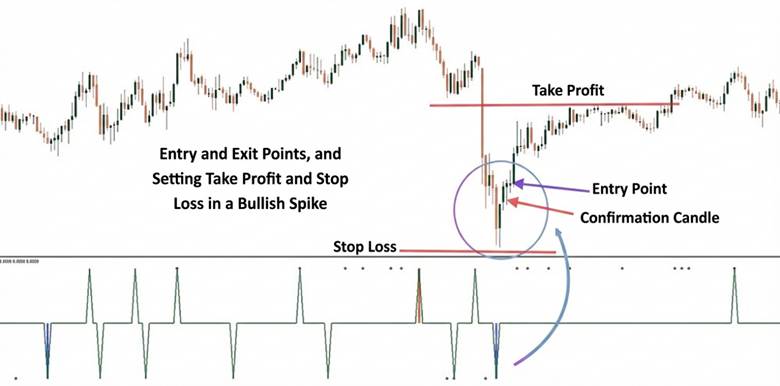
  • Using the Spike Indicator for day trading requires setting entry and exit points based on key support and resistance levels.
  • Setting appropriate stop-loss and take-profit levels with a proper risk-to-reward ratio prevents unexpected losses in volatile trades.
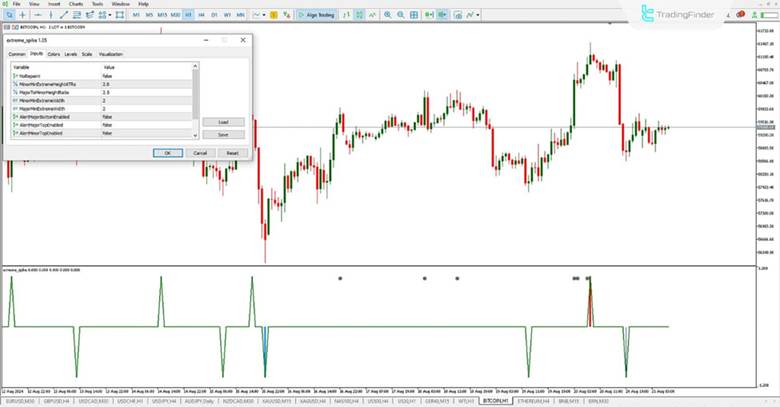
  • Adding the Spike Indicator to MetaTrader or TradingView platforms requires custom scripts and parameter adjustments to match your trading style.

What is the Spike Indicator?

Sharp, sudden price movements over a short period often signal a major market shift. These fluctuations can indicate smart money entry, news reactions, or supply-demand imbalance.

To identify such moments, tools like the Spike Indicator are designed. This indicator helps traders spot abnormal market movements, especially when accompanied by high volume.

When a spike occurs, it is represented by a tall, unusual candle on the chart. These Spike Candles often indicate large order volumes moving in one direction, signalling a trend or reversal.

From a technical analysis view, spikes represent moments when market sentiment suddenly changes. This change may occur due to news, economic data, or liquidation of trades at key price levels.

spike indicator

According to definitions from sources like Investopedia, a spike occurs when the price rapidly and unusually moves in one direction. Afterward, it either returns to the previous path or enters a new phase of trend development.

Components of the Spike Indicator and How It Works

In candlestick charts, the Spike Indicator uses candles with small bodies and long wicks, showing sharp price movements. These candles typically appear after a sudden price jump, indicating significant buying or selling pressure.

Such movements are often linked to news or supply-demand shifts, quickly changing market sentiment. After a Price Spike Trading Strategy, the price often returns to its initial range. This return highlights the importance of trend analysis, as spikes can be temporary reactions, not new trends.

How Are Price Spikes Identified?

Traders identify the Spike Indicator by looking for large or unusual candles that show a sudden price jump. These candles usually differ from regular movements by their long wicks or large bodies. Spike Candle Patterns help spot these irregular price movements.

A sudden volume increase is crucial for confirming a spike. This shows strong market participation. Volume Spike Indicator tools help confirm spikes, and misidentifying them can lead to liquidation. Practice and using complementary tools reduce risk.

spike indicator

The Role of Trading Volume in Spike Identification

Spikes often occur with much higher volume than normal, distinguishing them from typical fluctuations. Using tools like Spike vs. ATR Indicator can confirm spikes. A volume increase signals a strong market entry or exit. Combining Spike Detector Indicator signals with volume data helps traders make more accurate decisions.

spike indicator

Q: Can the Spike Indicator be used to detect algorithmic or high-frequency trading activity?

A: Yes. Large sudden price movements often result from algorithmic trades or bots reacting to market events. By monitoring unusual spike patterns that occur without apparent news, traders can identify potential algorithmic activity. Recognizing these patterns helps in avoiding false breakouts and adjusting trade size or timing.

sms-star

Pro Tip: 

A professional Spike Indicator can be adjusted with inputs like volume multiplier or price change percentage. Pine Script identifies spikes where volume exceeds 2-3 times the average and shows significant price changes.

How to Use the Spike Indicator in Trading

Traders use strategies that treat Price Spike Trading Strategy as the start of a sharp market move. When the Spike Indicator identifies a sudden price movement, combine it with other tools like support, resistance, or RSI for confirmation.

This combination improves accuracy in entry and exit points while reducing false signals. However, Trading Volatility Spikes is high risk and requires precise management to avoid major losses. Risk management and correct trade volume are essential.

How to Enter and Exit Trades with the Spike Indicator

For entry, buy during an upward spike or sell during a downward spike, but wait for confirmation. After an upward spike, wait for a confirmation candle showing momentum slowdown. Exit near support or resistance levels. Use confirmation candles like Doji or Engulfing patterns to avoid false signals.

spike indicator

Setting Stop-Loss and Take-Profit Using the Spike Indicator

Set the take-profit near key support or resistance levels. For an upward spike, set it near the next resistance. Place the stop-loss just below the spike’s lowest point to avoid large losses if the trend reverses.

Using a Risk-to-Reward Ratio (e.g., 1:2) helps improve profitability. Risk management in trading with the Spike Indicator is essential, as volatility can quickly lead to losses. Testing strategies on a demo account is recommended.

According to Luxalgo, when confirming a spike near key levels (support and resistance), entering a trade quickly is preferred. A spike often confirms a breakout or trend reversal, rather than being just a random volume movement.

sms-star

Warning:

For effective use of the Spike Indicator, always pay attention to volume changes. Without significant volume increase, spikes may turn into random and unreliable movements.

Difference Between the Spike Indicator and the Volume Indicator

The Spike Indicator focuses on sudden, sharp price movements in short timeframes. The Volume Indicator shows trading activity over time. The Spike Indicator relies on price changes and is identified by large candles on charts. The Volume Indicator shows the number of shares or contracts traded.

These indicators complement each other. High volume can confirm a spike, signaling strong price movement. For instance, increased volume shows strong demand. Low volume may indicate weakness. Combining the Spike Indicator with volume enhances analysis accuracy.

Spike Indicator Guide: Day Trading Volatility Strategy

Difference Between the Spike Indicator and the ATR Indicator

The ATR Indicator measures the average price range over a set period, usually 14 days. The Spike Indicator focuses on short-term, sudden price movements.

While ATR analyses overall market volatility, the Spike Indicator highlights short-term changes. ATR is used to set stop-loss levels, while the Spike Indicator helps identify quick entry and exit points. Combining both offers a more accurate analysis.

FeatureSpike IndicatorATR IndicatorBollinger Bands
FocusSudden, sharp price jumps.Average price range (Volatility).Market volatility & Ranges.
Best ForIdentifying Entry/Exit points.Setting Stop-Loss levels.Detecting Overbought/Oversold.
TimeframeShort-term (Instant).Long-term (14-day average).Range-bound markets.

Difference Between the Spike Indicator and the Bollinger Bands Indicator

The Bollinger Bands Indicator uses a simple moving average with two bands to identify market volatility. The Spike Indicator focuses on sharp price movements in short periods.

Bollinger Bands help identify overbought or oversold conditions in range-bound markets. The Spike Indicator is better for short-term trades and price jumps. Combining the Spike Indicator with Bollinger Bands can enhance analysis. Spikes near the bands may provide stronger entry or exit signals.

Spike Indicator Guide: Day Trading Volatility Strategy
sms-star

Key Insight:

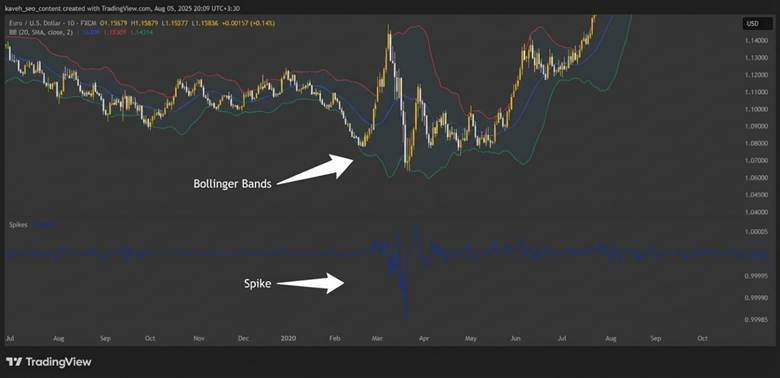
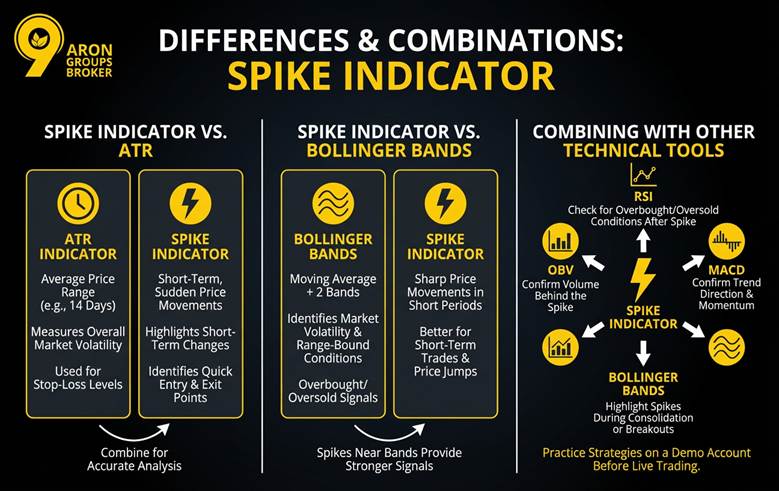
The Spike Indicator focuses on price movements, while Bollinger Bands are more suited for volatility and market range analysis. Combining both can offer better trade decisions.

How to Add and Adjust the Spike Indicator in MetaTrader and TradingView

The Spike Indicator isn’t available by default, so add it as a custom script. For MetaTrader (MQL4/MQL5), download the indicator, install it in the Indicators folder, and restart the platform.

spike indicator

In TradingView, use Pine Script to code the Spike Indicator and add it to the chart. Adjust parameters like sensitivity to price changes and volume for better accuracy. Test the Spike Indicator on a demo account before using it live.

spike indicator

Combining the Spike Indicator with Other Technical Tools

Combine the Spike Indicator with tools like RSI, MACD, and Bollinger Bands to improve accuracy. For example, after a spike, check the RSI for overbought or oversold conditions to find the best entry.

MACD shows trend direction and momentum, helping confirm the spike’s validity. Bollinger Bands highlight spikes during consolidation or breakouts. The OBV Indicator confirms volume behind the spike. Practice these strategies on a demo account before live trading.

spike indicator

Q: How can combining Spike Indicator signals with order book data improve trade accuracy?

A: By observing spikes alongside real-time order book depth, traders can verify whether a price spike is supported by genuine buying/selling pressure. If a spike occurs but the order book shows thin liquidity, the movement might be temporary. This combination reduces the likelihood of entering trades on fake spikes.

sms-star

Pro Tip: 

Combining the Spike Indicator with tools like RSI, MACD, and Bollinger Bands to refine your trading strategy and reduce false signals.

Conclusion

The Spike Indicator helps traders identify key market moments and take advantage of rapid price fluctuations. However, using this tool alone is not enough for success. It should be combined with careful analysis and complementary tools for more informed decisions. Traders should practice on demo accounts to improve their skills and avoid common mistakes. Studying reliable sources and keeping trading knowledge up-to-date is crucial for progress in financial markets. Mastering the Spike Indicator and smart management can lead to consistent profitability.

Continue Reading
not-found
calendar 31 December 2025
Rate this article
Plugin not installed

Leave a Reply

Your email address will not be published. Required fields are marked *

No thanks