


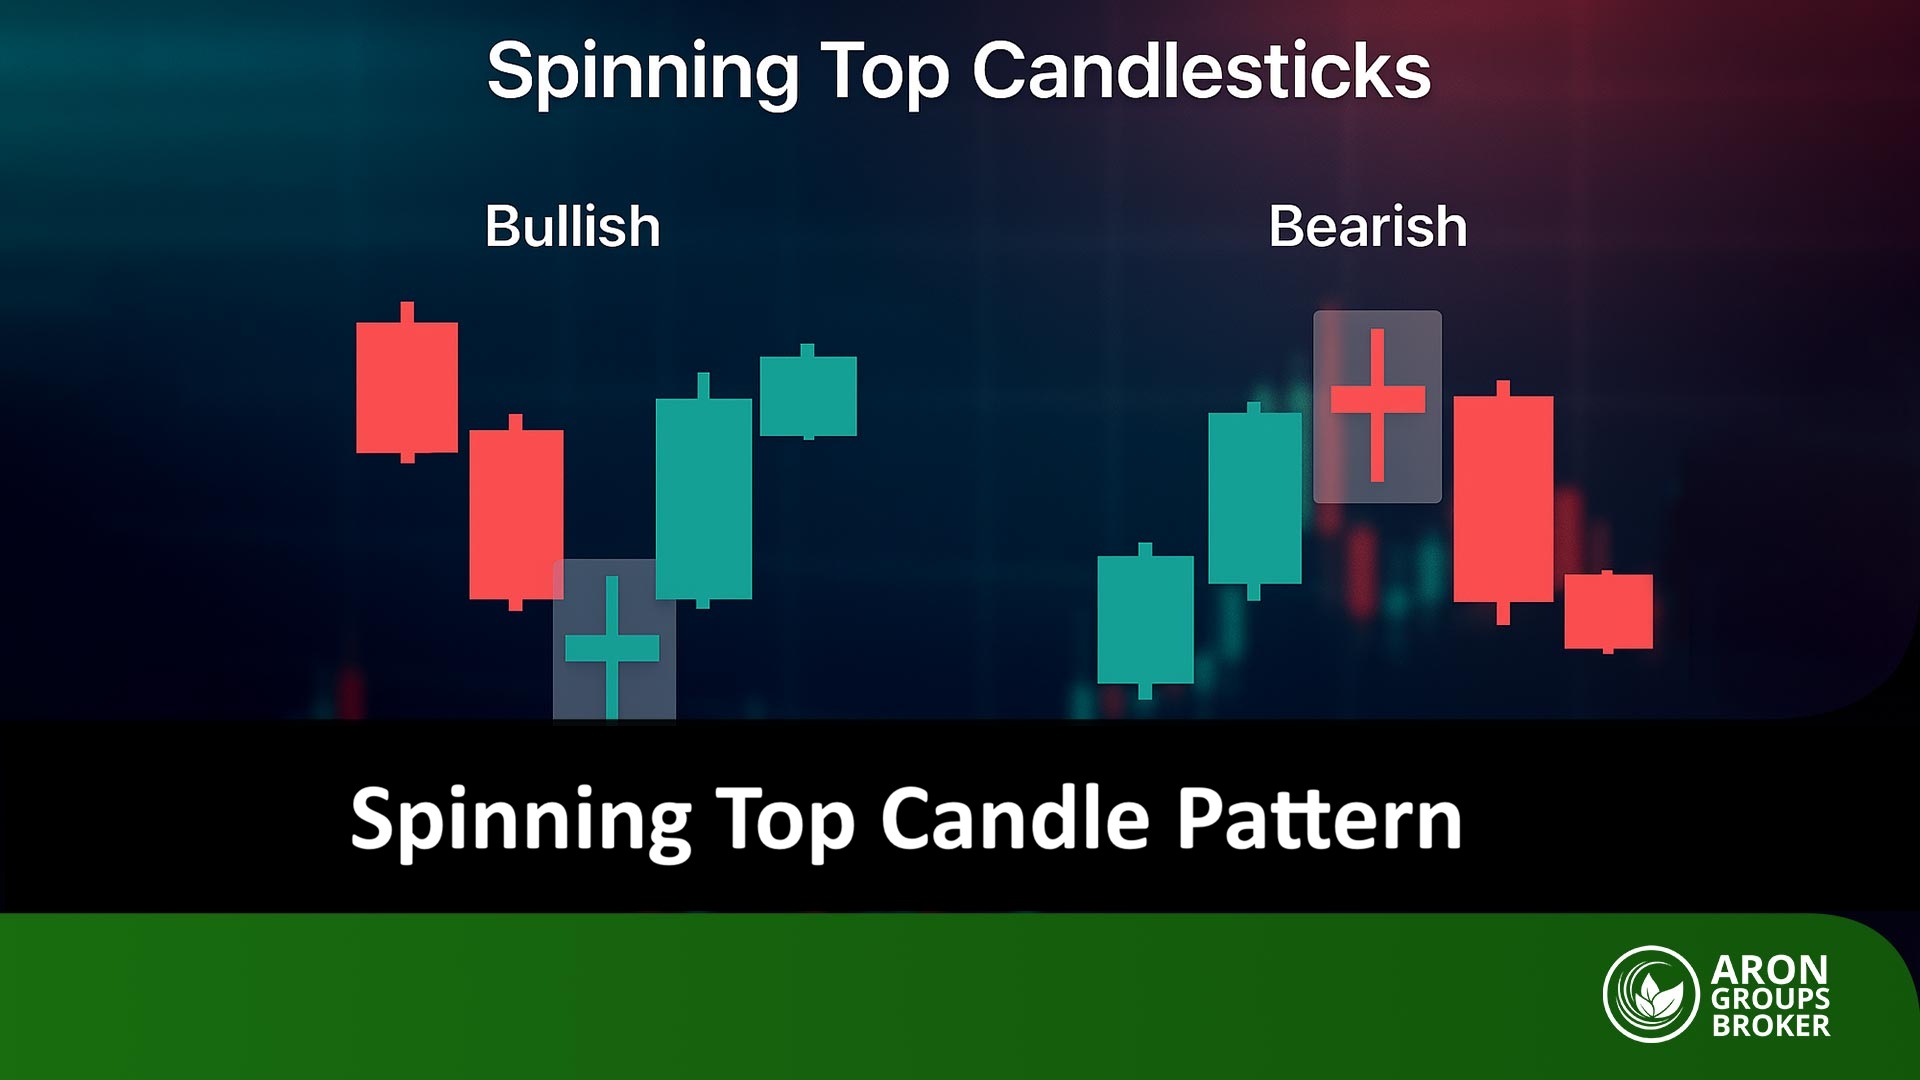


Financial markets are full of signals that appear on price charts in the form of candlesticks. One of the most important of these is the spinning top candle pattern. This candle forms when the market reaches a relative balance between buyers and sellers, with neither side able to take full control of the trend.
Therefore, the spinning top candle is recognised as a sign of market indecision, often appearing at critical moments before a potential trend continuation or reversal.

- The spinning top candle is more reliable on higher timeframes, such as daily or weekly charts, compared with lower timeframes.
- The appearance of multiple spinning top candles in succession signals stronger market indecision and increases the likelihood of a potential trend change.
- A spinning top candle pattern forming near major economic news releases may serve as an early warning of heightened market volatility.
- When a candle with a spinning top appears alongside unusually high or low trading volume, it can provide a more powerful and meaningful signal.
What Is the Spinning Top Candle Pattern and What Are Its Key Characteristics?
According to CFI, the spinning top candle pattern is a key candlestick formation, widely interpreted by traders as a clear signal of market indecision and balance.
This pattern forms when buyers and sellers apply strong pressure within the same period, yet neither side is able to decisively push the price in a single direction.
The result is a spinning top candle with a small body and long upper and lower wicks, reflecting a balance between bullish and bearish forces.
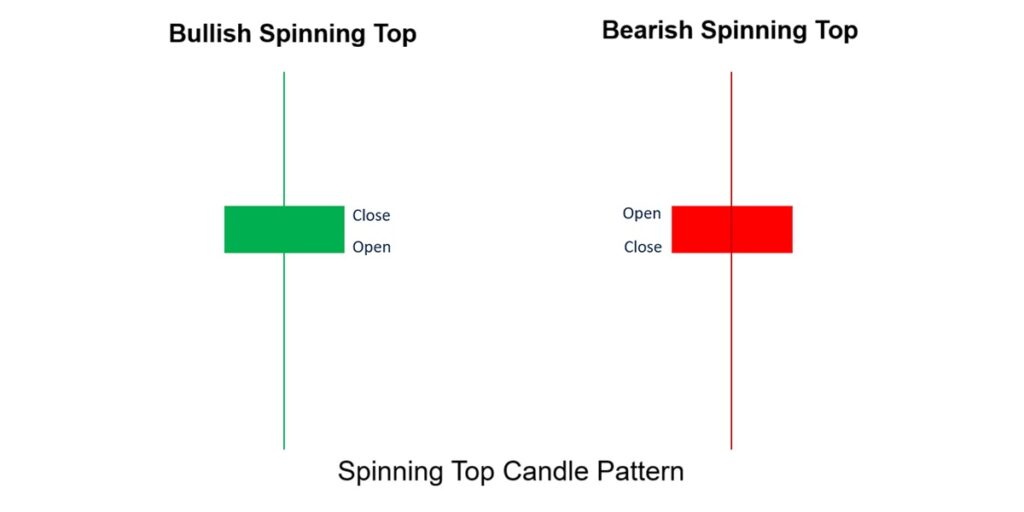
Key Characteristics of a Spinning Top Candle
- Small body: Indicates a minimal difference between the opening and closing prices. As a result, the price closes near its opening level, reflecting a lack of clear directional momentum.
- Long upper and lower wicks: show price tested higher and lower levels during the session but failed to hold either, signalling rejection from both sides.
- Neutral nature: Because neither buyers nor sellers gain full control, the spinning top candle on its own is not a definitive buy or sell signal. It should be analysed alongside the following candle or combined with supporting tools such as indicators and key support and resistance levels.
The Psychology Behind the Spinning Top Candle
The spinning top candle reflects an ongoing struggle between supply and demand, with neither side gaining clear control over price action.- At the peak of an uptrend, a spinning top candle can signal weakening buying pressure and warn of a potential price correction or early trend reversal.
- At the bottom of a downtrend, this pattern suggests seller exhaustion and may signal a possible upward reversal.
- In a sideways or ranging market, A spinning top candle typically indicates continued indecision, with price likely to remain confined within the existing range.
Table: Market Psychology Behind the Spinning Top Candle
| Market Context | What the Spinning Top Suggests |
|---|---|
| Top of an uptrend | Buyer fatigue and loss of momentum |
| Bottom of a downtrend | Seller exhaustion |
| Ranging market | Continued indecision, no edge |
| Near news events | Compression before volatility |
How to Trade the Spinning Top Candle Pattern
In the chart example, a spinning top candle forms after a clear uptrend. This candle signals market indecision, but it does not justify an immediate trade. Instead, traders should wait for a confirmation candle before taking any position.
In this case, the following candle closes as a red, bearish candle, confirming a loss of bullish momentum. This confirmation suggests the end of the uptrend and the potential start of a price correction or a new bearish move.

How to Define Entry and Exit Points Using the Spinning Top Candle
Short Entry (Sell Setup):
When a spinning top candle forms near the top of an uptrend, traders should wait for a valid bearish confirmation.
A short position can be considered once the next candle closes below the low of the spinning top candle.
This entry should be executed with position sizing aligned with proper risk management and realistic volume conditions.
Exit and Take-Profit Strategy:
- First target: The nearest support level or the previous market low.
- Secondary targets: Key technical levels such as Fibonacci retracement levels (e.g. 38.2% or 61.8%) or pivot levels.
- In strong trends, traders may partially close the position at the first target and hold the remaining portion for deeper downside levels.
In simple terms, entries should only be taken after clear confirmation, while exits should be staggered and based on key technical levels. This approach helps lock in profits while reducing the risk of sharp price reversals.
Q: How can spinning top patterns be used to detect trap setups in trending markets?
A: In strong trends, a spinning top at an obvious breakout level can be a trap for traders expecting continuation. If the next candle reverses sharply, it indicates that early breakouts failed and late entrants may be caught on the wrong side. Recognising this helps traders avoid false entries and refine timing.
Setting Stop-Loss Levels with the Spinning Top Candle
Risk management is critical when trading the spinning top candle pattern. This formation is not a standalone signal, which means a clearly defined stop-loss is essential to protect capital and avoid emotional decision-making.
For short (sell) trades:
When a bearish spinning top candle forms near the top of an uptrend and is followed by a bearish confirmation candle, a short entry becomes valid. In this scenario:
- The stop-loss should be placed slightly above the high (upper wick) of the spinning top candle.
- If price breaks above this level, it signals that bearish pressure has failed and the downside scenario is invalid.
For long (buy) trades:
If a bullish spinning top candle appears near the bottom of a downtrend and is confirmed by a bullish candle, a long position may be considered. In this case:
- The stop-loss should be set below the low (lower wick) of the spinning top candle.
- A move below this level indicates continued selling pressure and invalidates the bullish setup.
In terms, placing the stop-loss beyond the candle’s extreme helps filter false signals and ensures rapid exits when market structure shifts against the original bias.

Pro Tip:
Using the ATR indicator or a fixed percentage of capital to set the stop-loss beyond the wicks helps limit the impact of short-term market volatility.
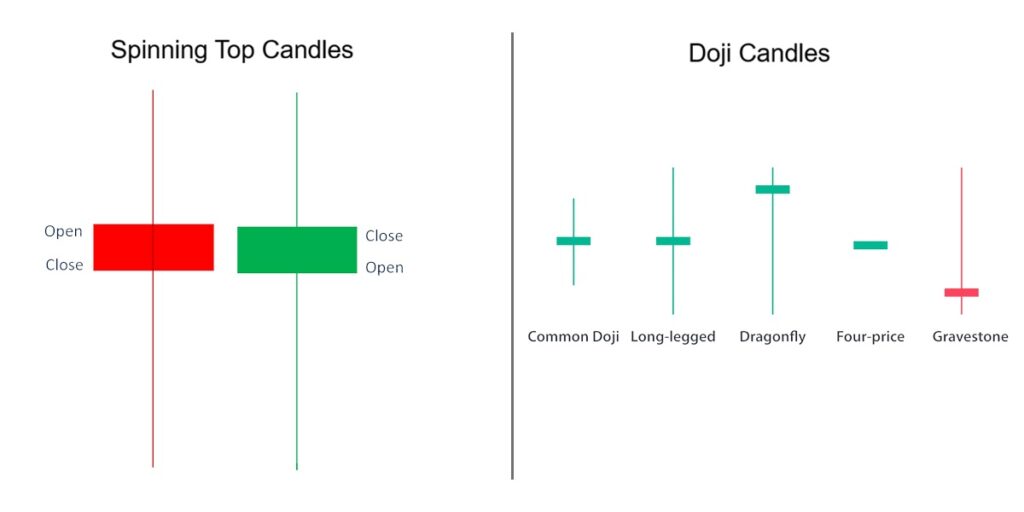
Difference Between the Spinning Top and Doji Candles
Both the spinning top candle and the doji signal market indecision, but a key structural difference between them significantly influences how traders interpret and trade each pattern.
Spinning Top Candle:
- Has a small real body, meaning there is a slight difference between the opening and closing prices.
- Features relatively long and balanced upper and lower wicks, showing that the price moved significantly in both directions during the session.
- Indicates that the market tested higher and lower levels but eventually closed close to the opening price, reflecting hesitation rather than full equilibrium.
Doji Candle:
- Has almost no real body, as the opening and closing prices are nearly identical.
- The candle is mainly composed of wicks, highlighting a near-perfect balance between buyers and sellers.
Suggests complete indecision, with neither side able to secure even a marginal advantage by the close.
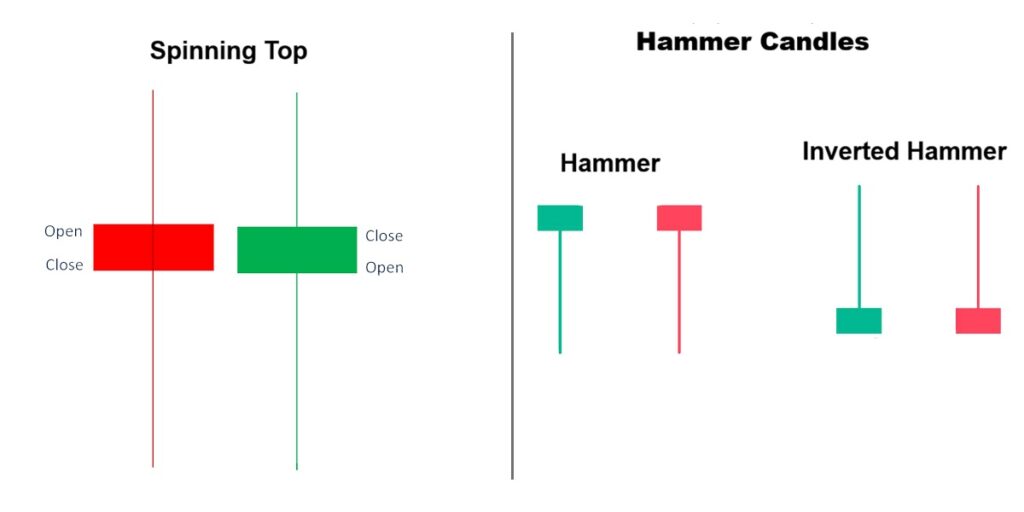
Difference Between the Spinning Top and Hammer Candles
Both the spinning top candle and the hammer candle are widely used in price action analysis, yet they differ significantly in structure, context, and the market signals they provide.
- A spinning top candle indicates market indecision, characterised by a small body and balanced upper and lower wicks.
- A hammer candle has a small body near the top and a long lower wick, signalling seller weakness.
In short, the hammer appears at the bottom of a downtrend, signalling a bullish reversal, while the spinning top requires confirmation and has no bias.
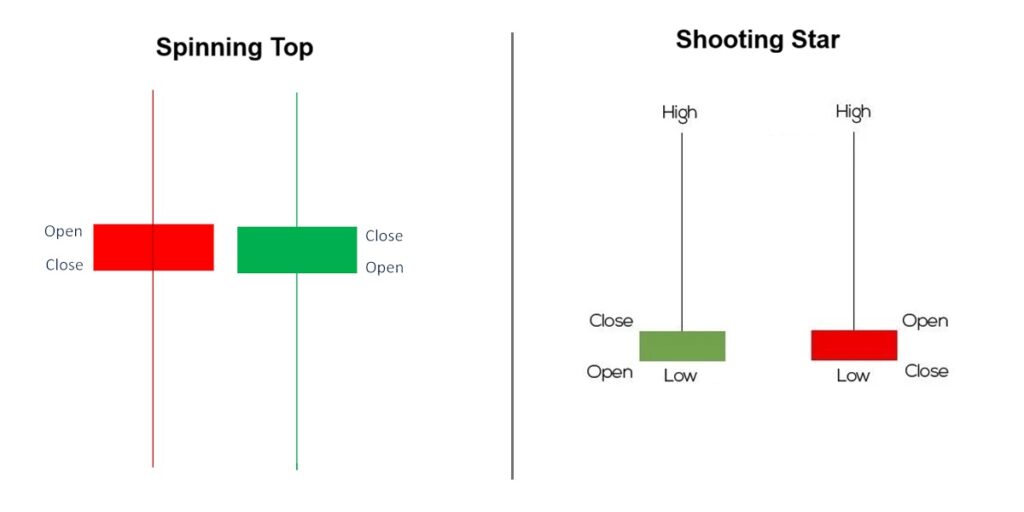
Difference Between the Spinning Top and Shooting Star Candles
Shooting Star Candle:
- Has a small body near the bottom of the candle.
- Features a very long upper wick, showing strong rejection of higher prices.
- Commonly appears at the top of an uptrend.
- Signals buyer weakness and a potential bearish reversal, especially when confirmed by a bearish candle.
In short, a spinning top needs confirmation and has no inherent bias, while the shooting star gives a bearish reversal signal in the context.
Key Insight:
When a spinning top candle forms at a key POI in RTM price action, it can trigger the market’s next impulsive or explosive price move.
Table: Spinning Top vs Hammer vs Shooting Star (At a Glance)
| Pattern | Bias | Typical Location |
|---|---|---|
| Spinning Top | Neutral | Anywhere |
| Hammer | Bullish | Bottom of downtrend |
| Shooting Star | Bearish | Top of uptrend |
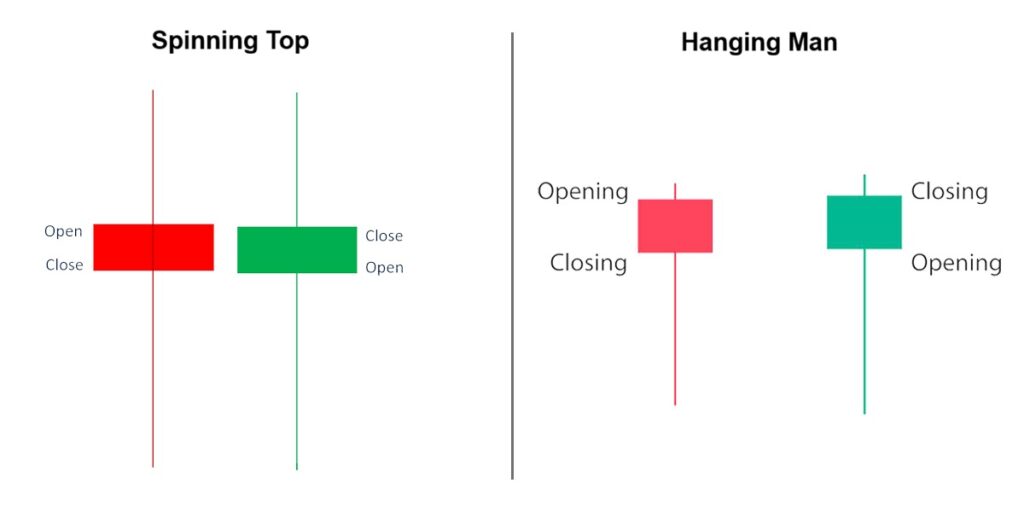
Difference Between the Spinning Top and the Hanging Man
The Hanging Man candlestick has a small real body near the top of the range and a long lower wick. It typically appears at the peak of an uptrend and serves as a warning signal for a potential bearish reversal.
In practical terms, this pattern suggests that selling pressure has entered the market, despite the price managing to close near its highs.
As a result, it often reflects weakening buyer strength and the early stages of a possible trend shift to the downside.
Combining the Spinning Top Candle with Fibonacci
In the chart, multiple spinning top candles form around the 0.5 and 0.618 Fibonacci retracement levels. This confluence is significant, as these levels are widely regarded as high-probability price reaction zones.
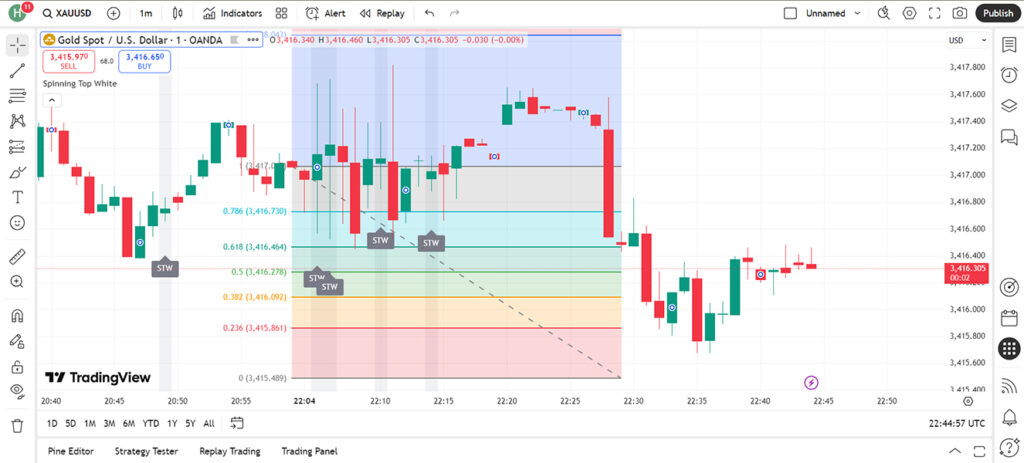
A spinning top candle signals indecision, but at a Fibonacci level it highlights equilibrium between buyers and sellers at a critical technical zone.
In practical terms:
- Bullish scenario: If a spinning top candle appears on a Fibonacci level and the next candle closes bullish, it may indicate a buy entry signal.
- Bearish scenario: If the following candle closes bearish and below the Fibonacci level, it suggests a sell signal.
In the chart, several spinning top candles are visible around the 0.618 Fibonacci retracement. This clustering highlights strong hesitation at that level. The subsequent strong bearish candles confirm that sellers eventually took control, marking the start of a downward move.
Combining the Spinning Top Candle with MACD
When a spinning top candle appears at the top of a trend alongside a bearish MACD crossover, it provides a valid sell signal.
Conversely:
- If a spinning top candle forms near the bottom of a trend
- And is confirmed by a bullish MACD crossover
A buy signal is likely to emerge.
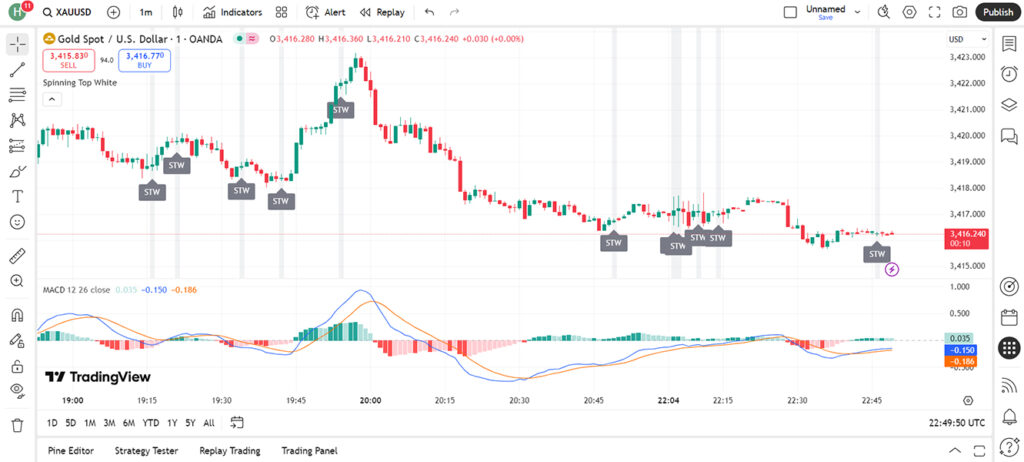
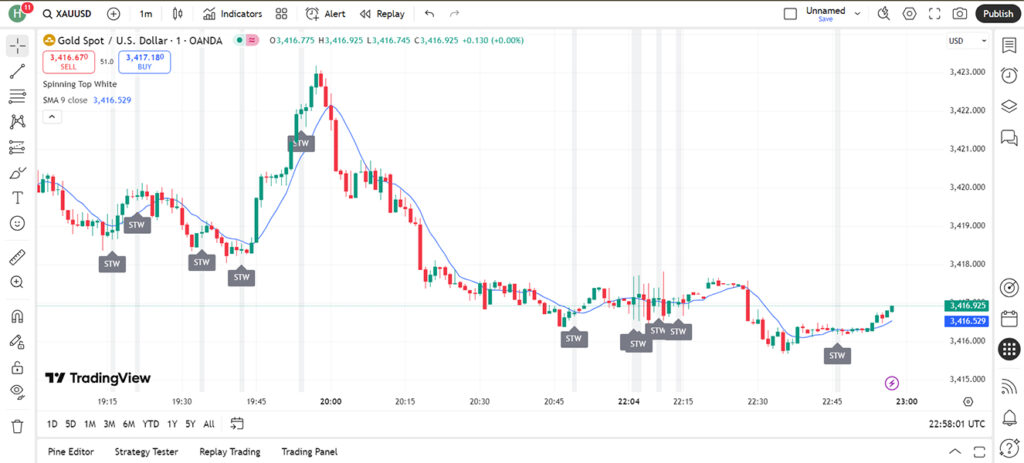
As shown on the chart in TradingView, a spinning top candle formed around 20:00, near the top of the chart. At the same time, the MACD indicator shifted into a bearish phase, with the histogram moving into negative territory.
This confluence strongly signalled the end of the bullish trend and the start of a downward move.
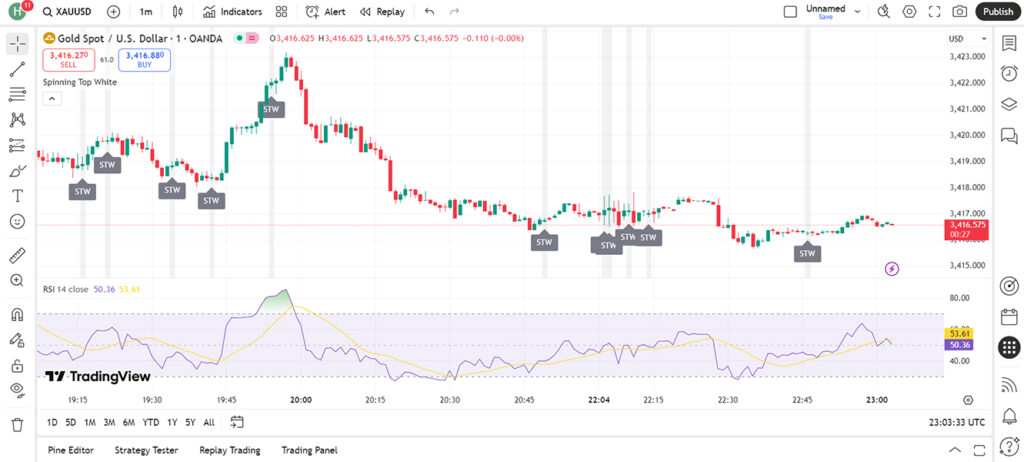
Later, around 22:00, several spinning top candles appeared near the bottom of the price range. Subsequently:
- The MACD lines converged
- Early signs of bullish divergence emerged on the histogram
This setup shows weakening selling pressure, suggesting the market may be preparing for a bullish reversal or, at minimum, a temporary pause in the bearish trend.
Key Insight:
When multiple spinning top candles form on lower timeframes, they often compress into one candle on higher timeframes, signalling price consolidation before a potential breakout.
Combining the Spinning Top Candle with Moving Averages
Pairing a spinning top candle with a moving average can deliver more reliable entry and exit signals.
This combination helps traders confirm market indecision within the context of the prevailing trend, reducing false signals.
- Spinning Top with a Moving Average Break (Bearish Setup):
A spinning top near resistance, followed by candles closing below a moving average, signals buyer weakness and a potential bearish reversal.
Example: Around 20:00, a spinning top forms at the peak, and the price later closes below the SMA, confirming downside momentum.
- Spinning Top with a Move Above the Moving Average (Bullish Setup):
A spinning top at the bottom of a trend, followed by candles closing above the moving average, suggests a possible bullish reversal.
Example: Around 22:00, multiple spinning tops appear near the lows, and the price stabilises above the SMA.
Spinning Top Combined with RSI
Using the spinning top candle with RSI helps identify reversals or trend continuation, particularly when RSI signals momentum exhaustion or recovery.
- Spinning Top in Overbought Conditions (RSI)
When a spinning top candle forms near the top of the chart while the RSI is above 70, it signals buyer exhaustion.
This combination often acts as an early warning of a price correction or a bearish reversal.
Example:
Around 20:00, a spinning top appeared at the market high as RSI moved above 70 and then dropped sharply—confirming the start of a downward move.
- Spinning Top in Oversold Conditions (RSI)
If a spinning top candle forms near the bottom of the chart with the RSI below 30, it suggests weakening selling pressure.
In such conditions, the probability of a bullish rebound increases.
Example:
Around 22:00, several spinning top candles formed near the lows as RSI approached oversold levels, signalling seller exhaustion and the early stages of a price recovery.
Common Mistakes to Avoid When Trading the Spinning Top Candle
- Trading spinning tops in isolation
The spinning top candle signals indecision, not direction. Trading it without confirmation is guesswork. - Ignoring the broader trend
A spinning top can indicate continuation or reversal, depending on the trend strength and market structure. - Overusing it on very low timeframes
On lower timeframes, spinning tops appear frequently due to noise and require confirmation from higher timeframes. - Skipping volume or momentum checks
Without volume, RSI, or MACD confirmation, spinning top signals lose reliability. - Expecting immediate reversals
Spinning tops often mark pauses or compression, not instant trend changes.
Pro Tip:
Volume Tells the Truth:
A Spinning Top with Low Volume means "lack of interest". A Spinning Top with High Volume means "violent struggle". High volume spinning tops at Support/Resistance are much stronger reversal signals.
Conclusion
The spinning top candle on its own is merely a sign of market indecision. Its real value emerges when it is analysed alongside confirmation tools such as Fibonacci levels, MACD, moving averages, and RSI. These combinations enable traders to convert hesitation in price action into actionable entry or exit signals.
The importance of the spinning top candle lies in highlighting critical chart areas and warning that the market may be approaching a potential shift in direction.
When used in conjunction with reliable confirmation indicators, it can significantly enhance risk management and lead to more informed trading decisions.


