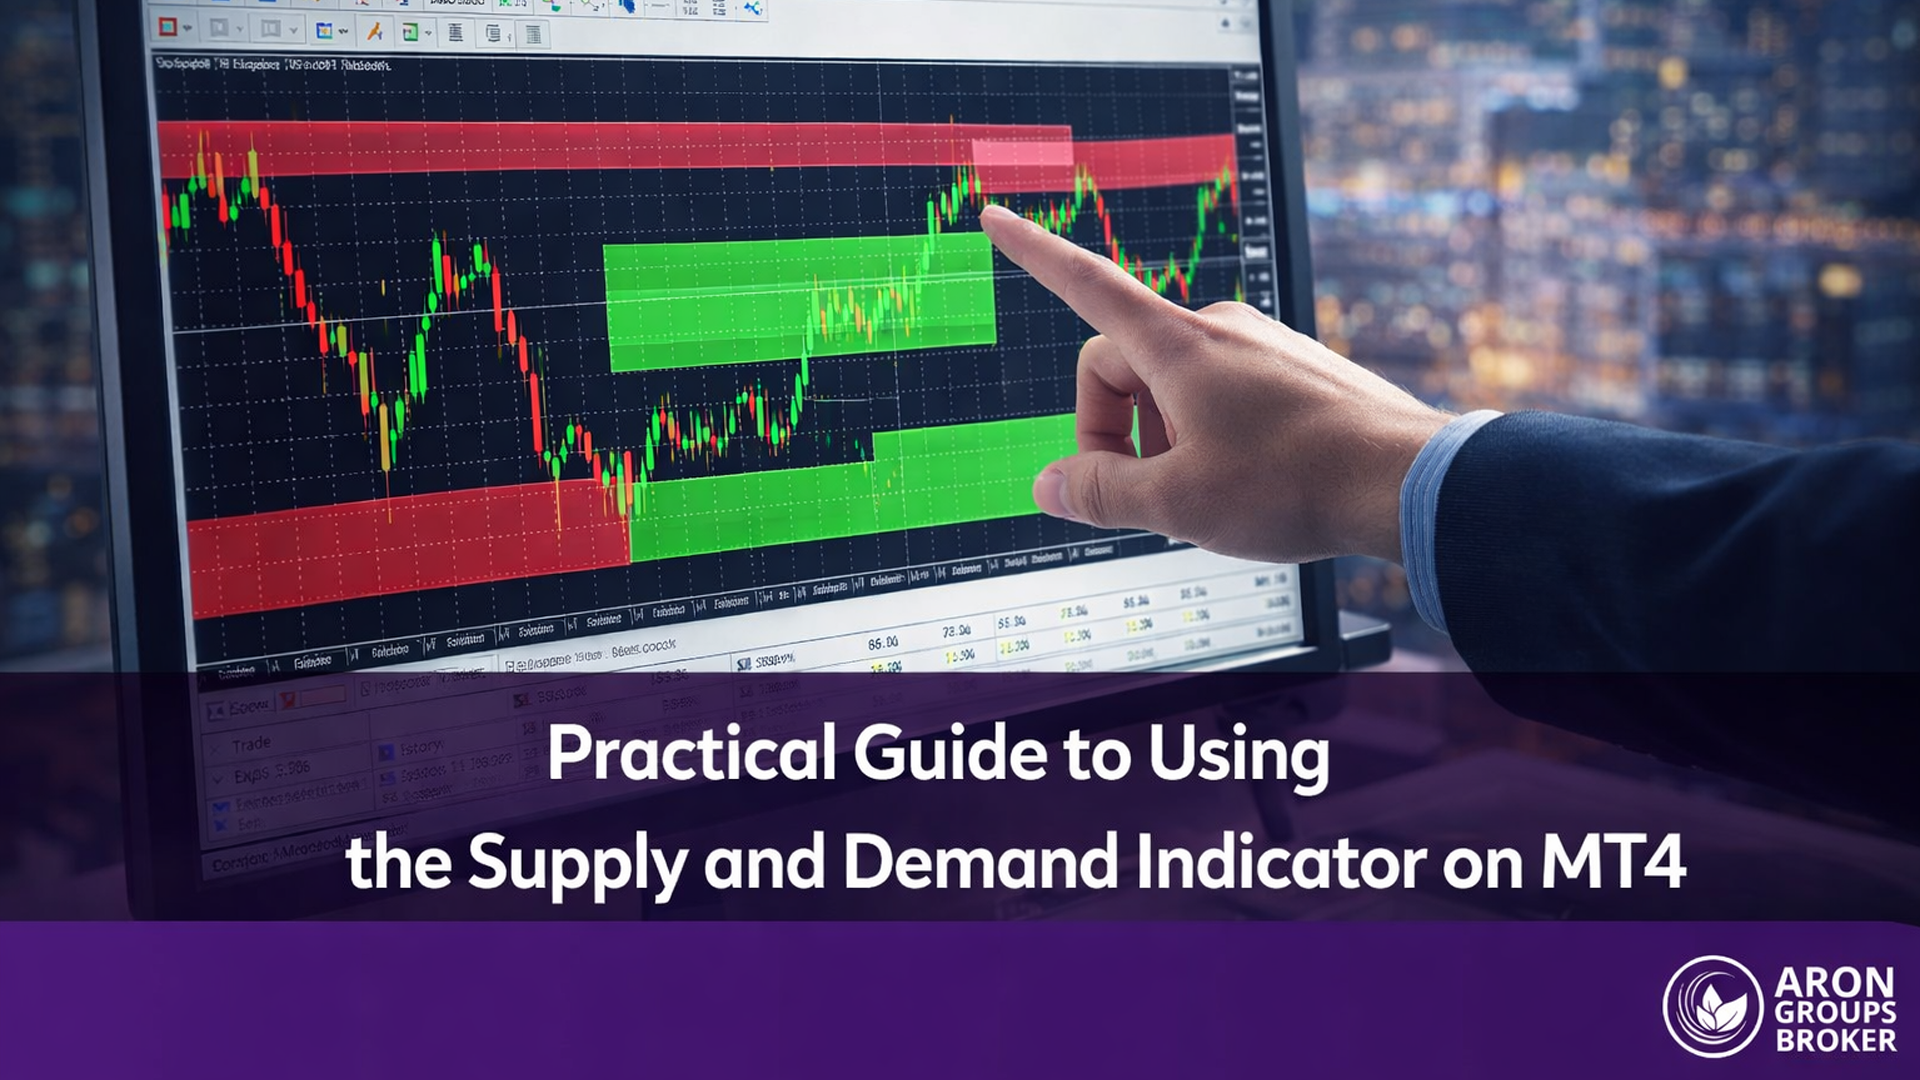


Institutional price levels rarely appear as single candles. They form as structured zones where large-volume participants have placed orders in the past, and the Supply and Demand Indicator MT4 exists to isolate these zones automatically. Rather than scanning every chart by hand, traders can leverage this indicator to surface the exact price regions where buying or selling pressure previously shifted the market.
This guide walks through how the indicator works, how to install and configure it within MetaTrader 4, and how to interpret the zones it produces. Whether the goal is to refine entries on a swing trade or filter intraday setups, understanding how the tool marks supply-demand zones on an MT4 chart is a meaningful upgrade to any price-action workflow.
The sections that follow cover automatic zone detection, fresh zone alerts, pattern recognition for rally-base-rally and drop-base-drop formations, and practical guidance on combining indicator signals with manual analysis for higher conviction trades.

- The Supply and Demand Indicator MT4 automatically draws institutional supply and demand zones, removing the need for manual identification on every timeframe.
- Fresh zone alerts highlight untested price levels where the first reaction is statistically more reliable.
- Rally-base-rally and drop-base-drop patterns detected by the indicator signal continuation opportunities with clearly defined risk boundaries.
- Combining the indicator with fair value gap analysis and hidden base detection adds a layer of confluence that strengthens trade selection.
- Manual overlay alongside the automated tool allows traders to filter out weaker zones and focus only on high-probability setups.
Overview of the Supply and Demand Indicator MT4
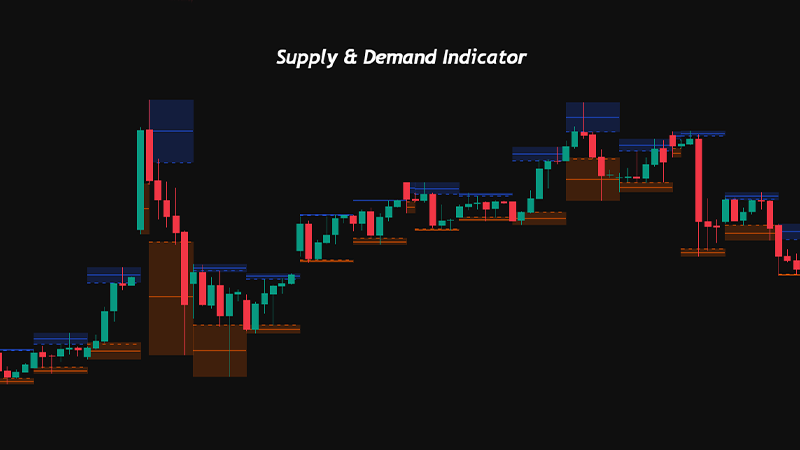
The Supply and Demand Indicator MT4 identifies price zones where significant buying or selling activity occurred historically. It plots these zones directly onto the chart as rectangular shaded areas, giving traders a visual map of where the price is likely to react.
Unlike traditional support and resistance lines, which reduce a price level to a single horizontal mark, this indicator defines a range. That range represents the full extent of the base candle or candles that preceded a strong impulsive move. The wider the base and the more aggressive the departure, the more significant the zone.

Risk Disclosure
CFDs are complex instruments and come with a high risk of losing money rapidly due to leverage. You should consider whether you understand how CFDs work and whether you can afford to take the high risk of losing your money. Past performance is not indicative of future results. This content is provided for educational purposes only and does not constitute investment advice.
Key Benefits of Using the Supply and Demand Indicator MT4
The primary advantage is speed. Manually scanning multiple timeframes for valid zones is time-intensive, and the indicator compresses that process into seconds. Beyond efficiency, the tool enforces consistency. Every zone is drawn using the same algorithmic logic, which removes the subjectivity that often leads to inconsistent manual markings.
The indicator also enables traders to monitor several instruments simultaneously. Because zone identification is automated, there is no need to memorise levels across different pairs or commodities. The chart displays the relevant zones in real time, and alerts can notify the trader when price approaches a marked area.
Did You Know? Institutional order flow studies suggest that unfilled orders at supply and demand zones can remain active for weeks or even months. The first retest of a fresh zone tends to produce the strongest reaction, which is why auto-detected fresh zones are particularly valuable for timing entries. |
Key Features of Auto Supply Demand Indicators
Auto supply demand indicators bring a layer of automation that goes beyond basic zone drawing. The features outlined below represent the core functionality that differentiates a well-designed indicator from a simple support-resistance plotter.
Automatic Detection of Supply Demand Zones MT4
The detection algorithm analyses historical price action to identify areas where a strong impulsive move originated from a consolidation or base. It evaluates the ratio between the base width and the departure candle strength, filtering out weak formations that are unlikely to hold on a retest.
Most quality indicators allow the trader to set a minimum departure-to-base ratio. A ratio of 2:1 or higher typically signals a zone where institutional participation was significant. Zones that fail this threshold are either excluded entirely or displayed with a different visual weight so the trader can deprioritise them.
Fresh Zone MT4 Alerts for Early Opportunities
A fresh zone is one that the price has not revisited since the initial departure. These zones carry the highest probability of producing a meaningful reaction because the unfilled orders that created them remain untouched. The indicator marks fresh zones distinctly, often with a brighter colour or a dedicated label, and triggers an alert when the price approaches within a configurable distance.
Traders who rely on fresh zone alerts gain a significant timing advantage. Instead of watching the chart continuously, they receive a notification precisely when a high-probability level is about to be tested. This is especially useful for traders managing multiple pairs or operating on higher timeframes where zone tests may occur days apart.
Configuring Auto Supply Demand Indicator Settings
Configuration typically involves three core parameters. The first is the lookback period, which determines how far back the algorithm searches for valid zones. A longer lookback captures older institutional levels but risks cluttering the chart. The second is the minimum zone strength threshold, often expressed as a ratio or a percentage. The third is the alert trigger distance, measured in pips or points, which defines how close price must come before the alert fires.
Adjusting these settings requires balancing sensitivity with clarity. Overly sensitive settings produce too many zones, diluting the value of each one. Conservative settings may miss valid levels. A practical starting point for EURUSD on the H1 timeframe is a lookback of 200 bars, a strength threshold of 2:1, and an alert distance of 15 pips.
Pro Tip: Start with a 200-bar lookback, 2:1 strength ratio, and 15-pip alert distance for EUR/USD H1. Adjust slightly for volatility, but avoid overloading the chart with zones.
Q: Does the auto supply demand indicator replace manual zone analysis entirely?
A: Not entirely. The indicator handles detection speed and consistency, but manual review remains essential for context. A zone that sits directly beneath a higher-timeframe resistance level, for instance, carries less weight as a demand zone. The indicator marks the zone; the trader decides whether the broader context supports a trade.
Setting Up the Indicator on MT4
Installing and configuring the Supply and Demand Indicator on MetaTrader 4 is straightforward, though a few steps require attention to folder structure and file placement.
Installing the Supply and Demand Indicator MT4
Begin by downloading the indicator file, which will have an .ex4 or .mq4 extension. Open MetaTrader 4 and navigate to File, then Open Data Folder. Inside the data folder, locate the MQL4 directory and open the Indicators subfolder. Copy the downloaded indicator file into this directory.
Return to the MT4 terminal and right-click on the Navigator panel under Indicators. Select Refresh. The indicator should now appear in the list. Drag it onto any chart to activate it. If the indicator requires DLL imports or external library access, ensure these permissions are enabled in the Common tab of the indicator dialogue box.
Adjusting Visuals and Alerts for Optimal Clarity
Once the indicator is active, open its settings by double-clicking the indicator name in the chart’s indicator list. The Inputs tab controls algorithmic parameters such as lookback period and zone strength. The Colours tab allows customisation of supply zone and demand zone colours. Using contrasting colours, such as red shading for supply and blue for demand, improves readability at a glance.
Enable the alert function within the Inputs tab and set the trigger distance to a value appropriate for the instrument’s average range. For volatile pairs like GBPJPY, a larger trigger distance prevents premature alerts. For tighter-spread instruments like EURUSD, a smaller distance is preferable. Visual settings such as zone opacity and border thickness can also be adjusted to avoid cluttering lower timeframes.
Identifying High-Probability Zones Using the Indicator
Drawing zones is one thing. Selecting which zones deserve attention is another. The indicator provides the raw data; the trader must apply filters to isolate the setups with genuine institutional significance.
Checklist: Evaluating High-Probability Supply and Demand Zones
- Departure candle is sharp relative to base size
- Base is 1–3 candles with small wicks
- Zone has not been retested (fresh zone)
- Multi-timeframe alignment confirmed (entry vs structure timeframe)
- Confluence factors present: fair value gap, volume spike, hidden base
Spotting Supply Demand Zones MT4 with Accuracy
High-probability zones share several characteristics. The departure from the zone is sharp and covers a large range relative to the base. The base itself consists of one to three candles with small bodies and limited wicks, indicating tight consolidation before the move. The zone has not been retested, marking it as fresh.
The indicator highlights zones meeting these criteria, but the trader should cross-reference with the higher timeframe. A demand zone on the M15 chart that aligns with a daily demand zone carries significantly more weight than one that sits in the middle of a daily supply zone. Multi-timeframe alignment is the single most effective filter for zone quality.
Trading Tip
Apply the indicator on two timeframes simultaneously: one for structure (H4 or Daily) and one for entries (M15 or H1).
Only take trades where the entry-timeframe zone aligns with a same-direction zone on the structural timeframe.
Detecting Rally Base Rally and Drop Base Drop Patterns Using the Indicator
Rally-base-rally (RBR) and drop-base-drop (DBD) are continuation patterns. In an RBR formation, price rallies, pauses in a tight base, and then rallies again. The base between the two rallies forms a demand zone. In a DBD formation, the logic is inverted: price drops, consolidates, and drops further, leaving a supply zone at the base.
The indicator identifies these patterns by detecting bases that occur within an existing trend rather than at reversal points. Continuation zones are often narrower and faster-forming than reversal zones, which means the indicator’s sensitivity settings must be calibrated to capture them. Lowering the minimum base width parameter slightly can help surface these formations without introducing excessive noise.
Q: How can a trader confirm whether a detected zone is likely to hold?
A: Confluence is the most reliable confirmation method. Check whether the zone aligns with a higher-timeframe level, whether a fair value gap exists in the same region, and whether volume increased during the departure move. Zones with two or more confluence factors have a materially higher probability of producing a reaction.
Applying the Indicator in Your Trading Strategy
Zone identification is only the first step. Translating indicator output into executable trades requires a clear framework for entries, exits, and position sizing.
Entry and Exit Strategies Using Supply and Demand Indicator MT4
The standard entry approach involves placing a limit order at the edge of the zone closest to current price. For a demand zone, this means a buy limit at the upper boundary. For a supply zone, a sell limit at the lower boundary. The logic is that price will enter the zone and react before reaching the opposite edge.
An alternative approach waits for the price to enter the zone and then produces a confirmation candle, such as a pin bar or an engulfing pattern, before entering via a market order. This method sacrifices some reward-to-risk ratio in exchange for higher confirmation. Exit targets are typically set at the nearest opposing zone or at a defined risk-to-reward multiple. Partial profit at 1R with the remainder trailing to the opposing zone is a commonly used structure.
Read More: Order Block and Breaker Block Indicators
Risk Management Based on Indicator Signals
Stop-loss placement depends on zone type. For demand zones, the stop sits below the lower boundary of the zone. For supply zones, it sits above the upper boundary. The zone edges represent the point at which the institutional thesis is invalidated: if price moves through the entire zone, the orders that created it have been absorbed.
Position sizing should reflect the distance between entry and stop. Wider zones require smaller position sizes to maintain risk management. A fixed percentage model, risking 1% of account equity per trade, adapts naturally to varying zone widths. This ensures that a stop-out on a wide daily zone carries the same monetary impact as one on a narrow M15 zone.
Key Point:
Never adjust a stop-loss to sit inside the zone boundary. The full zone width represents the institutional footprint.
If the zone is too wide for the account's risk tolerance, reduce position size rather than tightening the stop.
Optimising Trades with Supply and Demand Indicator MT4
Beyond basic zone identification, advanced techniques allow traders to extract more value from the indicator’s output. Fair value gaps and hidden bases represent two refinements that improve trade selection.
Understanding Fair Value Gaps with Supply and Demand Indicator
A fair value gap (FVG) occurs when a strong impulsive candle leaves a gap between the high of the candle before it and the low of the candle after it. These gaps represent areas where the price moved too quickly for the market to process orders efficiently. When an FVG overlaps with a supply or demand zone, the confluence strengthens the level considerably.
The Supply and Demand Indicator does not always mark FVGs explicitly, but traders can overlay an FVG indicator or identify them visually. The intersection of a fresh demand zone and an unfilled FVG directly above it creates a high-probability entry area with clearly defined invalidation.
Read More: Fair Value Gap Trading Strategy
Identifying Hidden Bases on MT4 Charts
A hidden base forms when consolidation occurs within a single candle’s body or wick rather than across multiple candles. Standard indicators may miss these because the base does not span enough bars to trigger detection. However, hidden bases on higher timeframes often represent significant institutional activity compressed into a short window.
To identify hidden bases, reduce the indicator’s minimum base candle parameter to one. Then cross-reference any single-candle zones with the lower timeframe. A single H4 candle that appears as a three-candle base on the M15 chart confirms a legitimate zone. This technique surfaces levels that most automated tools overlook, providing an informational edge.
Q: Are hidden bases more or less reliable than standard multi-candle zones?
A: Hidden bases carry comparable reliability when confirmed on a lower timeframe. The key factor is departure strength, not base width. A single-candle base followed by a four-percent move is as valid as a three-candle base with the same departure. The indicator’s default settings may need adjustment to capture these formations.
Manual vs Automated Use
The choice between manual and automated zone analysis is not binary. Most experienced traders use the indicator as a scanning tool and then apply manual filters for final trade selection.
Advantages of Using the Auto Supply Demand Indicator MT4
Automation eliminates the risk of overlooking a valid zone during a busy session. It also standardises zone identification across all instruments and timeframes, ensuring that every chart receives the same analytical rigour. For traders who manage portfolios of ten or more instruments, manual zone marking on every timeframe is simply impractical. The auto indicator solves this scaling problem.
Alerts add a further layer of efficiency. Rather than cycling through charts continuously, the trader receives a notification only when price approaches a pre-identified level. This frees attention for higher-order analysis such as assessing news flow, checking correlated instruments, and evaluating broader market context.
Manual Supply and Demand Indicator Setups for Greater Control and Precision
Manual zone marking allows the trader to incorporate context that no algorithm captures. Economic event proximity, session timing, and order flow data from Level II or footprint charts can all influence whether a zone deserves attention. A demand zone that sits just above a major news event, for example, may warrant removal regardless of its technical profile.
The most effective workflow uses the auto indicator as a first pass and manual review as a second. Draw the automated zones, then delete or dim those that conflict with higher-timeframe structure, sit near high-impact events, or have been partially tested. The result is a curated set of levels that reflects both algorithmic consistency and discretionary judgment.
| Auto Supply Demand Indicator | Manual Zone Marking |
|---|---|
| Scans all timeframes and instruments instantly | Requires individual chart review per pair |
| Consistent algorithmic criteria for every zone | Criteria may vary based on trader experience |
| Fresh zone alerts notify without active monitoring | No alert capability without custom coding |
| May flag low-quality zones in choppy conditions | Trader filters context before drawing any zone |
| Scales to large watchlists effortlessly | Practical limit of 5 to 8 instruments per session |
| Cannot incorporate fundamental or order flow context | Integrates discretionary data and event timing |
Read More: How to Use MetaTrader 4 Platform
Conclusion
The Supply and Demand Indicator MT4 is a practical tool for traders who want to identify institutional price levels without spending hours on manual chart analysis. Its core value lies in speed, consistency, and the ability to surface fresh zones that the human eye might miss during a crowded session. When configured with appropriate lookback and strength thresholds, the indicator produces a reliable first layer of analysis.
Combining automated detection with manual review creates the strongest workflow. Use the indicator to scan, filter zones through higher-timeframe alignment and confluence factors like fair value gaps, and then apply discretionary judgement to arrive at a curated watchlist. This layered approach balances efficiency with precision, ensuring that every zone on the chart has earned its place.
The techniques covered here, from RBR and DBD pattern recognition to hidden base identification and FVG overlap analysis, extend the indicator well beyond its default functionality. Traders who invest time in learning these refinements will extract significantly more value from the tool than those who rely on out-of-the-box settings alone.