A technical analysis pattern can be a powerful tool for identifying future market trends. One such pattern that plays a significant role in continuation patterns, both bullish and bearish, is the Tasuki Gap Candlestick Pattern. This pattern consists of three candlesticks, which can help traders identify precise entry and exit points. Given the unique characteristics of this pattern, understanding how to recognize it and combine it with other analytical tools can help you make more accurate decisions. In the following article, we will explore the Tasuki Gap Candlestick Pattern in detail and discuss how to effectively use it in your trading strategy.
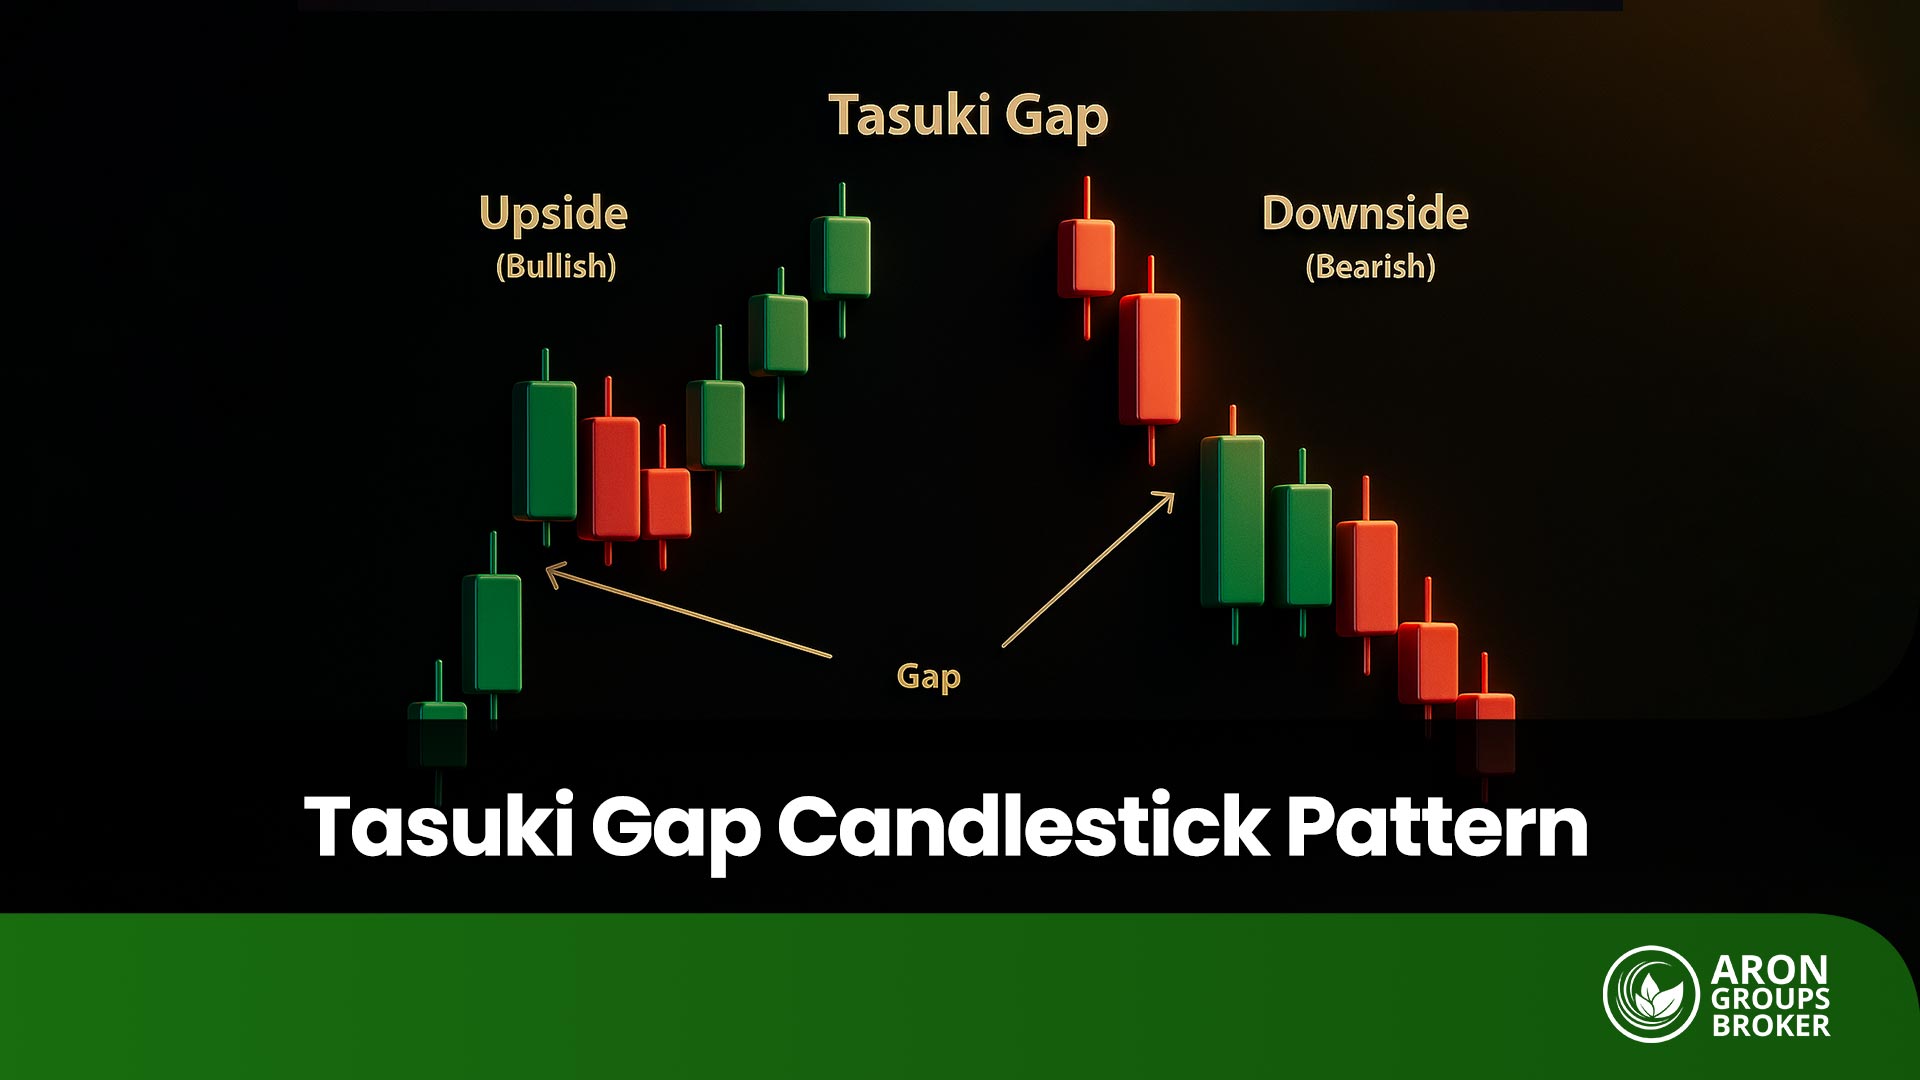
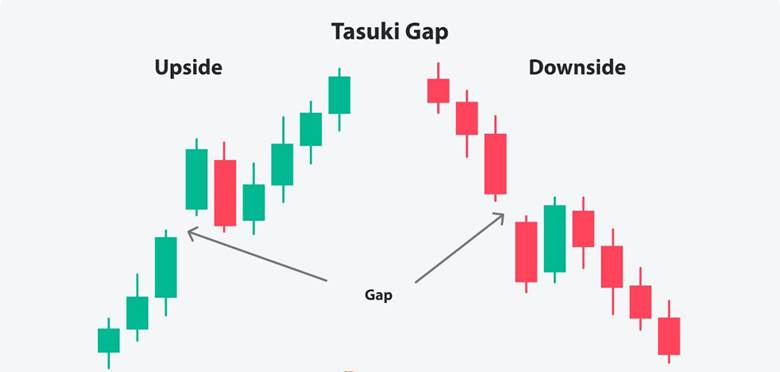
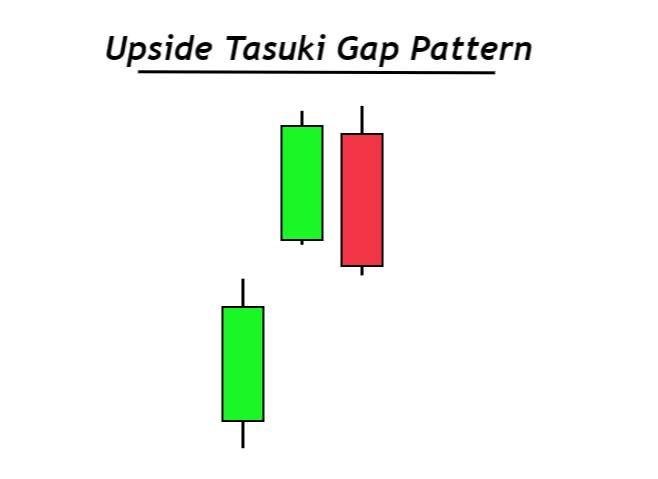
- The Tasuki Gap Candlestick Pattern is a continuation pattern in technical analysis, indicating the strength of the trend and the market's tendency to continue in the same direction.
- The reliability of this pattern is higher when it is accompanied by appropriate volume, a meaningful gap, and a semi-corrective third candlestick, rather than when the gap is fully filled.
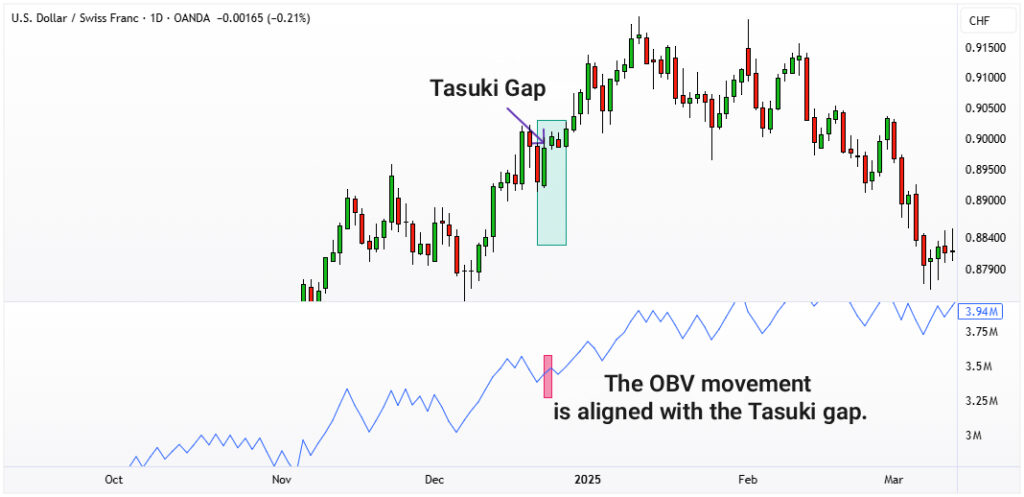
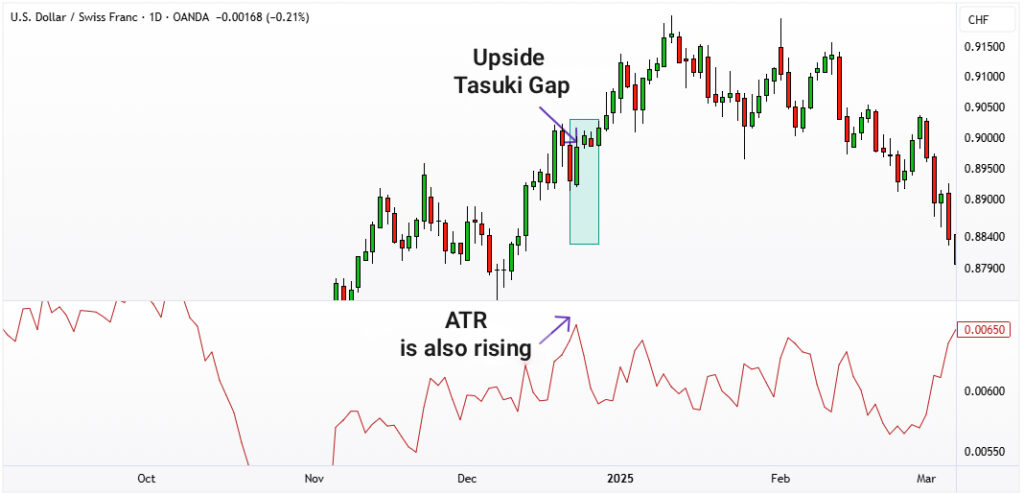
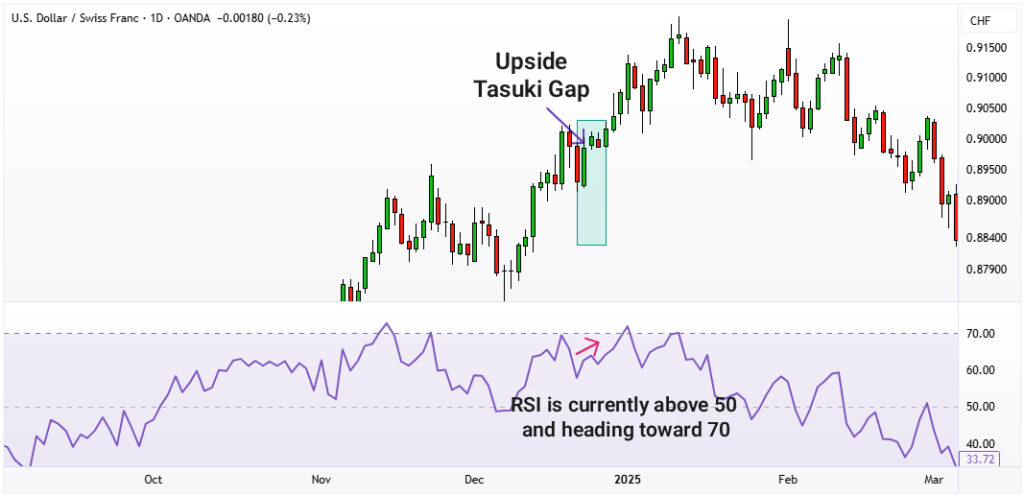
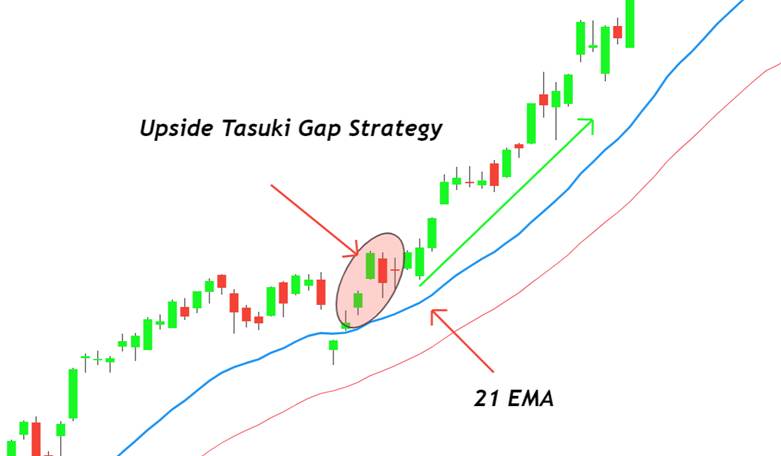
- Combining the Tasuki Gap Candlestick Pattern with indicators like RSI, ATR, OBV, and EMA can enhance the accuracy of your analysis and help avoid impulsive decisions.
- To use this pattern effectively, it’s essential to understand its position in the trend structure and practice across different time frames to differentiate real signals from false market movements.
What is the Tasuki Gap Candlestick Pattern and What Are Its Components?
The Tasuki Gap Candlestick Pattern is a three-candlestick continuation pattern characterized by a price gap in the direction of the prevailing trend, followed by a third candle that partially fills the gap but fails to close it.
- First Candle: A long candlestick that aligns with the current market trend, indicating the strength of the price movement in the direction of the trend.
- Second Candle: A candlestick similar to the first one, opening with a price gap either upwards or downwards, signaling continued buying or selling pressure.
- Third Candle: A candlestick that moves against the direction of the trend, opening within the body of the second candle and partially filling the gap, but not fully closing it.
This pattern is particularly more reliable in strong trends with high trading volume. The price gap in this pattern represents significant price changes, which can provide an opportunity to identify the continuation of the trend. By accurately identifying this pattern and combining it with other analytical tools, better trading decisions can be made.
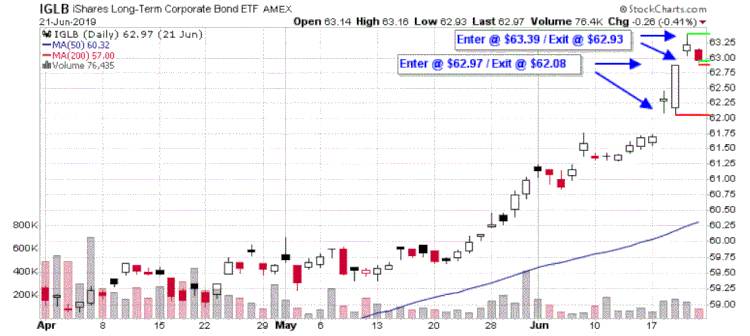
According to TradingView, the Tasuki Gap Candlestick Pattern gains higher reliability when compared with two simple moving averages (such as SMA50 and SMA200) to identify strong trends. In weak trends, this pattern is not recognized, as it is more effective in confirming the strength of a prevailing trend.
Types of the Tasuki Gap
The Tasuki Gap Candlestick Pattern appears in two variations: bullish (upside) and bearish (downside), both with similar concepts, the only difference being the direction of market movement. Accurately identifying these two forms helps traders determine whether the current trend is likely to continue or if it is more likely to reverse.
Upside Tasuki Gap
The Upside Tasuki Gap forms during an upward trend and signals the continuation of the bullish trend. Initially, a strong bullish candlestick forms, indicating that buyers are in control. The second candlestick is also bullish and opens with a gap upwards, meaning its opening price is higher than the previous candle’s close.
Then, the third candlestick appears, which is typically bearish or neutral and partially fills the gap between the first two candles but does not close it entirely. If this third candle completely fills the gap, the pattern loses its validity.
This structure suggests that buyers are still in control of the market, and the sellers’ attempt to push the price lower is unsuccessful. Traders use this pattern as a signal for the continuation of the upward trend. In such a situation, the Tasuki Gap acts as a brief pause in the upward movement and can present a good opportunity for re-entry in the direction of the trend. For those using price action, this pattern is a simple and effective tool for confirming the continuation of price movement.
Downside Tasuki Gap
Conversely, the Downside Tasuki Gap forms during a bearish trend and signals the continuation of selling pressure in the market. Initially, a strong bearish candlestick forms, indicating that sellers have control. The second candlestick is also bearish and opens with a gap down, meaning its opening price is lower than the previous candle’s close. The third candlestick is typically bullish or neutral and partially fills the gap between the first two candles.
This structure indicates that despite buyers’ attempts to push the price higher, the selling pressure remains stronger, and the likelihood of the downtrend continuing is high. Traders typically use this pattern to identify short-selling opportunities in the direction of the trend.
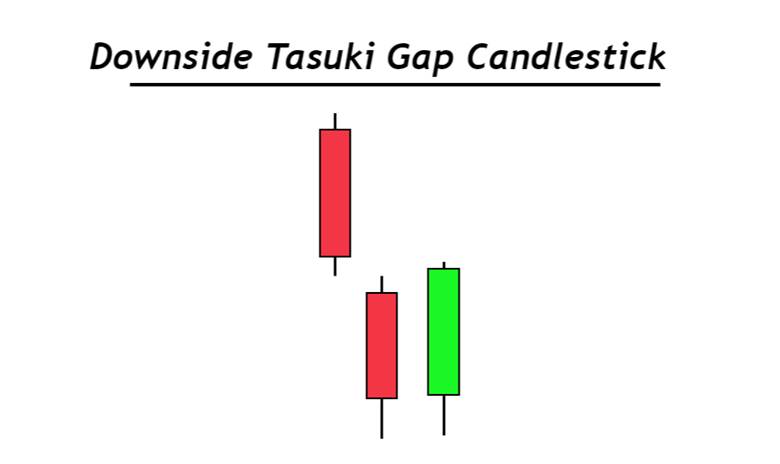
According to Stockgro, the Downside Tasuki Gap is suitable for short-term trading on hourly charts, but it provides more reliable signals on daily or weekly charts.
Key Criteria for Validating the Tasuki Gap Pattern
To use the Tasuki Gap Candlestick Pattern as a reliable tool in trading, several key factors must be considered. These factors help traders determine whether the pattern genuinely indicates a trend continuation or is merely a temporary price movement. Evaluating the gap size, trading volume, the position of the pattern in the trend, and the timeframes in which it forms are crucial for confirming the pattern’s validity. In this section, we’ll break down these factors in simple terms to help you use the Tasuki Pattern effectively in your trading decisions.
Gap Size and Its Relation to Candlestick Bodies
The size of the gap plays a significant role in the Tasuki Gap Candlestick Pattern. If the gap between the candles is too small, it doesn’t have a strong impact on the trend and cannot be considered a powerful signal. On the other hand, if the gap is too large, the market might quickly react and fill the gap, thus reducing the pattern’s credibility.
The ideal situation occurs when the gap is proportionate to the candlestick bodies, indicating a genuine and reliable price movement. Additionally, the type of gap should be considered as continuation gaps (Runaway Gaps) are generally stronger than common or breakaway gaps and show a much higher probability of trend continuation. When these gaps appear within the Tasuki Pattern, the chances of the trend continuing are significantly higher, which is exactly what traders look for in price action analysis.
The Role of Trading Volume in Confirming the Tasuki Pattern
Trading volume indicates how many traders are entering the market in the direction of the pattern and how much support there is for the price movement. In an upside Tasuki Gap, if the volume in the first and second candles is high, it means buyers are in control, and their actions are authentic. However, if the volume increases unexpectedly in the third candle, the chances of price reversal rise, and the signal weakens.
In contrast, if the third candle forms with low volume, it suggests that the buying or selling pressure remains strong, making the pattern more reliable. Thus, evaluating the volume along with the candlestick structure is one of the simplest ways to assess the quality of the signal in the Tasuki Gap Candlestick Pattern.
Trading volume plays a crucial role during the formation of the Tasuki Gap pattern.If the volume is high on the first and second candles, it indicates confirmation of the trend’s strength and increases the reliability of the pattern.
The Position of the Tasuki Gap Pattern in the Trend Structure
The Tasuki Pattern is more reliable when it forms in a clearly defined trend. If the market is neutral or lacking a clear direction, the likelihood of errors is high. In an uptrend, this pattern typically appears in the middle of the move, confirming that buyers still have enough power to continue. In a downtrend, the pattern confirms continued selling pressure and further downward movement.
It is advisable not to observe this pattern too close to major support or resistance levels, as these areas typically cause unexpected price reactions. If the pattern appears in the middle of the trend and at a reasonable distance from these levels, its signal is more trustworthy. This is especially important for those who focus on candlestick patterns.
Best Timeframes for Validating the Tasuki Gap Pattern
The timeframe plays a crucial role in the accuracy of the analysis. In higher timeframes like daily or four-hour charts, price noise is less frequent, and the pattern is more likely to work effectively. However, in very short timeframes, such as 5-minute or 15-minute charts, sudden market movements and volatility can lead to false signals.
To increase confidence, using multiple timeframes simultaneously can be helpful. For example, if you spot a Tasuki Gap Pattern on the daily chart, you can check it on a lower timeframe to ensure that the candlestick structure aligns with the overall trend.
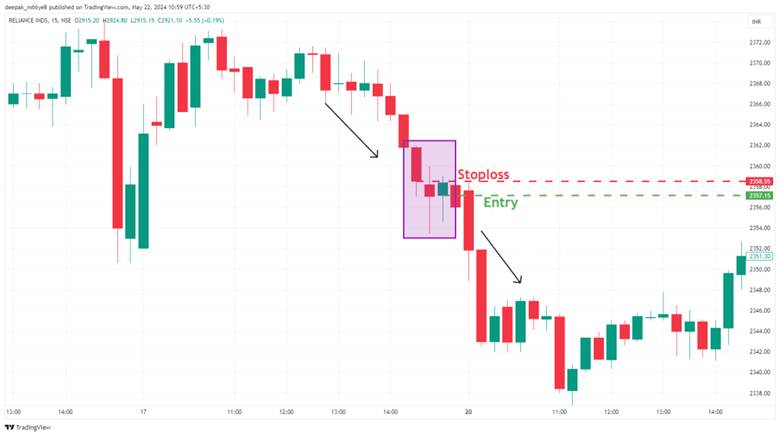
The Tasuki Gap pattern is more reliable in markets with strong trends and on higher timeframes (such as daily or weekly charts). Small gaps or low-volume markets may generate false signals.
How to Trade with the Tasuki Gap
Trading with the Tasuki Gap Candlestick Pattern is simple but requires attention to detail. This pattern typically forms when the market is moving in a clear trend, and once it forms, the expectation is that the trend will continue in the same direction. Professional traders recommend always waiting for the fourth candlestick to close to ensure the market genuinely intends to continue the movement.
If the fourth candlestick closes in the direction of the gap, the pattern is confirmed, and you can enter the trade. In this method, risk management is crucial, and the best approach is using a risk-to-reward ratio of 1:2. This means for every unit of risk, expect two units of reward. This approach helps you maintain positive returns even if a few trades do not go as planned. The difference between this method and a reversal pattern is that in the Tasuki Gap, the goal is to follow the trend, not to reverse it.
How to Identify Entry and Exit Points with the Tasuki Gap
For the Tasuki Gap Pattern, the entry point is usually determined after the third candlestick confirms the pattern. If the pattern is bullish, the entry point is slightly above the high of the third candlestick, and if it is bearish, it is slightly below the low of the third candlestick. With this method, you only enter the trade when the price genuinely moves in the desired direction.
For exits, it is recommended to use tools like Fibonacci levels to identify logical areas for profit-taking. This helps you make your trades more focused and organized.
How to Set Stop Loss and Take Profit with the Tasuki Gap
One of the most important aspects of trading with this pattern is determining your stop loss and take profit levels. The stop loss is typically placed just below the gap (in an uptrend) or above it (in a downtrend). If the price moves past this level, the pattern is invalidated.
For setting the take profit, you can calculate the gap between the candlesticks and use it as a price target, multiplying it by 1.5 to estimate the potential profit. This simple method helps you establish a good balance between risk and reward. The role of the Tasuki Gap Candlestick is key in this process, as it marks the point where the new move begins, and based on this, you can plan safe entry and exit levels.
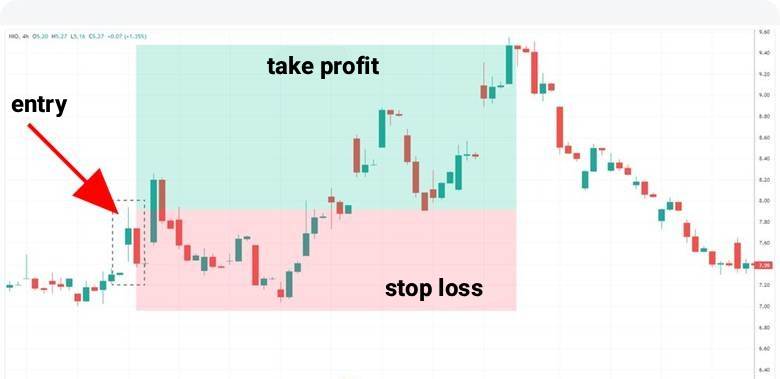
Managing risk using a 1:2 risk-to-reward ratio in trades based on the Tasuki Gap pattern can help ensure an overall positive return, even if a few trades end up unsuccessful.
Combining the Tasuki Gap with Indicators
When looking only at the candlestick structure, sometimes you might get false signals. To increase confidence in the signals, it is better to combine the Tasuki Gap Candlestick Pattern with technical indicators. This helps confirm the trend continuation and reduces the likelihood of failure. In this section, we will review four common indicators that can be combined with the pattern.
Combining the Tasuki Gap with the OBV Indicator
The OBV (On-Balance Volume) indicator measures the cumulative volume of money flowing in and out of the market. It shows how much new money has entered or exited the market. If the Tasuki Gap pattern forms and the OBV also moves in the same direction as the gap (for example, in an upside gap, the OBV moves upward), this alignment indicates confirmation of the trend’s strength.
However, if the OBV moves in the opposite direction of the gap, the likelihood of the pattern failing increases. This combination helps to determine whether the price movement is real or just a temporary fluctuation.
Combining the Tasuki Gap with the ATR Indicator
The ATR (Average True Range) indicator measures price volatility over recent periods. If the ATR is increasing before the formation of the pattern, it means the market is becoming more volatile, and the movement is likely to continue. The ATR can also be used to set the stop loss. For example, a portion of the ATR can be used as a safe distance for the stop loss, helping to avoid being stopped out due to natural market fluctuations.
Combining the Tasuki Gap with the RSI Indicator
The RSI (Relative Strength Index) shows the strength of price movement and identifies overbought or oversold conditions. If the RSI is near the overbought or oversold areas, the likelihood of a reversal increases.
However, if the RSI moves in the direction of the trend (for example, in an uptrend, the RSI stays above 50), it confirms the trend. In other words, when the Tasuki Gap pattern forms and the RSI is between 50 and 70 (not too overbought), it gives a stronger confirmation in line with the trend.
Combining the Tasuki Gap with the EMA Indicator
The EMA (Exponential Moving Average) is a useful tool for detecting the overall direction of the trend and dynamic support or resistance levels. If a bullish Tasuki Gap forms directly above the EMA, it is a strong sign of trend confirmation. In a downtrend, if the pattern forms below the EMA, it further confirms the bearish trend.
Additionally, the crossovers of the EMAs (for example, when a short-term EMA crosses above a long-term EMA) can serve as a complementary signal for a more confident entry.
Difference Between the Tasuki Gap and the Inside Bar Pattern
At first glance, the Tasuki Gap pattern and the Inside Bar pattern might seem similar, but in reality, their structure and meaning are quite different. In the Inside Bar pattern, there is no price gap between the candlesticks, and the second candlestick is entirely within the range of the first candlestick. This typically signals indecision and a temporary pause in the market, and depending on where it forms, it can be either a reversal or continuation pattern.
In contrast, the Tasuki Gap requires a gap, which indicates the strength of the current trend. While the Inside Bar signifies market hesitation, the Tasuki Gap is a signal of the continuation of the primary trend and the dominance of the prevailing market flow.
Difference Between the Tasuki Gap and the Harami Pattern
The Harami pattern is a well-known two-candle pattern that usually serves as a reversal signal and is often found at the end of trends. In a Harami, the second candlestick is smaller and fully contained within the body of the first candlestick, indicating weakness in the previous trend.
However, in the Tasuki Gap, the second candlestick opens with a price gap, and this gap confirms the continuation of the trend. While the Harami signals the end of a trend, the Tasuki Gap indicates its continuation. Particularly in the Upside Tasuki Gap, this difference is clearly seen, as the upward gap signals the strength of buyers, not their weakness.
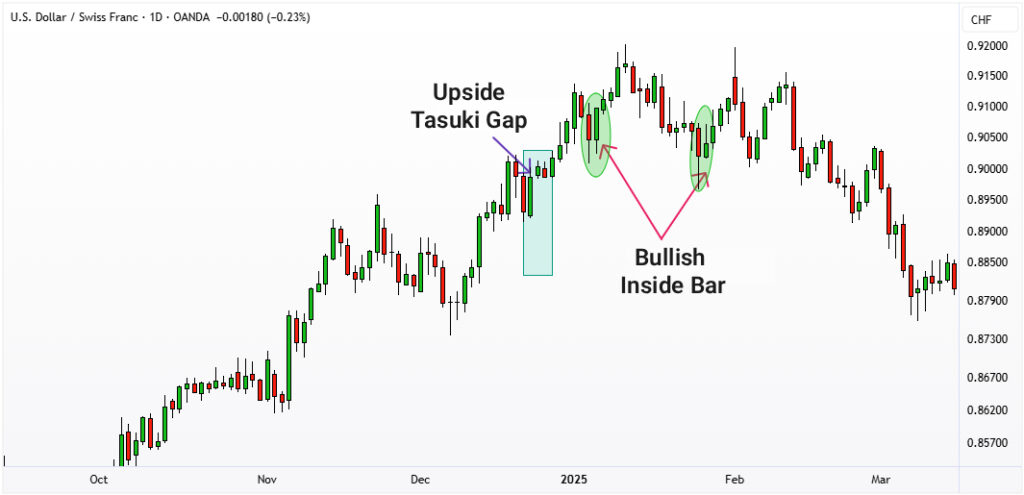
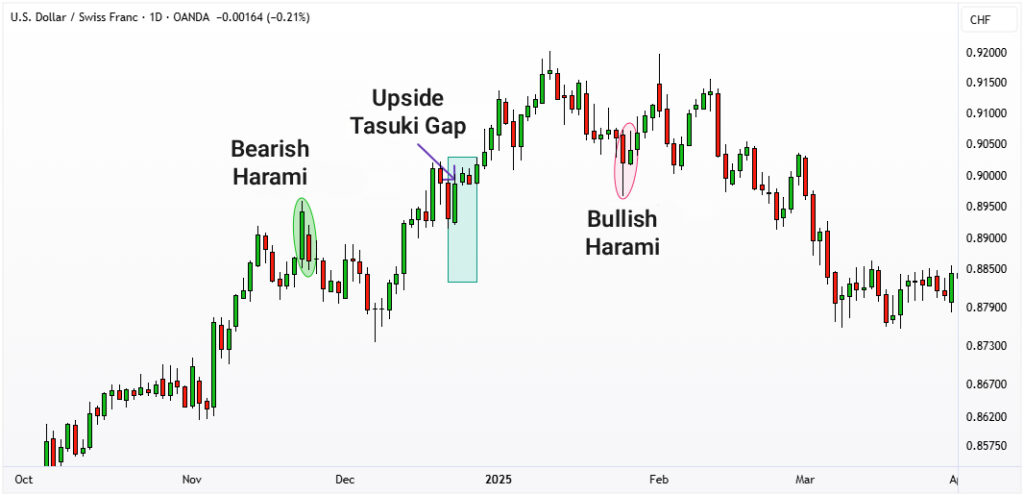
In the FXOpen article, it is stated: "The Tasuki Gap pattern can be mistaken for other patterns like Harami and Engulfing. While the Harami typically forms at key reversal points and signals a market direction change, the Tasuki Gap forms in strong trends and indicates the continuation of the movement."
Difference Between the Tasuki Gap and Other Continuation Gaps
Continuation gaps such as Runaway Gaps or Measuring Gaps are all signs of trend continuation, but they differ in structure from the Tasuki Gap pattern. In typical continuation gaps, after the price gap is created, the next candlestick usually doesn’t enter the gap, and the price continues its movement with minimal retracement.
However, in the Tasuki Gap, the third candlestick touches or “tests” part of the gap without fully closing it. This unique characteristic makes the Tasuki Gap a type of short-term correction within the trend, after which the primary movement continues with greater confidence. In fact, this distinct feature sets the Tasuki Gap apart from other gap patterns.
Disadvantages and Limitations of the Tasuki Gap
Although the Tasuki Gap Candlestick Pattern can be a useful tool for identifying trend continuation, like any other technical pattern, it has its own limitations. One of its major weaknesses is that in highly volatile markets, the price gap may be filled quickly, causing the initial signal to lose its validity. In such cases, even if the pattern appears correctly, the actual market movement may occur in the opposite direction.
In markets with low trading volume, gaps are often created due to a lack of liquidity or random movements, rather than a genuine shift in market sentiment. This can lead to false signals.
Another limitation of the Tasuki Gap pattern is that, on its own, it doesn’t have enough predictive power and should be used in conjunction with supplementary tools like volume analysis or indicators such as RSI and EMA to gain more credibility. This pattern generally only indicates the likelihood of trend continuation, not a definitive signal.
In weak or neutral trends, its performance declines, and sometimes the third candlestick fully fills the gap instead of maintaining it, causing the pattern to become invalid. Therefore, for effective use of the Tasuki Gap, market conditions, trading volume, and volatility must always be considered to avoid trading errors.
Conclusion
Ultimately, a proper understanding of the Tasuki Gap Candlestick Pattern helps traders identify the true behavior of the market and make more informed decisions regarding trend continuation. This pattern holds the most credibility when it is analyzed alongside appropriate volume and in larger timeframes, as this reduces the likelihood of false signals. Simultaneously using indicators like RSI, ATR, or EMA can serve as confirmation of trend strength and enhance the quality of your analysis. It is recommended to practice this pattern in a demo environment and test it under various market conditions before applying it to live trades, so you can gain practical insight and greater confidence in its effectiveness.