When it comes to technical analysis, one pattern that has gained popularity among professional traders is the Cypher Pattern. This pattern belongs to the harmonic patterns category and uses Fibonacci ratios. It helps identify potential price reversal points. Simply put, the Cypher Pattern acts like a map, helping traders locate critical market areas. These are the zones where price reversals are more likely to happen. Understanding this pattern can help make more accurate trading decisions. It also offers a fresh approach to risk management. If you want to learn how this pattern works, stay with us until the end of the article.
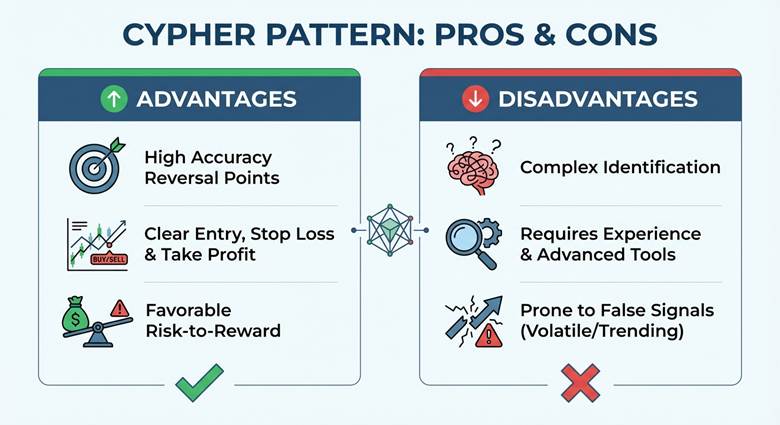
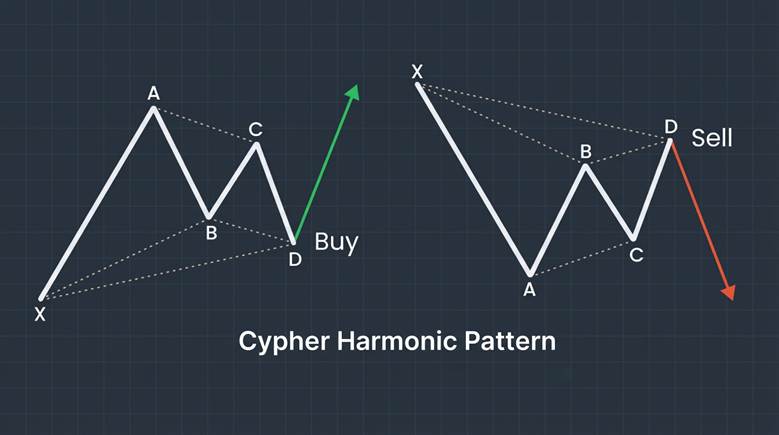
- The Cypher Pattern, using precise Fibonacci ratios, is a highly accurate and advanced tool for identifying reversal points.
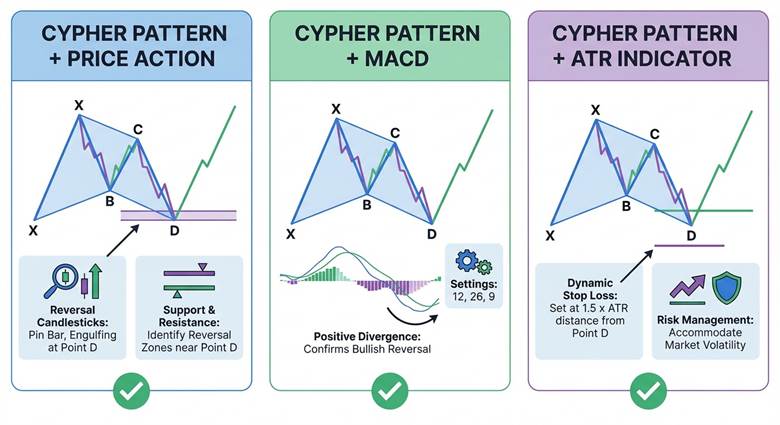
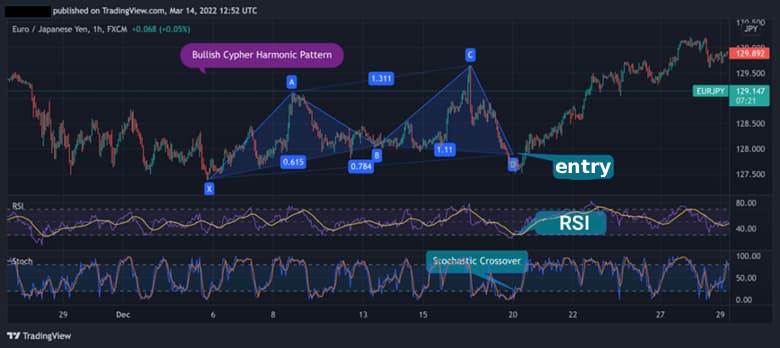
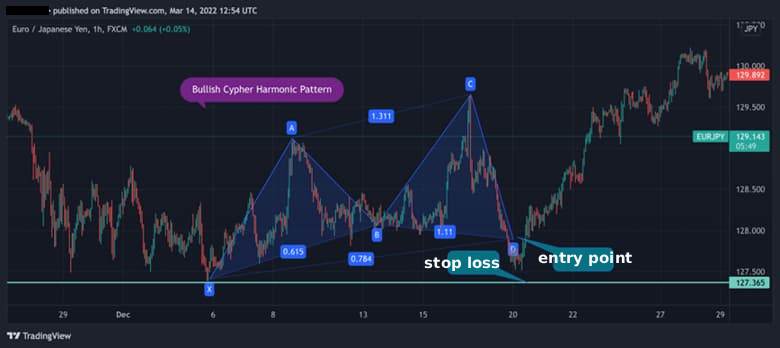
- Correctly identifying point D in the Cypher Pattern and confirming it with candles and indicators provides more accurate entry points and better risk management.
- The Cypher Pattern can be combined with other analytical tools like Price Action, MACD, and ATR to improve trade accuracy and reduce false signals.
- Mastering the Cypher Pattern requires consistent practice and experience in accurately identifying the pattern on charts, beyond theoretical knowledge.
What is the Cypher Pattern in Technical Analysis?
The Cypher Pattern is widely used among professional traders. It was introduced by Darren Oglesbee as part of harmonic patterns. The pattern consists of five points: X, A, B, C, and D. It uses specific Fibonacci ratios to identify potential price reversal points. Unlike classical patterns like triangles or head and shoulders, the Cypher Pattern is based on more precise calculations. This makes it a more reliable tool for technical analysts.
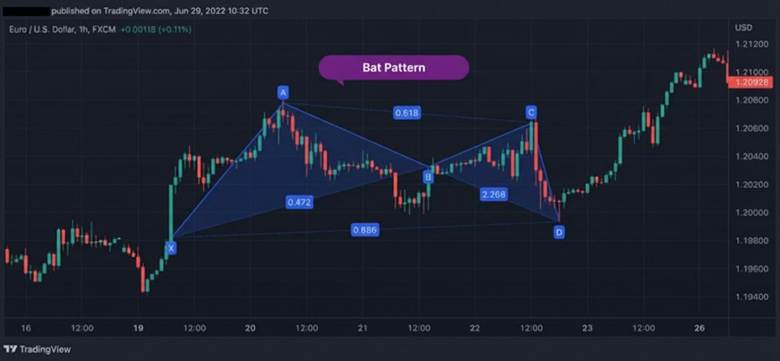
The M and W shapes of the Cypher Pattern on lower timeframes (like M15) can generate more signals. However, they require strong filters to reduce noise and improve accuracy.
Structure and Components of the Cypher Pattern
The Cypher Pattern consists of five key points (X, A, B, C, D) and four price waves (XA, AB, BC, CD). This pattern appears in two types: bullish (M shape) and bearish (W shape). The bullish pattern signals a reversal towards an uptrend, while the bearish pattern indicates a reversal towards a downtrend.
To better understand it, you can compare the Cypher Pattern to the Bump and Run Pattern, which has a similar structure but follows different Fibonacci ratios.
- Bullish Cypher Pattern (M Shape): Signals a reversal to the upside.
- Bearish Cypher Pattern (W Shape): Signals a reversal to the downside.
Both patterns use Fibonacci ratios, making the harmonic Cypher Pattern a precise tool for market analysis.
Key Fibonacci Ratios in the Cypher Pattern Structure
In the Cypher Pattern, Fibonacci ratios play a crucial role. Point B typically retraces between 38.2% and 61.8% of the XA wave. Point C, as an extension, is usually found in the range of 127% to 141.4%. Point D often forms at the 78.6% retracement level of the XC wave.
These ratios determine the validity of the pattern, allowing traders to identify high and low-risk areas in the market. Additionally, candlestick patterns, such as the Spinning Top, can provide further confirmation.
- Point B: Retraces 38.2% to 61.8% of XA.
- Point C: Lies between 127% and 141.4% extension.
- Point D: Forms at the 78.6% retracement of XC.
Position and Characteristics of Each Point in the Cypher Pattern (X, A, B, C, D)
Each point in the Cypher Pattern has a specific role. Point X marks the beginning of the movement, and Point A represents the first peak or trough. Point B shows the initial retracement, Point C marks the continuation and extension, and Point D is where the highest probability of reversal occurs.
Typically, Point D is considered the entry zone. By analyzing candlestick shapes, traders can assess the reliability of this entry. Patterns like the Graveyard Doji often signal a higher probability of reversal.
- Point X: Start of the movement.
- Point A: First peak or trough.
- Point B: Initial retracement.
- Point C: Continuation and extension.
- Point D: Highest probability of reversal.
Validation Rules for the Cypher Pattern on the Chart
For the Cypher Pattern to be valid, adherence to Fibonacci ratios is essential. Point B must be between 38.2% and 61.8% of XA. Point C should fall between 127% and 141.4%, and Point D must form on the 78.6% level of the XC wave.
If any of these conditions are not met, the pattern will have less validity. Using automated analytical tools to identify this structure is very helpful, but professional traders often rely on indicators like the Fisher Indicator for added confirmation.
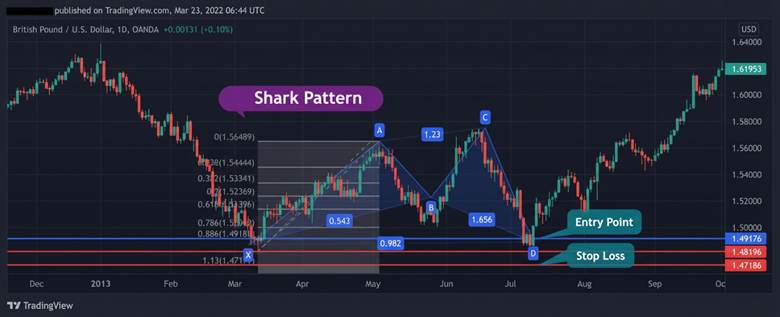
Using the Cypher Pattern in high liquidity markets, such as major currency pairs, increases the likelihood of successful trades.
How to Trade with the Cypher Pattern
To trade using the Cypher Pattern, first, identify the pattern on the chart. Once Point D is complete, enter the trade. For additional confirmation, use candlestick patterns like the Pin Bar or Engulfing to increase the likelihood of a price reversal.
Additionally, using indicators such as RSI or MACD can provide extra signals for entering the trade. Choosing the right timeframe is crucial; typically, H1 or H4 timeframes are suitable for these types of trades. With this approach, you can make more accurate trading decisions.
Best Entry Strategy for the Cypher Pattern at Point D
For entering a trade at Point D of the Cypher Pattern, wait for the pattern to complete at the 78.6% retracement of XC. Confirmation with reversal candlesticks like a Pin Bar or Engulfing is essential. For example, on a currency pair in the H4 timeframe, if a bullish Engulfing candlestick appears at Point D, you can enter a buy trade.
Timeframes like H1 and H4 are ideal due to the balance they offer between accuracy and speed. Trusted sources like howtotrade emphasize that combining the Cypher Pattern with indicators such as RSI can increase the likelihood of success. This method allows for more confident trade entries.
Exact Stop Loss Placement in the Cypher Pattern
To manage risk in Cypher Pattern trades, place your stop loss at a point where, if the price breaks, the pattern loses its validity. In the bullish pattern, the stop loss is typically just below Point X. In the bearish pattern, the stop loss is placed just above Point X. This method helps limit your loss if the price moves unfavorably and protects your capital.
Methods for Setting Price Targets Based on Fibonacci and Cypher Pattern Structure
To set price targets in Cypher Pattern trades, you can use Fibonacci levels. The first price target typically lies at the 38.2% retracement of the CD wave. The second target is usually at the 61.8% retracement of the CD wave. You can also use Points A and C as price targets. These methods help you set reasonable and logical price targets for your trades and increase your chances of making a profitable trade.
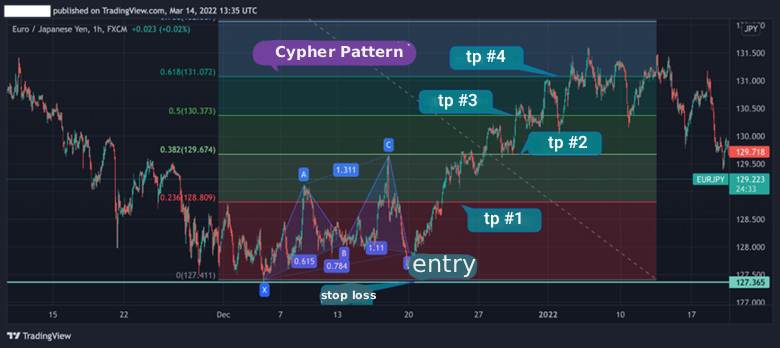
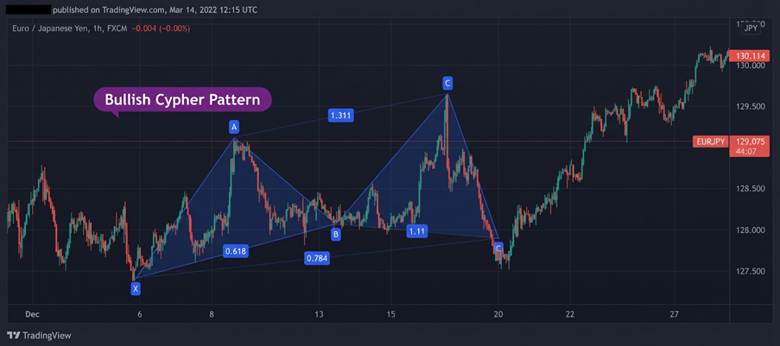
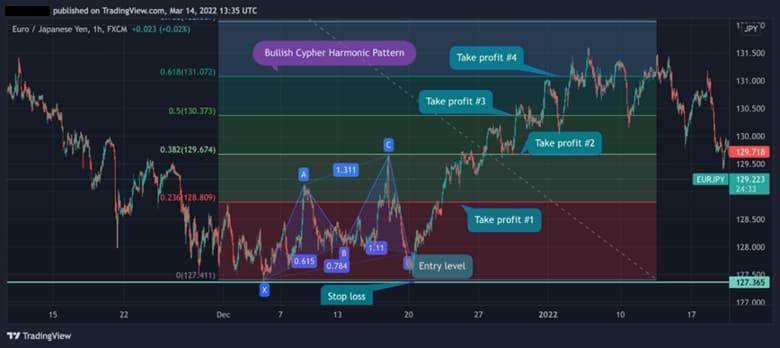
Using Fibonacci extensions of the BC wave can provide alternative and more precise price targets for exiting a trade. This method enhances trade management and helps capture potential gains more effectively.
Advantages and Disadvantages of Using the Cypher Pattern
The Cypher Pattern, as one of the advanced harmonic patterns, identifies price reversal points using precise Fibonacci ratios. This pattern is applicable in various markets such as Forex, stocks, and cryptocurrencies, performing especially well in ranging markets.
Advantages:
- High accuracy in identifying price reversal points.
- Clear entry, stop loss, and take profit levels.
- Favorable risk-to-reward ratio.
Disadvantages:
- Complexity in identification.
- Requires experience and advanced analytical tools.
- Prone to errors in volatile markets.
- May produce false signals in trending markets, requiring combination with other analytical tools.
Difference Between the Cypher Pattern and the Gartley and Bat Patterns
The Cypher Pattern uses specific Fibonacci ratios to identify price reversal points. Point C in the Cypher Pattern lies between 127.2% and 141.4% of the XA wave. In the Gartley Pattern, Point C typically sits at the 78.6% retracement of the XA wave. The Bat Pattern places Point C between 38.2% and 88.6% of the AB wave. These differences in Fibonacci ratios make the Cypher Pattern appear less often, requiring greater precision to identify.
Difference Between the Cypher Pattern and the Shark Pattern
Both the Cypher and Shark Patterns are advanced harmonic patterns that use Fibonacci ratios to identify price reversal points. However, there are notable differences in their structures and Fibonacci ratios.
Cypher Pattern:
- Point C lies between 127.2% and 141.4% extension of the XA wave.
- Point D forms at the 78.6% retracement of the XC wave.
Shark Pattern:
- Point C falls between 113% and 161.8% extension of the XA wave.
- Point D forms at the 88.6% to 113% retracement of the OX wave.
These differences make the Cypher Pattern appear less frequently on charts compared to the Shark Pattern. The Shark Pattern has a more distinct structure due to its different Fibonacci ratios.
Combining the Cypher Pattern with Price Action
To confirm the validity of the Cypher Pattern, you can use reversal candlestick patterns like the Pin Bar or Engulfing at Point D. These patterns signal a potential trend change. Additionally, analyzing support and resistance levels near Point D can help identify reversal zones. For example, on TradingView charts, observing the Cypher Pattern alongside reversal candlestick patterns and key levels can provide stronger trade entry signals.
Combining the Cypher Pattern with MACD
Using the MACD indicator can help confirm Cypher Pattern signals. For instance, in a bullish Cypher Pattern, observing positive divergence in MACD near Point D can indicate a higher probability of price reversal. The recommended MACD settings are: 12 for the short-term EMA, 26 for the long-term EMA, and 9 for the signal line. Combining these settings with the Cypher Pattern can increase the accuracy of trading signals.
Combining the Cypher Pattern with ATR Indicator
The ATR (Average True Range) indicator is useful for setting dynamic stop losses and managing risk in Cypher Pattern trades. For example, you can place your stop loss a set distance from Point D, such as 1.5 times the ATR, to accommodate market volatility. This method helps protect against significant losses in case of sudden market changes.
Conclusion
The Cypher Pattern is a powerful tool in technical analysis that helps traders accurately identify price reversal points. Mastering this pattern requires consistent practice and experience in recognizing it on charts. To improve the accuracy and reliability of the pattern’s signals, combining it with other analytical tools like Price Action, MACD, and ATR can be highly effective. Remember, success in trading depends on mastering techniques and continuously improving analytical skills. Practice and further learning are key to successfully using the Cypher Pattern.