


Trend Reversal in Price Action Trading is one of the key skills for any trader. Financial markets are constantly moving, and at any moment, the trend of an asset can change. If you can identify these changes in time, you can take advantage of opportunities to enter the market. In this article, we will show you how to recognize trend reversals using simple and effective analysis methods, and how to use tools such as candlestick patterns and trading volume to confirm them. If you’re looking to improve your skills in price action trading and want to learn how to enter the market at critical times, don’t miss the rest of the article.

- Recognizing a trend reversal in price action requires multiple confirmations, and you should not rely on a single signal alone.
- Patience in entering the market is crucial, and it’s better to wait for further confirmations of the trend reversal.
- Trading volume should be considered alongside price movement, as high volume can indicate a genuine trend reversal.
- Risk management should always be a priority, even when a trend reversal is accurately identified.
What is Trend Reversal in Price Action and Why is it Important?
A trend reversal in price action refers to a complete change in the direction of the market. This shift can occur from an uptrend to a downtrend or vice versa, and typically happens when the market can no longer continue in its previous direction. At this point, the market enters a new phase, creating an opportunity for traders to enter a new trend. This change in the market can be identified by analyzing the market structure, which is derived from the price levels and patterns in the market.
However, trend reversal in price action is different from a pullback. In a pullback, the market temporarily changes direction and then returns to the previous trend. In contrast, a trend reversal marks a permanent change in the market’s direction. Recognizing these changes in the financial markets is crucial, as it allows traders to enter new trends and exit losing positions.
Price action helps traders identify these changes without the need for complex indicators. In fact, by observing the price movements and patterns, trend reversals can be easily spotted. A trend reversal often indicates the entry of new market participants and a shift in market psychology, which significantly influences price movements.

Effectively identifying a trend reversal requires analyzing market sentiment. While charts and technical patterns are important, market sentiment and psychology can sometimes shape trends even before technical changes occur.
Early Signs of Trend Reversal in Price Action
Identifying a trend reversal in price action before it occurs can provide traders with a golden opportunity. These early signs are often referred to as early warnings that alert traders to the potential for a trend reversal. These signs include the breakout of support and resistance levels, divergence between price and indicators, changes in trading volume, and the analysis of the strength of buyers and sellers.
Divergence Between Price and Indicators as a Warning Signal
One of the most important early signs of a trend reversal is divergence between price and indicators. For example, when the price is forming a higher high but an indicator like the RSI is making a lower high, this divergence indicates weakness in momentum and acts as a warning signal for a potential trend reversal.
This situation often shows that price movement is continuing without sufficient momentum support. Investopedia explains this concept thoroughly, stating that divergence acts as an early warning for a potential trend change.
Clear Breakout of Key Support and Resistance Levels
Another crucial sign of a trend reversal is the clear breakout of key support and resistance levels. If the price clearly breaks a support or resistance level and this breakout is accompanied by increased trading volume, a trend reversal is likely.
In this case, strong and large candles typically signal that a new trend is beginning. These signs are often clearly visible on charts like those on TradingView, and to confirm a trend reversal, trading volume should also increase.
Significant Changes in Trading Volume and Candlestick Patterns
Changes in trading volume can also indicate a trend reversal. If trading volume increases unusually, especially when this volume increase is in the opposite direction of the previous trend, the market is likely moving towards a new trend. Additionally, candlestick patterns such as doji or hammer can confirm a trend reversal. These patterns typically form at key price points and are strong indicators of a market reversal towards a new direction.
Analyzing the Strength of Buyers and Sellers
Another way to identify a trend reversal is by analyzing the strength of buyers and sellers in the market. If, during a downtrend, the selling volume starts to decrease while buying pressure begins to increase, it could be a sign of a trend reversal. Analyzing order flow and momentum can help you determine whether the market is heading towards a trend reversal or not.
According to Babypips, "One of the early signs that traders often overlook is a change in market momentum. When a trend is ending, the price movement typically slows down compared to before, and this decrease in momentum can be the first warning of a trend reversal."
Classic Price Action Patterns for Identifying Trend Reversal in Price Action
Classic patterns in price action are essential tools for identifying trend reversal in price action. These patterns help you determine when the current market trend may be coming to an end and a new trend is about to begin. Here, we will review several classic patterns that are useful for spotting a trend reversal in price action.
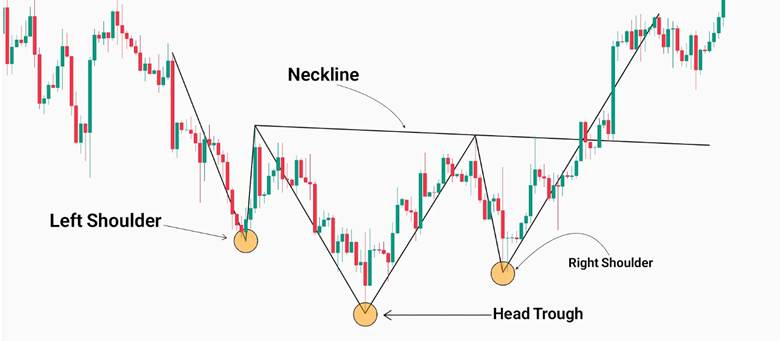
Head and Shoulders Pattern (Top and Bottom)
The Head and Shoulders pattern is one of the most well-known trend reversal patterns. The pattern consists of three parts: the left shoulder, the head, and the right shoulder. Initially, the price moves upwards and reaches the highest point (the head). Then the price slightly declines and rises again, but it cannot reach the previous height (the right shoulder). When the price breaks the neckline, it’s a strong signal of a trend reversal in price action from bullish to bearish. This pattern is one of the best ways to identify a trend reversal.
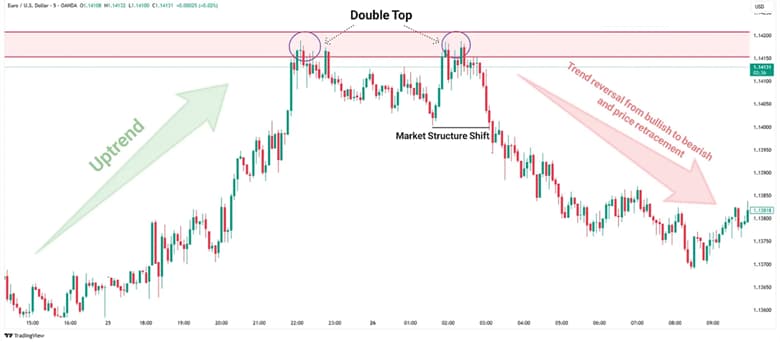
Double Top and Double Bottom Patterns
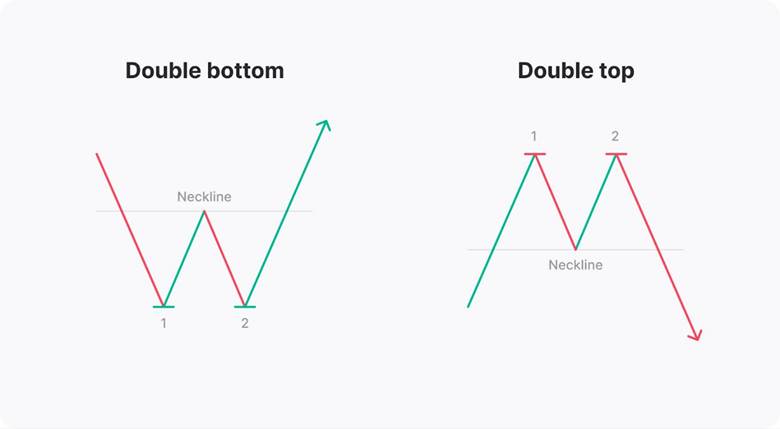
The Double Top and Double Bottom patterns usually form at the end of a prolonged trend. These patterns appear as two peaks (double top) or two troughs (double bottom), resembling the letters M or W.
When Double Top and Double Bottom patterns form, they typically signal a trend reversal in price action from bullish to bearish or vice versa. To confirm this change, a breakout of the resistance or support level must occur. These patterns are another strong signal for identifying a trend reversal in price action.
Triple Top and Triple Bottom Patterns
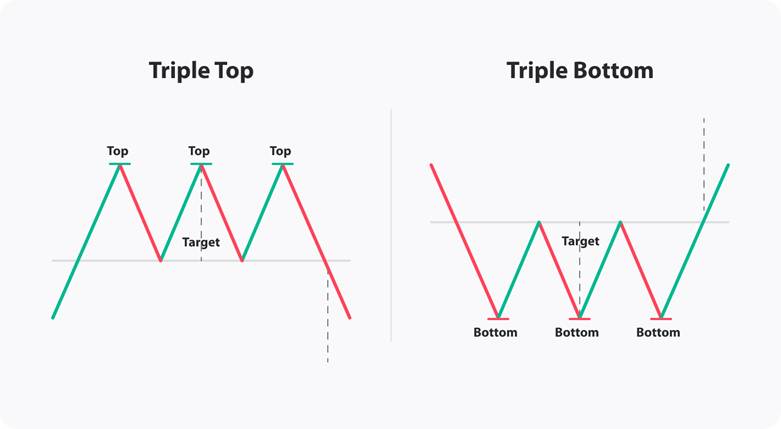
The Triple Top and Triple Bottom patterns are similar to the double patterns but are stronger. These patterns form when the market is exhausted, and the previous trend no longer has enough momentum. In these patterns, the price touches a specific level three times but fails to break through it. When this level is broken, it indicates a significant trend reversal in price action. This pattern is particularly useful in markets with long and tiring trends.
Key Reversal Candlesticks
One of the most powerful tools for identifying a trend reversal in price action is the use of key reversal candlestick patterns. Candlestick patterns such as the hammer, engulfing, and others can be strong indicators of trend reversals. For example, the hammer pattern at the end of a downtrend may indicate a trend reversal in price action towards an uptrend. These candlesticks become more reliable when combined with support and resistance levels.
Practical Strategies for Entering Trend Reversal Points with Price Action
To enter the market at trend reversal points in price action, traders must use strategies that help them enter the market at the right time. These strategies typically involve using tools such as trendlines, channels, and moving averages (MA) alongside a thorough analysis of price action patterns. In this section, we’ll explain some key strategies for entering the market and managing risk.
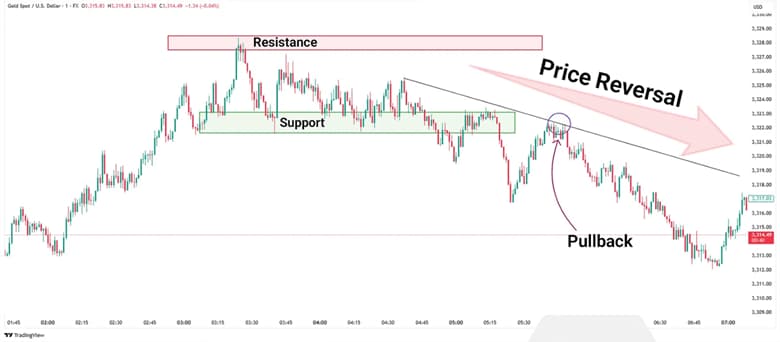
Using Trendlines and Channels to Confirm Trend Reversal
When the market enters a new trend, using trendlines and channels can help confirm the trend reversal in price action. If the price breaks a trendline and moves towards the new trend, this can be a sign of a trend reversal. Additionally, parallel channels help you find optimal entry and exit points. If the price breaks out of the top of the channel, it could be an ideal opportunity to enter the new trend.
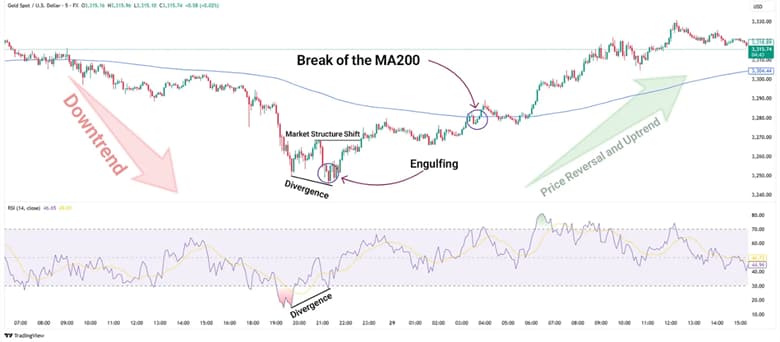
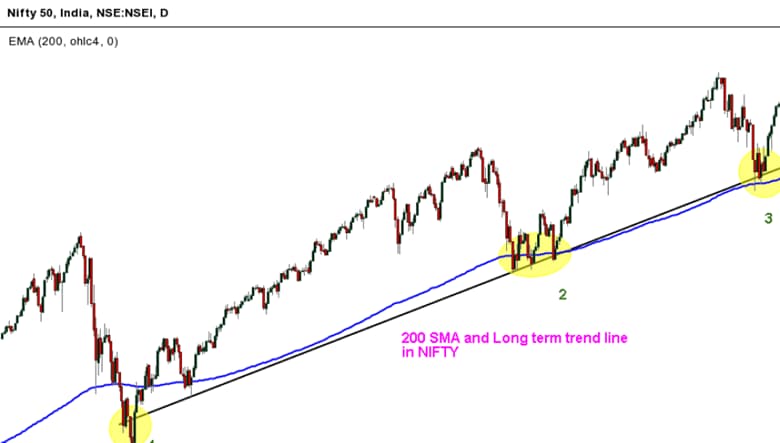
Combining Price Action with Moving Averages (MA)
Another effective method for entering the market is combining price action with moving averages (MA). For example, when a moving average crossover (a short-term MA crossing above a long-term MA) coincides with a price action pattern, this can signal an entry point into the market. The best time to enter is typically when the price pulls back towards the moving average level. This combination can provide more accurate entry points.
Risk Management and Setting Stop-Loss and Target Points in Trend Reversal
Risk management is one of the most important parts of any trading strategy. When entering a trend reversal in price action, you must carefully set your stop-loss and target points. Typically, the risk-to-reward (R:R) ratio should be at least 1:2, meaning that for every unit of risk, you should expect two units of reward.
One of the best methods for setting a stop-loss is placing it below the last pullback pattern or key support and resistance levels. Additionally, you should avoid risking more than 1% of your total capital on a single trade to prevent large losses.
Common Mistakes Traders Make When Identifying Trend Reversal in Price Action
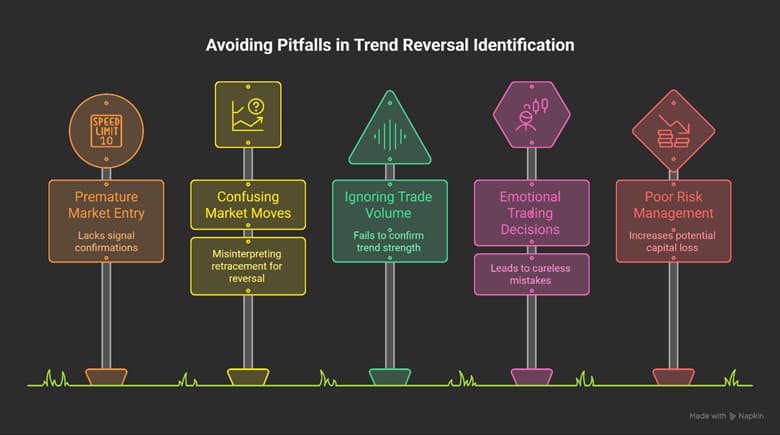
Traders often make mistakes when identifying trend reversals in price action, which can lead to losses. The most common mistakes include:
- Entering Too Early Without Confirmation: Many traders enter the market without waiting for additional confirmation signals, which may only be a retracement (temporary correction) and not a reversal (actual trend change).
- Mistaking Retracement for Reversal: Incorrectly distinguishing between these two can lead to entering wrong trades. A retracement is just a correction, while a reversal is a complete trend change.
- Ignoring Trading Volume: Volume can be a sign of the strength or weakness of a trend. Price movement without enough volume could indicate the continuation of the previous trend rather than a reversal.
- Emotional Decisions: Entering the market based on emotions can result in quick, careless mistakes.
- Lack of Risk Management: Not setting proper stop-loss and target levels can lead to capital loss. Each trade’s risk should be carefully managed.
One of the common mistakes traders make is prematurely predicting a trend reversal. Many people think the trend has changed when the market begins to move in the opposite direction, but this could just be a temporary correction.
Conclusion
Identifying trend reversal in price action requires precision and practice. To successfully recognize new trends, you should pay attention to valid signals and patterns such as key level breakouts and changes in volume. Additionally, using strategies like combining price action with moving averages can help you make more accurate trading decisions. Consistently practice in demo environments and learn from your mistakes. Ultimately, to grow as a trader, it’s essential to be patient and stay committed to continuous learning.


