


The tsi indicator is a simple tool that helps you understand whether prices are gaining or losing strength, even if you are new to trading. It works like a momentum gauge, using smoothing to reduce short-term “noise” so trends are easier to spot.
In this guide, you will learn what the TSI measures, how to read centreline crossovers, and how to use overbought and oversold zones without feeling overwhelmed.
You will also find practical settings for MT4, MT5, and TradingView, as well as beginner-friendly strategy ideas. Stay with us to the end for clear, step-by-step examples you can apply.

- The tsi indicator helps traders assess momentum strength and direction with smoother signals than many traditional oscillators.
- Learning how to use tsi indicator properly requires understanding trend context, not just reacting to crossovers.
- Choosing the right tsi indicator settings can significantly change signal frequency and overall strategy performance.
- A structured tsi indicator strategy works best when combined with disciplined risk management and platform testing.
Introduction to the TSI Indicator
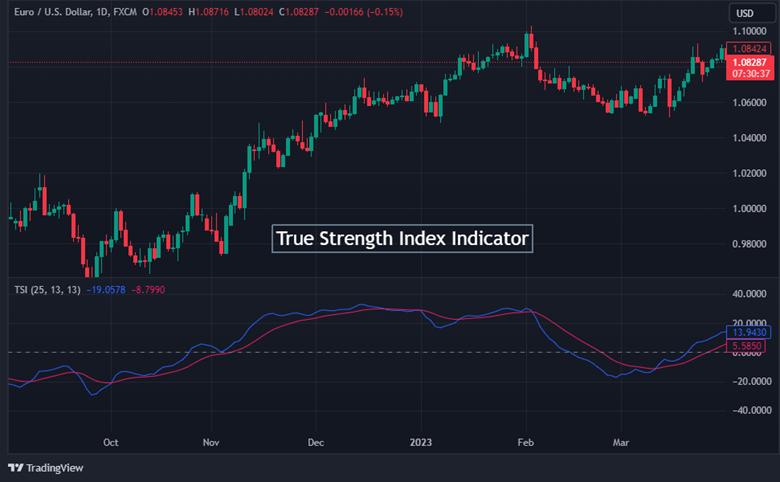
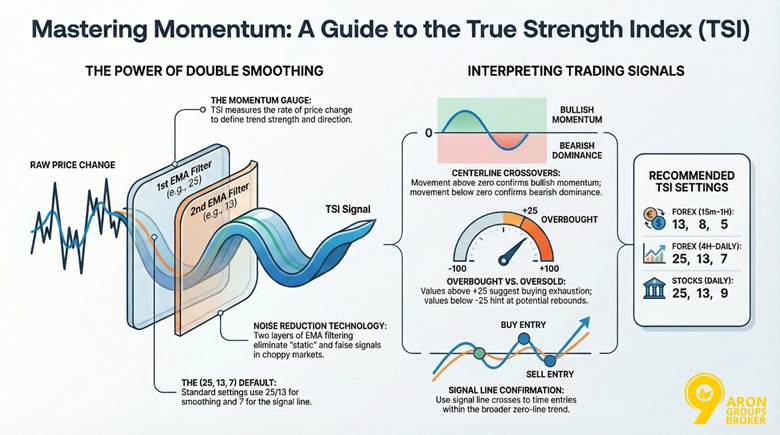
The tsi indicator is a momentum oscillator that helps traders assess trend strength and direction. Developed by William Blau, it stands out among technical tools.
It applies double smoothing to price changes using Exponential Moving Average (EMA). This process reduces market noise and delivers clearer signals than many single-smoothed oscillators.
Key features of the TSI include:
- Double smoothing for fewer false signals in choppy markets.
- Clear display of both momentum direction and strength.
- Identification of potential overbought or oversold conditions.
- Flexibility across forex, stocks, and various timeframes.
The TSI represents momentum in its truest form through double-smoothed price changes.
Unlike single-smoothed oscillators, such as RSI, which apply a single smoothing calculation, TSI’s layered approach helps limit whipsaws in sideways conditions.
This makes it attractive for traders building a structured tsi indicator strategy within broader technical analysis frameworks.

Key Point: Key Point:
The steepness of the TSI slope often reveals momentum acceleration before crossovers occur, giving early insight into strengthening or weakening trends.
What the TSI Indicator Measures and Why It Matters
The TSI indicator captures both the direction and strength of price momentum. Positive values reflect growing buying pressure, while negative values point to increasing selling strength.
This allows traders to judge whether a move is gaining conviction or simply losing energy within a broader trend.
Market noise reduction proves especially valuable during choppy periods. Single-smoothed tools often produce whipsaws.
The tsi momentum indicator avoids many of these through its layered EMA approach. As a result, it supports better decision-making in real trading scenarios.
Key Concepts: Momentum, EMA, and Market Noise
Momentum reflects the rate of price change over time. It forms the foundation of oscillators like the TSI. Exponential Moving Average (EMA) gives more weight to recent prices. This makes it responsive yet smooth.
Double smoothing applies EMA twice—first to momentum, then again to the result. Imagine filtering static from a radio signal.
The first pass clears obvious interference. The second removes the remaining fuzz for a clean sound. In trading, this process eliminates short-term noise while preserving true trend signals.
Brief History and Development by William Blau
The TSI was introduced in 1991 by William Blau, a market technician known for improving classical momentum tools.
His goal was to refine momentum measurement so traders could identify genuine price strength while minimising erratic signals.
Blau published his work in technical trading journals, where he explained the benefits of double smoothing over traditional oscillators.
Over time, the indicator became available on major platforms such as MetaTrader and TradingView.
According to TradingView, the TSI excels at detecting and confirming trend strength.
Q: Why did William Blau create TSI?
A: Blau aimed to improve existing oscillators by reducing erratic behaviour during volatile sessions. His double-smoothed approach sought to maintain responsiveness while improving reliability in real trading conditions.
Reading TSI Signals
Understanding signals is essential when learning how to use tsi indicator effectively. The tsi indicator generates insights through centreline movements, overbought and oversold levels, and signal line crossovers.
Together, these elements help traders interpret momentum shifts and improve trend confirmation.
| Signal Type | Description | Interpretation | Example Use |
|---|---|---|---|
| Centerline Crossover | TSI crosses the zero line | Above zero: bullish momentum; Below zero: bearish momentum | Confirms the uptrend start after a positive cross |
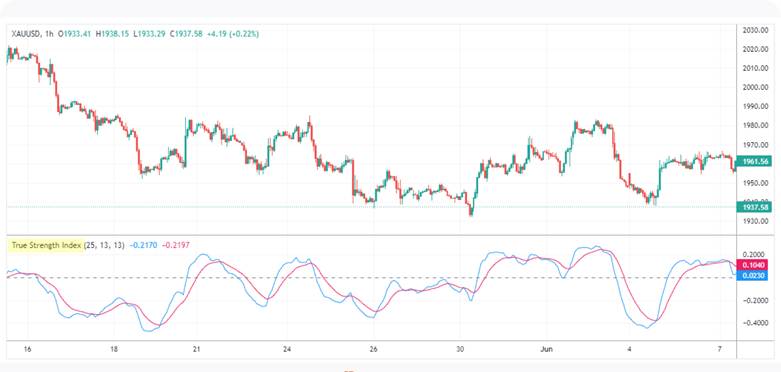
| Overbought/Oversold | TSI exceeds +25 or falls below -25 | Potential exhaustion; not automatic reversal | Monitor for pullbacks in stocks like gold trading |
| Signal Line Crossover | TSI crosses its EMA signal line (often 7-period) | Above signal: buy; Below signal: sell | Entry timing in forex pairs |
| Divergence | TSI direction opposes price | Hidden momentum shift | Combines with fibonacci retracement for targets |
Key Insight:
While similar to the rsi in spotting overbought levels, TSI's double smoothing offers fewer false signals in noisy conditions, making it ideal for trend confirmation.
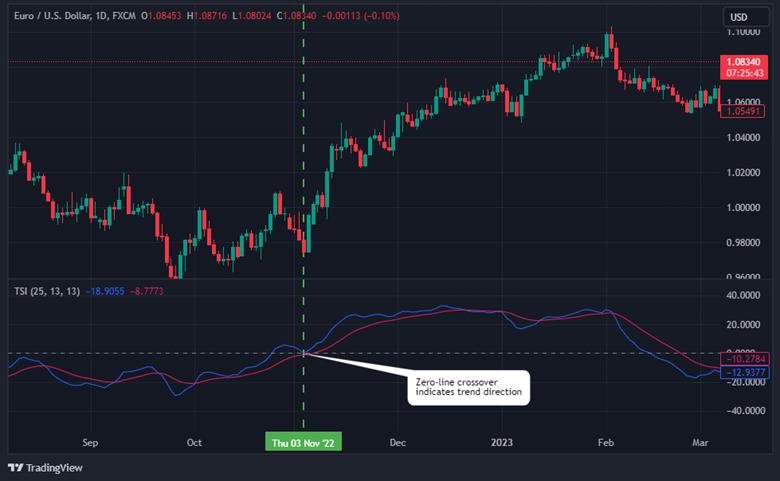
Understanding Centreline Crossovers for Trend Direction
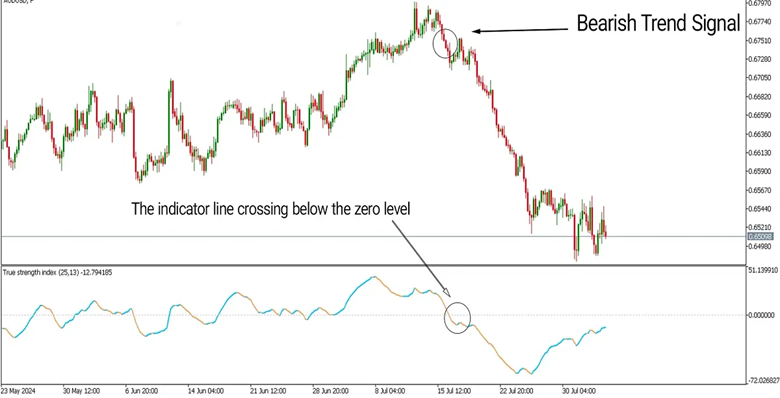
Centreline crossover occurs at the zero level. This acts as a primary gauge for momentum bias.
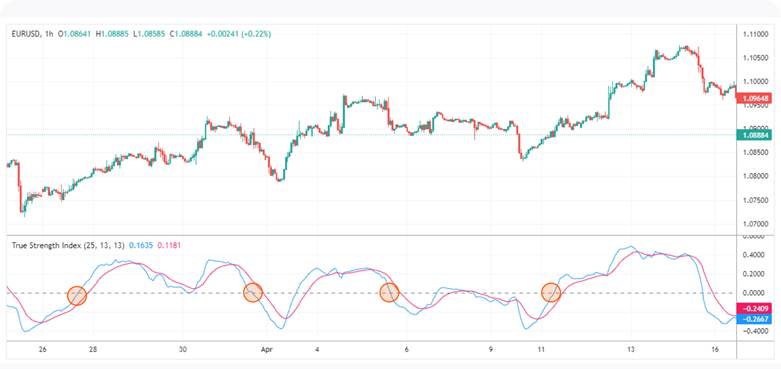
When the tsi indicator rises above zero, it signals bullish control and potential uptrend continuation. Conversely, a drop below zero points to bearish dominance.
This crossover aids trend confirmation by filtering short-term noise. In practice, wait for price action to align before acting. For instance, in forex, pair it with the MACD indicator for added validation.
According to StockCharts.com, the centerline crossover defines overall bias, with positive TSI favouring bulls.
| Feature | True Strength Index (TSI) | Relative Strength Index (RSI) |
|---|---|---|
| Smoothing | Double (2 EMAs) | Single |
| Best Environment | Choppy/Noisy markets | Fast, clean momentum shifts |
| Overbought/Sold | Dynamic (Usually +25 / -25) | Fixed (70 / 30) |
| Centreline | Zero (0) | Fifty (50) |
Identifying Overbought and Oversold Zones
Overbought and oversold zones highlight momentum extremes. Values above +25 suggest overbought conditions, where buying pressure may wane. Levels below -25 indicate oversold states, hinting at possible rebounds.
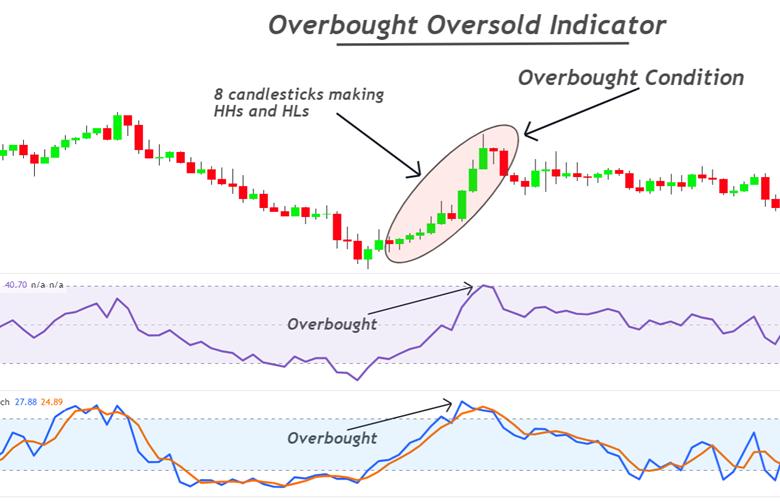
These are not foolproof reversal triggers. Market context matters—strong trends can sustain extremes. Compared to RSI, which uses 70/30 thresholds, TSI’s scale is tighter due to smoothing.
Extreme TSI values signal unsustainable activity, but combine with volume for reliability.
Confirming Trends with Lagging Signals
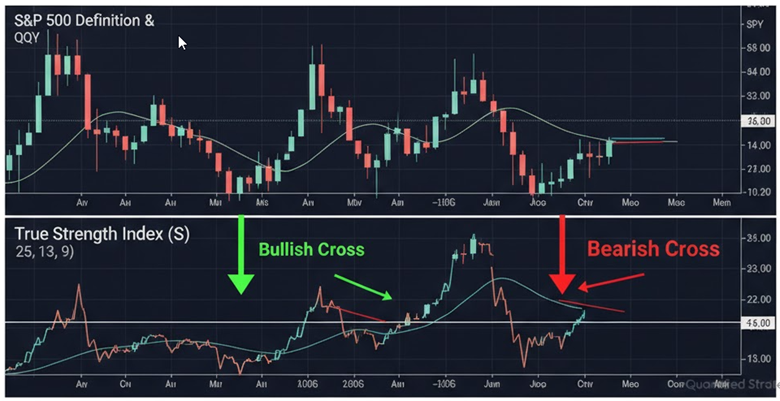
The TSI includes a signal line, typically an EMA of the indicator itself. When TSI crosses above its signal line, it suggests strengthening bullish momentum. When it crosses below, bearish momentum may increase.
Because smoothing is applied twice, TSI behaves partly as a lagging indicator. This reduces whipsaws but may delay entries slightly.
Signal-line crossovers are often used for refined entries within a broader zero-line trend. For example:
- Above zero + bullish signal crossover = stronger long bias
- Below zero + bearish signal crossover = stronger short bias
Q: Can overbought signals always predict reversals?
A: No, they indicate potential exhaustion but require confirmation. In strong uptrends, TSI may stay overbought longer, similar to how an economic crisis impacts sustained bearish oversold conditions. Always use stop losses to manage risks.
TSI Settings and Customisation
Flexible tsi indicator settings let traders adapt the tool to their style, asset, and timeframe. The most cited defaults use 25 for the first EMA, 13 for the second smoothing, and 7 for the signal line.
These balance responsiveness with double smoothing that cuts noise effectively. Adjust the periods to trade more or fewer signals while preserving reliability across platforms like MT4, MT5, and TradingView.
Recommended Default Settings for MT4, MT5, and TradingView
Most platforms load the same standard parameters for the tsi indicator.
- MT4 and MT5 (custom indicator): First EMA 25, second EMA 13, signal EMA 7
- TradingView (built-in): Long length 25, short length 13, signal 7
These defaults work well on daily charts for most forex pairs and stocks. To support execution workflows in MT platforms, some traders pair indicator settings with automation tools like Metatrader auto trading for alerts and consistency.
Tip:
If signals feel “late,” shorten the signal period first. If signals feel “noisy,” lengthen smoothing periods before changing anything else.
Adjusting Double Smoothing and EMA Periods for Accuracy
Think of double smoothing as a balance between clarity and speed. Longer periods reduce false signals, but they add delay. Shorter periods produce earlier signals, but increase whipsaws.
- Longer periods: smoother line, fewer signals, stronger filtering
- Shorter periods: more sensitive line, more signals, higher noise risk
A practical approach is to change one input at a time. Keep notes on how crossover frequency changes. This helps you avoid accidental overfitting.
According to BabyPips, the TSI’s double-smoothing feature allows easy customisation of these EMA lengths for different market conditions.
Tailoring Sensitivity for Stocks, Forex, and Different Timeframes
Forex pairs often need shorter periods because of higher volatility and frequent moves. Stocks benefit from longer settings that filter daily noise on higher timeframes.
Intraday traders shorten parameters for quick signals. Swing traders lengthen them for cleaner trend confirmation.
| Timeframe / Asset | Recommended Settings (First EMA, Second EMA, Signal) | Best For |
|---|---|---|
| Forex 15min–1H | 13, 8, 5 | Scalping & intraday |
| Forex 4H–Daily | 25, 13, 7 | Swing trading |
| Stocks Daily | 25, 13, 9 or 40, 20, 10 | Trend following |
| Stocks Weekly | 50, 25, 13 | Long-term position trades |
Trading Strategies with TSI
Practical TSI indicator strategy approaches leverage its momentum signals for entries and exits. Always prioritise risk management.
No strategy guarantees profits, as markets involve potential capital loss. Test ideas on demo accounts first.
Here are key tsi indicator strategies:
- Crossover Strategy: Buy when TSI crosses above its signal line and zero centreline. Sell on downside crosses. Suits are trending forex pairs.
- Divergence Setup: Enter long on bullish divergence near support. Short on bearish divergence at resistance. Confirms reversals effectively.
- Trend Filter Approach: Trade only in the direction of a 200-period EMA. Use TSI signals for timing. Reduces counter-trend risks.
- Overbought/Oversold Pullback: Buy in oversold zones during uptrends. Sell overbought in downtrends. Wait for signal confirmation.
According to Quantified Strategies, a TSI strategy on gold yielded 37% win rate with 0.64% average gain per trade.
Momentum-Based Entry and Exit Techniques
Centreline and signal crossovers drive momentum entries. Go long when TSI rises above zero and its signal line. This captures building upside-down strength.
For exits, reverse on opposite crosses. If long, sell when TSI falls below the signal. Align with price action for precision. use TSI slope for added confirmation in entries.
Combining TSI with Other Indicators (EMA, Oscillators)
Pair TSI with a 200-period EMA as a trend filter. Only take bullish signals above the EMA. This strengthens overall reliability.
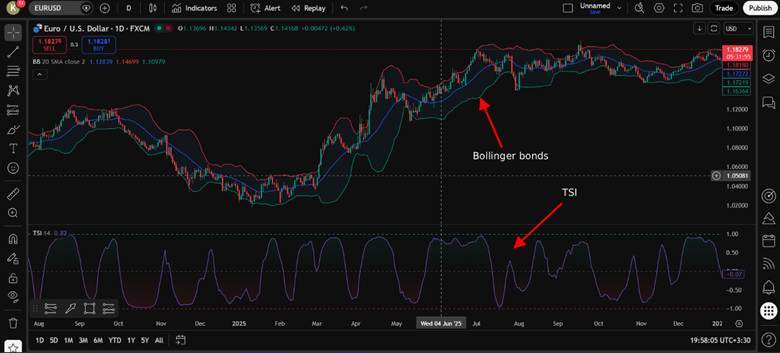
For volatility, combine with Bollinger bands. Enter when TSI signals align with band squeezes. Boosts accuracy in ranging markets.
Blend with oscillators like the MACD indicator or awesome oscillator for divergence checks. Enhances momentum reads without redundancy.
Avoiding False Signals in Choppy or Sideways Markets
Momentum strategies struggle in consolidation phases. During low volatility, the tsi indicator may produce frequent crossovers without sustained follow-through.
To reduce noise:
- Use ADX above 20–25 as a trend-strength filter
- Wait for a strong zero-line separation before entry
- Avoid trading during major news spikes
- Confirm higher timeframe alignment
Oscillators are most effective in trending markets and less reliable during sideways movement.
Note:
Trading involves significant risk of loss. Use stop-loss orders and position sizing. Never risk more than 1-2% per trade.
Q: What’s a simple TSI strategy for beginners in gold trading?
A: Start with centreline crossovers on daily charts for gold trading. Enter long above zero, exit on reversals. Combine with Fibonacci retracement for targets, and always apply risk management rules.
Platform-Specific Applications
Applying the TSI across platforms requires tailored setups. Popular choices include TradingView for web-based analysis, and MT4 or MT5 for desktop trading.
Each offers unique ways to implement the indicator effectively.
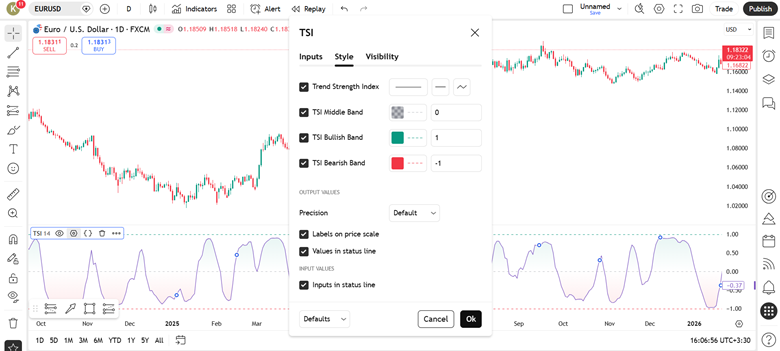
Setting Up TSI on TradingView
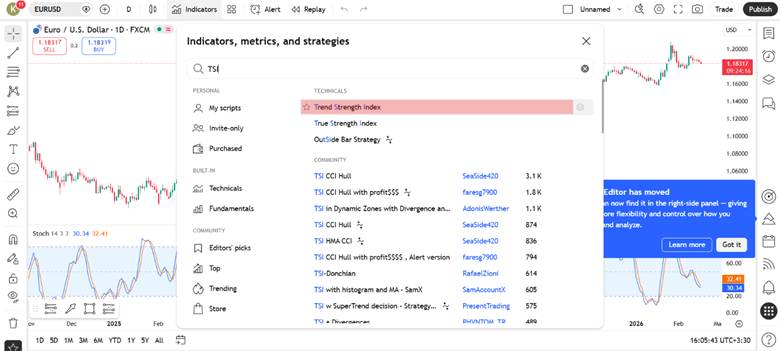
On TradingView, the process is straightforward because the indicator is built-in.
Step-by-step setup:
- Open your chart.
- Click “Indicators” at the top of the screen.
- Search for “True Strength Index.”
- Select the built-in version.
- Adjust inputs such as long length, short length, and signal smoothing.
You can also create alerts based on crossovers or zero-line breaks. Traders who use multiple platforms often prefer to connect TradingView to mt5 for execution while analysing signals visually on TradingView charts.
Tip:
Save your preferred settings as a template. This ensures consistency across assets and prevents accidental parameter changes.
Using TSI on MT4 and MT5 Effectively
In MetaTrader platforms, the setup differs slightly depending on whether the indicator is pre-installed or added manually.
For MT4:
- Open “Navigator” → Indicators.
- If not available by default, download a TSI file (.mq4) from the MQL Market or Code Base.
- Place the file inside the “Indicators” folder.
- Restart the platform and adjust parameters.
For MT5:
- Open “Insert” → Indicators → Custom (if installed).
- Use the input fields to adjust smoothing and signal values.
Stock vs Forex Applications of TSI
Stocks often require longer TSI periods due to lower volatility. Use 50, 25, and 13 for daily charts to filter noise in equities. Forex demands shorter settings like 13, 8, 5 for rapid moves in pairs.
In gold trading, forex-style short periods capture spikes. Stocks benefit from trend confirmation over weeks. Adapt based on asset class for optimal results.
According to LiteFinance, TSI suits both markets but needs volatility adjustments.
Tip:
Always backtest custom setups on historical data. This ensures the TSI aligns with your trading psychology without risking capital.
Q: Is TSI pre-installed on all platforms?
A: On TradingView, it is built in. On MT4, availability depends on your broker’s package and may require manual installation. MT5 often provides broader access to custom indicators through its marketplace.
Advanced TSI Analysis
Advanced use of the TSI focuses on three skills: reading double smoothing benefits, spotting divergences, and applying multi-timeframe trend confirmation.
These tools help you separate a temporary pullback from a genuine momentum shift. They also encourage more selective entries, which can reduce overtrading during noisy sessions.
Note:
Advanced signals improve context, not certainty. Always set a stop-loss, and risk only what you can afford to lose.
Double Smoothing for Reducing Market Noise
Advanced use of the TSI goes beyond understanding how it is calculated. At this stage, traders focus more on how the indicator behaves in different market conditions.
This includes analysing divergence patterns, trend persistence, and multi-timeframe alignment to refine entries and avoid weaker signals.
This outperforms single-smoothed tools by minimising false signals in noisy conditions. For instance, it provides smoother momentum readings than the RSI.
Single-smoothed indicators often react to minor price swings prematurely. TSI’s layered approach captures true trend strength instead. This leads to more reliable trend confirmation during choppy phases.
Recognising Divergences and Trend Reversals
Divergence compares price direction with momentum direction. It can warn that a trend is weakening.
- Bullish divergence: price makes lower lows, while TSI makes higher lows.
- Bearish divergence: price makes higher highs, while TSI makes lower highs.
Divergence is best used with confirmation. Look for a break of structure or a centreline improvement. This supports stronger trend confirmation than divergence alone.
Multi-Timeframe Approaches for Stronger Confirmation
Multi-timeframe logic reduces tunnel vision. Use a higher timeframe to define bias. Use a lower timeframe to time entries.
- Higher timeframe (D1 or H4): use TSI direction and centreline position for trend context.
- Entry timeframe (H1 or M15): wait for momentum alignment and cleaner crossovers.
This approach can reduce counter-trend trades. It also helps you ignore minor noise on lower charts.
Conclusion
The tsi indicator is a powerful way to read momentum, but it works best as part of a wider trading plan, not a standalone signal. To learn how to use tsi indicator with confidence, practice on a demo account and observe how it behaves in trends, ranges, and volatile sessions.
Combine it with trend filters or volatility tools, and always define your stop-loss and position size before entering. Test settings on your platform, keep simple notes, and refine rules based on evidence rather than emotion. Used with discipline, the tsi indicator can support clearer, more consistent decisions while staying risk-aware.


