


In financial markets, the market index acts as a “market thermometer,” providing a simple number that reflects the overall market’s health. By tracking market indices, investors can gauge whether the market sentiment is optimistic or bearish. This makes market indices a key tool for understanding the broader economic trends and the direction of the market, with indices like the Dow Jones vs S&P 500 offering valuable insights into stock performance and investor confidence.

- Many global market indices are updated at specific times of the day, and these updates can trigger momentary fluctuations in the stock market index.
- Futures and Options contracts are designed around market indices, serving as essential tools for professional traders who focus on stock market indices.
- When a company is added to or removed from a market index, significant capital flows toward the corresponding stocks, influencing the market index calculation.
- Even investors who don’t directly trade market indices make decisions based on the changes in index funds and other types of stock market indices.
What is a Market Index?
A market index is, in its simplest definition, a statistical measure designed to represent the overall performance of a segment of the financial market. This segment can include company stocks, bonds, commodities (such as gold and oil), or even currencies.
In simple terms, a market index functions like a smart oscillating tool. Instead of tracking the price of each asset, the index summarizes them into a single figure, providing an overall view of the market trends. This is why understanding the stock market index is crucial for investors looking to assess the general market direction.
History and Emergence of Market Indices
The idea of market indices was first developed in the late 19th century by Charles Dow, with the goal of providing a broad overview of the market’s condition. This led to the introduction of the Dow Jones Industrial Index in 1896, and gradually, more diverse indices emerged in the 20th century, such as the S&P 500, Nasdaq, FTSE 100, and Nikkei 225.
Today, market indices are not limited to stocks. They cover markets such as bonds, commodities, and currencies, and have even become the basis for modern investment tools like index funds and exchange-traded funds (ETFs).
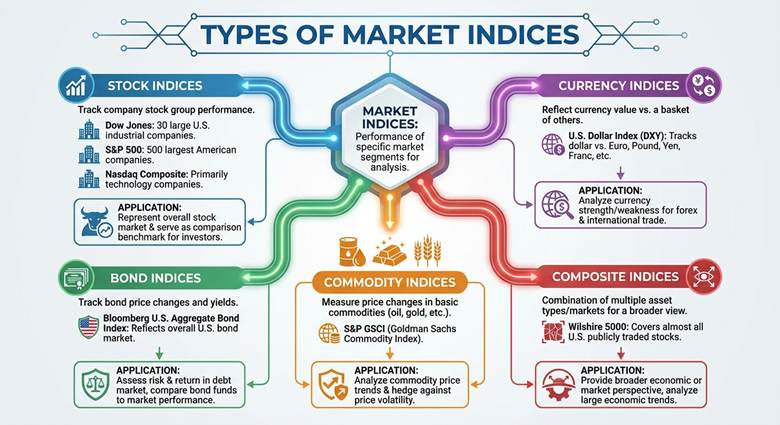
Types of Market Indices
Market indices are divided into different categories depending on the type of assets and their objectives. Each of these indices represents the performance of a specific segment of the market and is a valuable analytical tool for investors.
Stock Indices
These indices track the performance of a group of company stocks. For example:
- Dow Jones: Composed of 30 large industrial companies in the U.S.
- S&P 500: Includes 500 of the largest American companies.
- Nasdaq Composite: Primarily includes technology companies.
Application: Stock indices represent the overall stock market and serve as a benchmark for comparing investor performance against the broader market.
Bond Indices
- These indices track the price changes and yields of bonds. A well-known example is the Bloomberg U.S. Aggregate Bond Index, which reflects the overall bond market in the U.S.
- Application: Bond indices are used to assess the risk and return of investments in the debt market and compare bond funds to market performance.
Commodity Indices
These indices measure price changes in basic commodities such as oil, gold, natural gas, and agricultural products.
- A well-known example is the S&P GSCI (Goldman Sachs Commodity Index).
- Application: Investors use these indices to Analyse trends in commodity prices and to hedge against price volatility in the commodities market.
Currency Indices
These indices reflect the changes in the value of a currency relative to a basket of other currencies. A key example is the U.S. Dollar Index (DXY), which tracks the value of the dollar against currencies like the euro, pound, Japanese yen, and Swiss franc.
- Application: Forex traders and international companies use currency indices to Analyse the strength or weakness of a currency.

Some market indices are intentionally designed to be tamper-proof, as they are composed of a diverse range of assets or those that are non-tradable.
Composite Indices
These indices are a combination of multiple asset types or markets, providing a broader view.
- An example is the Wilshire 5000, which covers almost all publicly traded stocks in the U.S.
- Application: Composite indices are used for a broader economic or market perspective and are ideal for analyzing large economic trends.
The Most Important Market Indices in the World
The world’s financial markets are filled with a wide array of market indices, but some are more prominent due to their global reach, credibility, and significance. These market indices serve as crucial benchmarks for analysts and investors, providing insights into broader economic trends and the performance of specific sectors or economies.

Dow Jones Index
The Dow Jones Industrial Average (DJIA) is one of the oldest and most recognized stock indices globally, introduced in 1896. It includes 30 of the largest and most established industrial companies in the United States, spanning various sectors such as technology, finance, and healthcare.
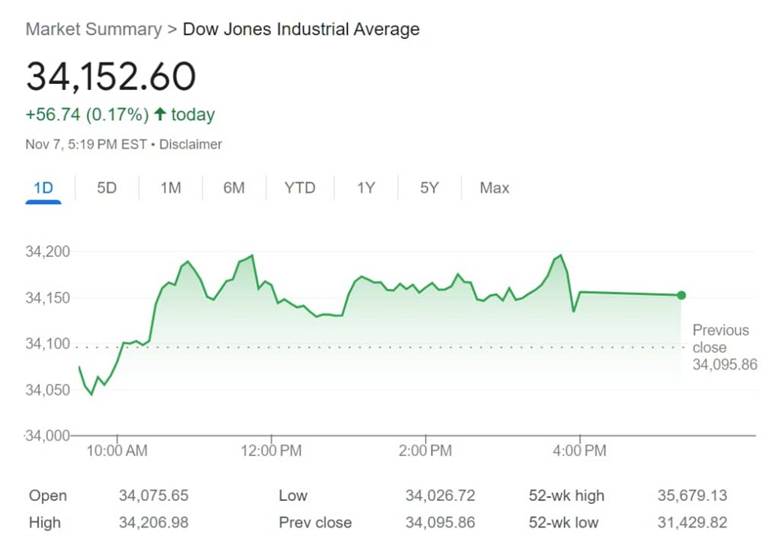
Features:
- Price-weighted calculation method, meaning that higher-priced stocks have a greater impact on the index’s movement.
- The index reflects the performance of blue-chip stocks, which are considered stable and reliable investments.
- Often seen as a barometer of the U.S. economy and a symbol of the U.S. stock market for many investors.
The Dow Jones is a traditional market index, frequently used to track the health of the American economy and stock market indices in general.
S&P 500 Index
Launched in 1957, the S&P 500 includes 500 of the largest U.S. companies, weighted by market Capitalisation (market cap). It is one of the most important stock market indices and serves as a benchmark for the broader U.S. equity market.
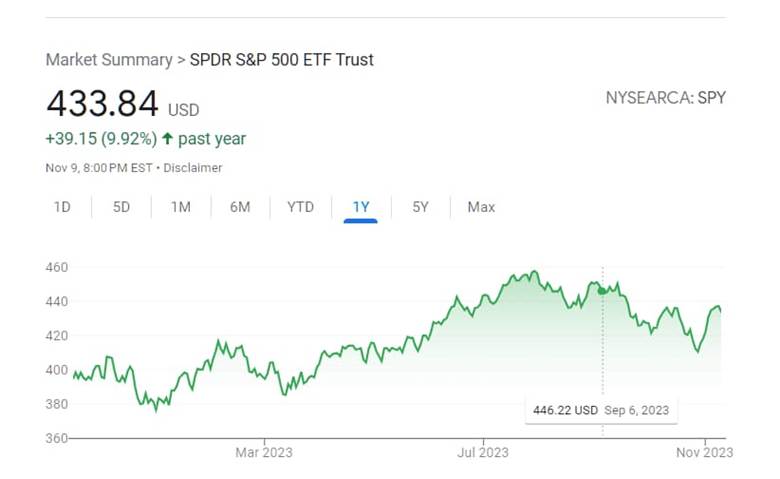
Features:
- Market cap-weighted, meaning companies with a higher market value influence the index more.
- The S&P 500 covers roughly 80% of the total U.S. stock market value, making it a strong reflection of the overall economy.
- Frequently used to compare the performance of investment portfolios against the U.S. stock market.
The S&P 500 is often regarded as the best representation of the U.S. economy, making it a key stock market index for both individual and institutional investors.
Nasdaq Composite Index
The Nasdaq Composite, introduced in 1971, includes over 3,000 companies, with a focus on technology stocks such as Apple, Amazon, and Microsoft, making it an important market index for tracking the tech sector.
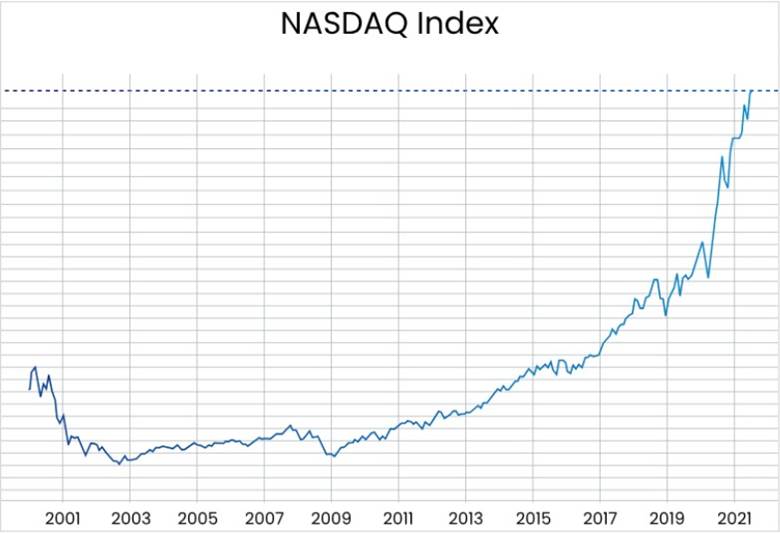
Features:
- Primarily tracks tech stocks, reflecting the performance of innovative companies.
- Like the S&P 500, it is market cap-weighted, but it tends to exhibit more volatility.
- Offers investors insights into the technology sector’s performance, as well as the broader economy.
The Nasdaq Composite is often seen as a thermometer for the tech industry, showing the growth or decline of technology-driven markets and startups.
FTSE 100 Index
Introduced in 1984, the FTSE 100 tracks the performance of the 100 largest companies listed on the London Stock Exchange. As a prominent stock market index in the U.K., it plays a key role in assessing the overall health of the British economy.
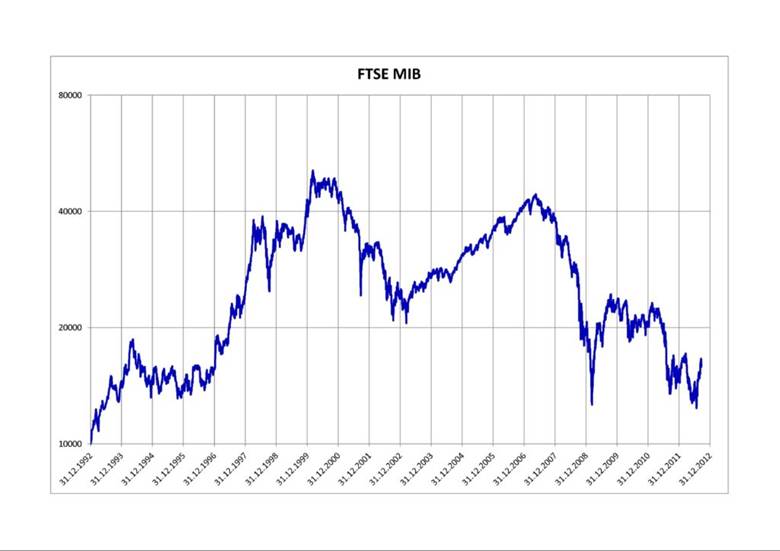
Features:
- Market cap-weighted, similar to the S&P 500.
- Reflects the performance of major U.K. stocks across diverse industries, from banking to energy.
- Provides a snapshot of the economic stability in the U.K. and Europe.
The FTSE 100 is one of the leading market indices for European investors, offering a reliable gauge of the U.K. stock market and broader European market trends.
Thematic Indices are those that, instead of following a traditional industry, track trends like green energy, artificial intelligence, or blockchain.
Nikkei 225 Index
The Nikkei 225, created in 1950, is Japan’s leading stock index, consisting of 225 major companies listed on the Tokyo Stock Exchange. It serves as a vital indicator of Japan’s economy, the second-largest economy in Asia.
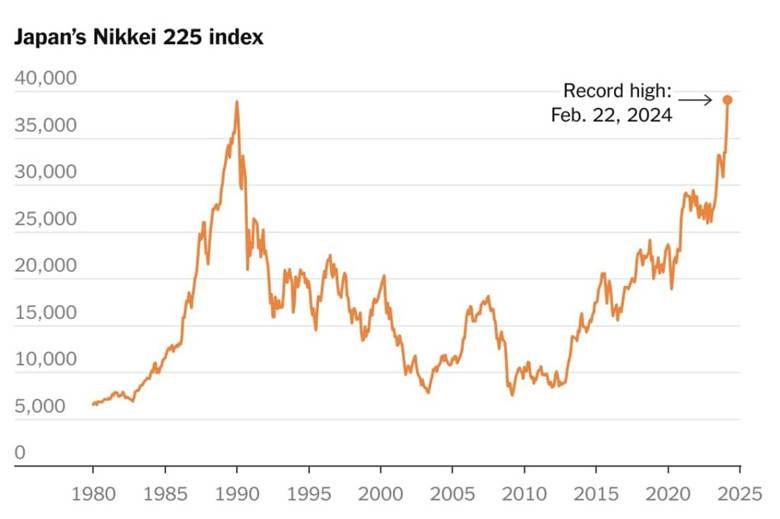
Features:
- Price-weighted, similar to the Dow Jones, meaning that higher-priced stocks influence the index more.
- Covers a wide array of Japanese industries, from technology stocks to automotive giants like Toyota and Honda.
- Provides insights into the economic pulse of Japan, especially in the context of its leading industries.
The Nikkei 225 is the main market index used to assess the health of Japan’s stock market, and by extension, its economic strength.
The Most Important Market Indices in Iran
Similar to global markets, the Iranian capital market uses market indices to represent the overall condition of the market and different industries. These market indices help investors understand the direction of the stock market, whether it’s bullish, bearish, or neutral. The three main indices that are most closely watched in Iran are:
Tehran Stock Exchange Overall Index (TEDPIX)
The TEDPIX is the most important index in Iran’s stock market and has been calculated since 1990. This index reflects the weighted average changes in the market value of listed companies.
Features:
- Market cap weighted, meaning larger companies have a greater impact on the index.
- Major companies like steel, petrochemical, or banking sectors have a significant influence on the index.
- The index is calculated by dividing the total market value of stocks by the base value of the index (100 points in 1990).
When it is said that the TEDPIX has increased, it means that the overall value of shares in larger companies has risen. For this reason, this index predominantly reflects the performance of the “giants” of the stock market.
Equal-Weighted Index
The Equal-Weighted Index was introduced in 2014 to address the shortcomings of the TEDPIX. In this index, all companies, regardless of their size, have equal weight.
Features:
- Every company, regardless of its size, has the same impact on the index.
- It provides a more accurate representation of the overall market, not just the large companies.
- This index is a better measure for investors focused on small or mid-sized stocks.
If the TEDPIX rises but the Equal-Weighted Index drops, it indicates that the market’s growth is mainly driven by a few large stocks, and most companies are not performing well.
Sectoral Indices
In addition to the TEDPIX and the Equal-Weighted Index, each industry has its own specific index. For example:
- Automobile and Parts Industry Index
- Basic Metals Industry Index
- Petrochemical Industry Index
- Banking and Financial Institutions Industry Index
Features:
- They show the performance of each industry separately.
- Investors can compare these indices to understand which industry is leading and which is lagging.
- They are important tools for analyzing investment portfolios based on industries.
For example, if the TEDPIX is rising but the Automobile Industry Index is falling, it means that the market growth is mainly driven by other industries such as petrochemicals or metals.
Method of Calculating Market Indices
Market indices are not just a simple number. This number is the result of specific calculations based on the weighting methods applied to the assets. Depending on which factor is given more weight (price, market value, or equal), the indices will show different behaviors.
Value-Weighted Indices
In this method, the weight of each stock or asset is determined based on a specific economic or financial measure. This value can be sales, profit, revenue, or assets.
- Example: Some fundamental indexes use this method, determining the weight of companies based on annual profit or revenue.
- Advantages: Provides a more accurate reflection of a company’s fundamental status.
- Disadvantages: Stocks with low prices but strong performance may be underrepresented.
Price-Weighted Indices
In this model, the only factor for weighting is the stock price; that is, each stock affects the index based on its price.
- Example: The Dow Jones uses this method. If one stock costs $300, it will impact the index ten times more than a stock priced at $30.
- Advantages: It’s the simplest and oldest calculation method.
- Disadvantages: The real size of the company (like market value) is not considered, and expensive stocks have an outsized impact.
In some cases, changes in major global indices like the S&P 500 or DAX can even influence the flow of capital entering or exiting a country.
Equal-Weighted Indices
In these indices, all companies have the same weight, meaning both small companies and large market giants impact the index equally.
- Example: The Equal-Weighted Index of Tehran Stock Exchange and some of the S&P indices.
- Advantages: Provides a more realistic view of the overall market performance, as all companies are considered.
- Disadvantages: The volatility of smaller stocks can artificially drive the index up or down.
Market Cap-Weighted Indices
This is the most common method globally. In this method, the weight of each company is determined based on its market Capitalisation (number of shares × share price).
- Example: The S&P 500 or the TEDPIX. If a large company like Apple or Mobarakeh Steel exists, its impact on the index is much greater than a smaller company.
- Advantages: Reflects the actual importance of companies in the market.
- Disadvantages: The influence of market giants can be too strong, and the growth or decline of a few large stocks may shift the entire index.
The Use of Market Index for Investors
Let’s explore the key uses of market indices for investors:
Understanding Market Sentiment
Market indices act like an economic thermometer. Their changes can show:
- Whether the market is generally trending upward or downward.
- Whether investors are more optimistic or pessimistic.
- Which sectors of the economy (such as technology, energy, or financial industries) are performing better.
In this way, market indices help investors get an overall picture of the market without needing to Analyse each asset.
Investment Performance Comparison (Benchmarking)
One of the most important roles of market indices is to serve as a benchmark for comparison. Investors and funds measure their performance against reliable indices.
For example, if your portfolio has grown by 10%, but the S&P 500 has grown by 15% over the same period, it means your investment has underperformed compared to the market. This comparison helps investors better assess the quality of their strategy and capital management.
Basis for Investment Funds (Index Funds & ETFs)
Investors cannot directly buy and sell indices themselves, but indices form the basis for designing investment tools like:
- Index Funds
- Exchange-Traded Funds (ETFs)
These tools allow investors to own a portfolio of assets within an index by purchasing a single unit of the fund. As a result, market indices provide an easy and low-cost way to invest in the broader market.
Analytical and Decision-Making Tool
Market indices are not only metrics but are also used in financial analysis and investment decisions:
- In fundamental analysis, indices help assess the overall economy and its sectors.
- In risk management, indices are used as the foundation for determining portfolio composition.
- Investors track market indices trends to identify entry and exit points for the market.
In simple terms, market indices are a common language for analysts and investors.
Risk Prediction and Management
Market indices can act as warning lights, indicating potential future market changes:
- A sharp drop in the overall index may signal a market correction or economic recession.
- A significant rise in a specific industry index (such as petrochemicals or technology) can indicate the attractiveness of that sector for investment.
For this reason, professional investors use market indices not only to track the past but also to predict the future and manage risk.
Advantages and Limitations of Market Index
Market indices are practical and widely used tools in the world of investing. However, like any other financial instrument, they have their strengths and weaknesses. Understanding these advantages and limitations helps investors set more realistic expectations when using indices.
Advantages of Market Indices:
- Simplification of Complex Information
Market indices summarize the performance of hundreds or thousands of assets into a single number. This makes it easier for everyone, even beginners, to understand the overall market trends.
- Comparison Metric
Investors and funds use market indices to compare the performance of their investment portfolios against the broader market.
- Indicator of the Overall Economy
Market indices act as an “economic thermometer,” with their changes reflecting the health or weakness of the economy.
- Basis for New Financial Instruments
Index funds and ETFs are designed based on indices, providing an easy and diversified way to invest.
- Aid in Analysis and Decision-Making
Investors use market indices to Analyse economic trends, manage risk, and determine entry and exit points in the market.
Limitations of Market Indices:
- Overemphasis on Large Companies
In market-cap weighted indices (such as the S&P 500 or the TEDPIX), larger companies have more weight. This means that the rise or fall of just a few big stocks can change the entire index, even if most companies are performing differently.
- Ignoring Companies’ Fundamental Health
Some indices focus only on stock prices (like the Dow Jones) and ignore important factors such as profitability or debt levels of the companies.
- Lack of Market Detail
While market indices provide an overall picture, they might conceal the performance of smaller industries or mid-sized companies.
- Potential for Misinterpretation
An increase in the index does not necessarily mean broad economic prosperity; it could indicate growth in just a few specific industries.
- Short-Term Volatility
Market indices can be influenced by short-term events or market excitement and may not always reflect the true value of assets.
Conclusion
A market index is one of the most important financial tools, playing a key role in understanding the overall economic situation and making investment decisions. By simplifying vast amounts of information, a market index provides a clear picture of market trends and helps investors compare their performance against reliable benchmarks.
However, market indices also have limitations and should not be the sole basis for analysis, as they may be overly influenced by large companies or short-term volatility. Therefore, the best use of a market index occurs when it is combined with other analytical tools, such as fundamental analysis and risk management.