


VCP pattern is a pattern that consistently appears before major stock breakouts. VCP (Volatility Contraction Pattern), popularised by U.S. trading champion Mark Minervini, focuses on tightening price action, volume dry-up, and clear supply and demand imbalance before a powerful move higher.
In this guide, we break down the VCP chart pattern, explain how institutional accumulation creates these setups, and show how to scan, validate, and trade them using practical tools such as TradingView screeners. You will also learn about pivot points, Relative Strength (RS), stop loss placement, and realistic VCP pattern targets.
Let’s begin by understanding the core mechanics behind this breakout strategy.

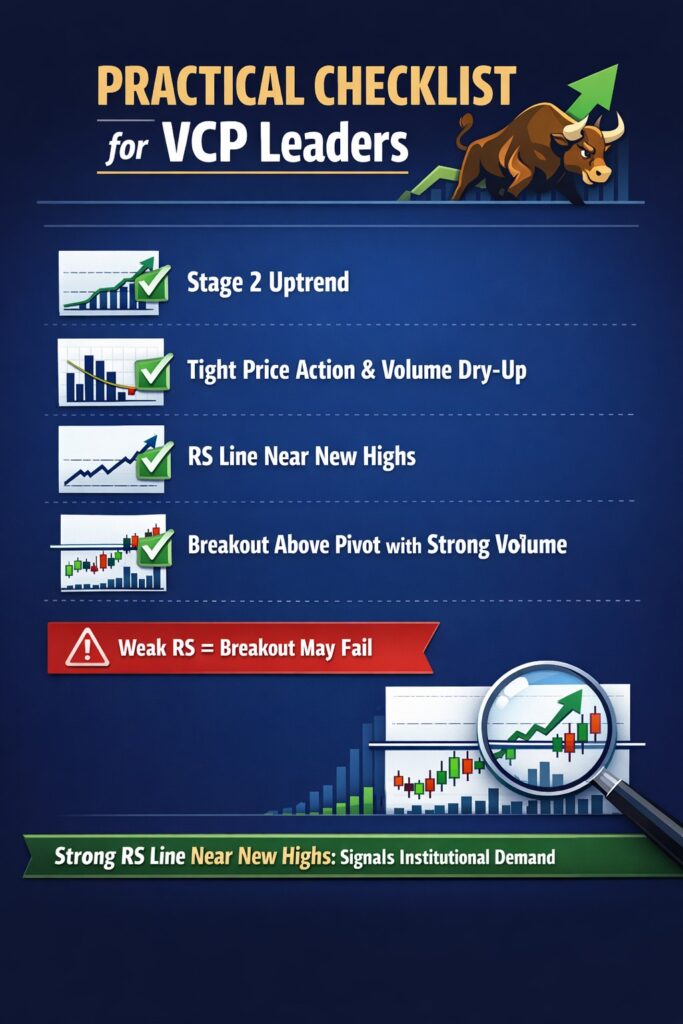
- The best VCP pattern form in a Stage 2 Uptrend with strong Relative Strength (RS).
- VCP screener and scanner help you find candidates—but you must confirm the VCP structure on the chart.
- In VCP pattern, buy the pivot breakout on strong volume (or a pocket pivot in advanced cases) and avoid chasing extended moves.
- Use logical stop loss placement, target with 2R–3R, and size positions in vcp pattern trading.
Getting to Grips with the VCP Pattern
Many traders confuse simple consolidation with a true volatility contraction structure. That mistake leads to weak breakouts and unnecessary losses.
What Exactly is the VCP Pattern?
According to MARK MINERVINI’s book about VCP, The VCP pattern (Volatility Contraction Pattern) is a breakout setup where both price volatility and trading volume contract in stages before price pushes through a key resistance level (the pivot). In other words, the stock stops swinging wildly, and fewer shares trade as the base develops. That combination is the clue: supply is drying up.
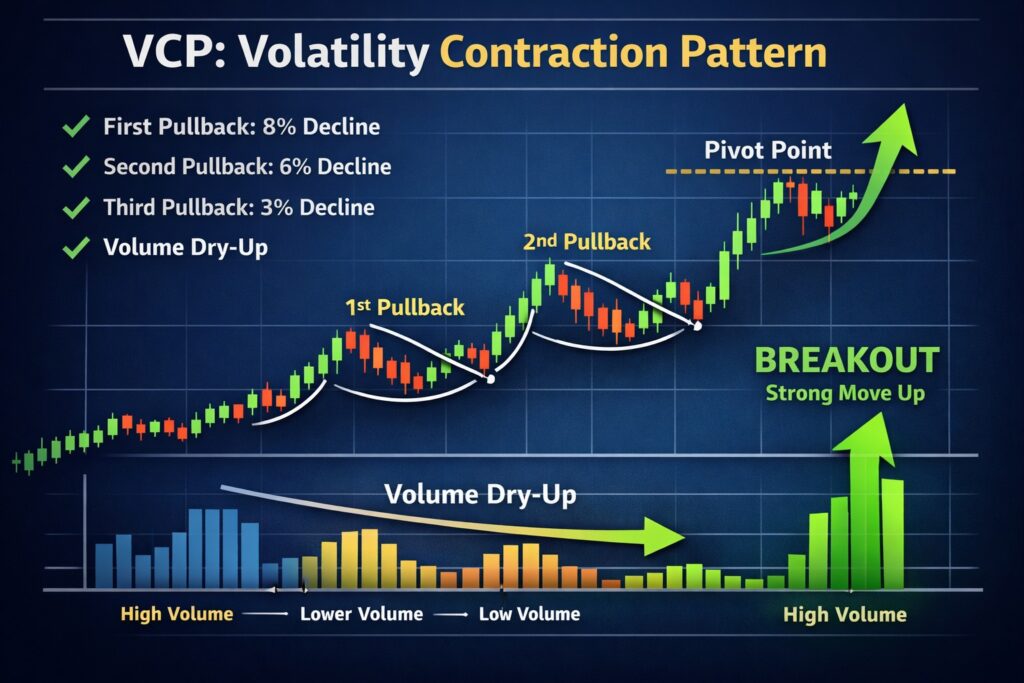
Simple numeric example:
- Pullback 1: $100 → $92 (−8%), volume ~2.4M shares
- Pullback 2: $105 → $99 (−6%), volume ~1.7M shares
- Pullback 3: $110 → $107 (−3%), volume ~1.1M shares
Q: What confirms the VCP setup?
A: A breakout above the pivot on noticeably higher volume than the prior days. Without volume expansion on breakout, the move is weaker and more likely to fail.
How the VCP Pattern Evolved in Stock Trading
According to Tradingsim, the VCP pattern existed long before Mark Minervini.
Early Wyckoff-style traders already described the same idea: during accumulation, volatility and volume fall as supply dries up.
Later breakout methods like O’Neil’s cup-with-handle also used the same behaviour—tight price action near highs with lighter volume before a breakout.
However, Mark Minervini refined the pattern into a rule-based Mark Minervini VCP strategy ( his SEPA methodology), combining:
- Stage 2 Uptrend confirmation
- Strong Relative Strength (RS)
- Clear pivot point definition
- Strict risk management
Spotting the Key Features of a VCP Chart Pattern
A proper VCP chart pattern is not “any consolidation.” It has a clear, organised structure that tightens over time, both in price and in volume. When you spot it correctly, you are basically seeing supply disappear while demand stays steady.
According to Traderlion, the key elements of a high-quality VCP pattern are as follow:
- Progressive contractions: Each pullback is smaller than the previous one; that is the core idea.
- Volume dry-up: Selling volume decreases during corrections (each contraction shows less volume than the prior one). Fewer shares traded means fewer sellers are active; supply is being absorbed.
- Symmetry and Structure: Most VCP bases have 2 to 6 contractions, and they tighten from left to right. The chart should look “neat,” not messy. That symmetry often suggests institutional accumulation rather than random retail trading.
- Low Supply Near the Pivot Point: As the base tightens, the price approaches a clear resistance level—the pivot point. Near this pivot, volume should be very low.
- Continuation in an Uptrend (Stage 2 Matters): VCPs work best as continuation patterns in an uptrend, ideally a Stage 2 Uptrend. If the stock is not trending well, you may get a breakout—but the odds drop.
Q: What invalidates a VCP setup?
A: Wide, volatile swings with heavy selling volume. That suggests distribution, not accumulation.
A clean VCP setup looks controlled and calm before the move. Strong breakouts rarely come from chaotic charts.

Key insight:
A Stage 2 Uptrend, based on Stan Weinstein’s Stage Analysis, is the expansion phase in a stock’s lifecycle where price breaks out of a base and begins making higher highs and higher lows, supported by rising volume and strong Relative Strength (RS).
How Minervini Uses the VCP Pattern Strategy
Minervini treats the VCP pattern as a “pressure build-up” setup. He looks for a strong stock in an uptrend where selling pressure fades step by step. When supply becomes limited and demand returns, price can move fast. The whole mark minervini vcp strategy is built around reading that supply–demand shift through price action and volume.
Institutional Accumulation and Supply-Demand Shifts in VCP Stocks
A high-quality VCP stock pattern often forms when institutions buy quietly. They do not buy all at once. They absorb shares over time, usually during pullbacks. That buying support is why the price does not collapse.
In VCP terms, you are watching supply shrink:
- Early in the base, sellers are still active, so pullbacks are deeper.
- Later, fewer sellers remain, so pullbacks become smaller.
- Near the pivot, supply is “thin,” so price holds tight.
At the same time, the volume should dry up. Lower volume means fewer shares are being sold. That is the volume dry-up signature that Minervini wants to see before a breakout.
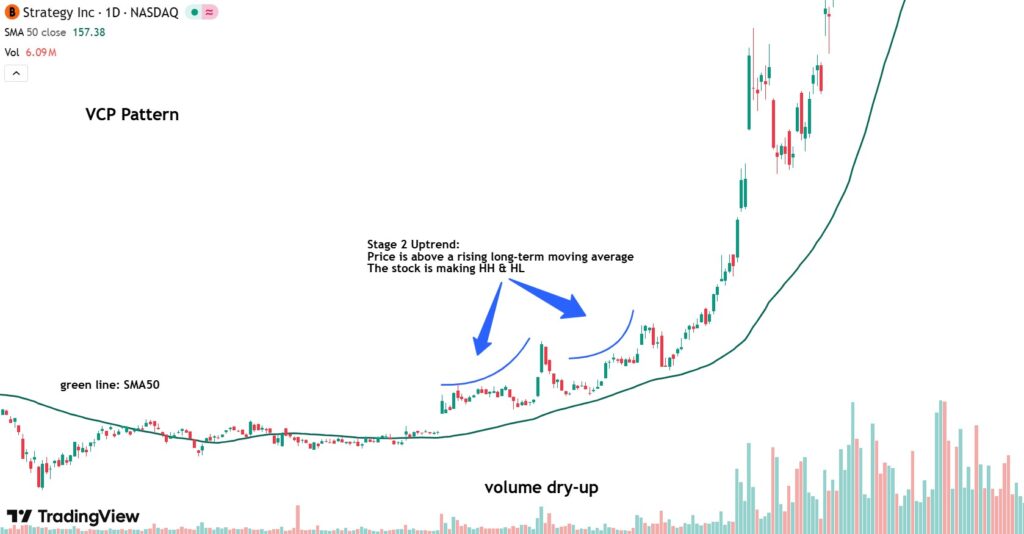
Recognising Stage 2 Uptrends and Pocket Pivot Signals
Minervini usually trades VCP setups only inside a Stage 2 Uptrend. This is the advancing phase where price is above a rising long-term moving average and the stock is making higher highs and higher lows.
Why does that matter in vcp pattern?
A VCP is a pause. If the bigger trend is already up (Stage 2), then the base is usually a temporary rest before demand pushes price higher again.
If the stock is not in Stage 2, the VCP breakout is less likely. You may get a move, but there is no strong trend behind it.
Minervini may also use a Pocket Pivot as an early entry. It appears that when the price pushes up from within the base, the volume is stronger than the recent down-volume. The message is simple: demand is showing strength before the standard breakout.
- Standard breakout: price clears the pivot high
- Pocket pivot: demand shows up earlier inside the base
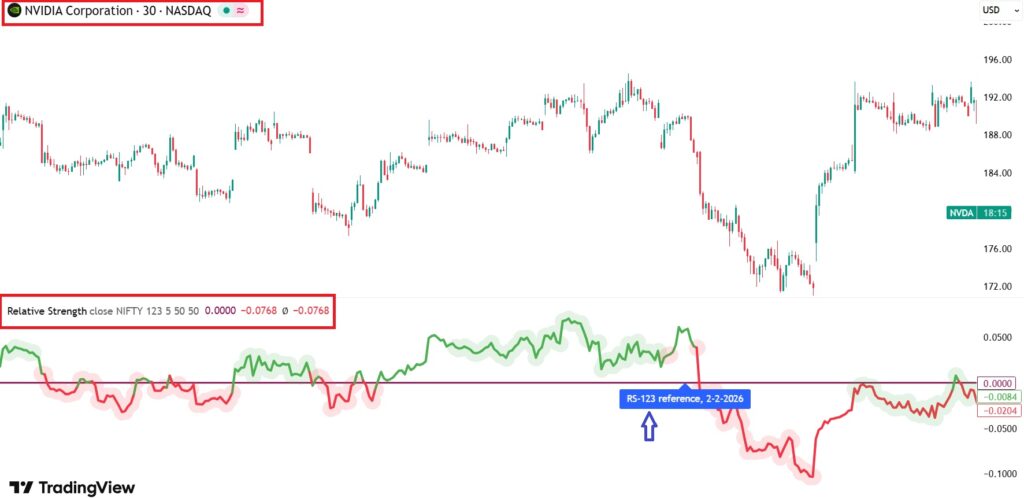
Using Relative Strength (RS) to Identify VCP Leaders
Minervini wants leaders, not average stocks. He uses Relative Strength (RS) to confirm that demand for this stock is stronger than the overall market.
According to investabc, Relative Strength (RS) measures how a stock performs compared to a benchmark index, such as the S&P 500. In simple terms, RS shows where demand is strongest relative to the broader market.
A practical way to think about RS:
- If a stock rises faster than the index—or falls less during market weakness—its RS is strong.
A strong RS line near new highs often means institutions prefer that stock (strong demand).
Finding and Screening VCP Pattern Stocks
Spotting one clean VCP pattern manually is manageable. Finding them consistently across hundreds of stocks is not. That is why screening and structured filtering are essential. The goal is simple: narrow the market down to strong stocks where supply is shrinking and demand is preparing to take control.
Tools and Screeners for VCP Patterns
There is no built-in “VCP pattern” shortcut on any platform. Instead, some tools and platforms use preset screens to capture the behaviour of VCP: strong prior momentum, then a tight consolidation.
A practical toolkit looks like this:
- Deepvue-style presets:
Deepvue platform uses below presets to filter stocks:- Power Play: as mentioned in Deepvue, the power play concept looks for stocks that have already made a strong price advance—such as a large percentage gain over the past six months—and are now experiencing a shallow, controlled pullback rather than a deep correction.
It is the pre-condition that often comes before a high-quality VCP. - “Tight Range” logic screens for very low recent volatility (e.g., small 5-day % range) and low measured volatility.
- Power Play: as mentioned in Deepvue, the power play concept looks for stocks that have already made a strong price advance—such as a large percentage gain over the past six months—and are now experiencing a shallow, controlled pullback rather than a deep correction.
- TradingView Stock Screener:
Use filters like price above key moving averages, strong performance, and liquidity, then inspect the chart.
TradingView is stronger than acother platforms for VCP traders because it allows more technical filters and custom conditions.
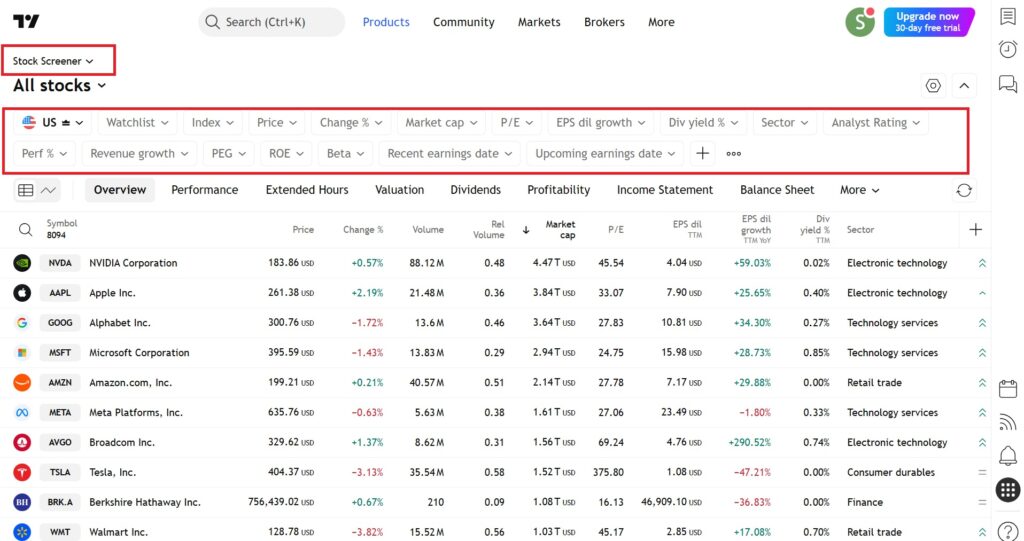
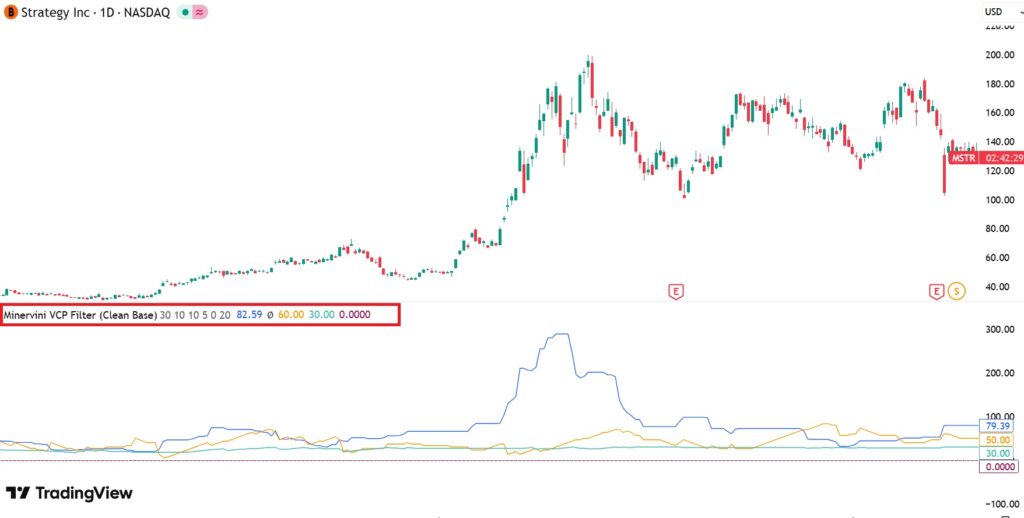
In addition, TradingView has several community-built scripts labeled as VCP pattern indicator or volatility contraction pattern scanner. These indicators attempt to automatically detect shrinking price ranges, declining ATR, or tightening highs and lows. While they can help highlight potential setups, they are only approximation tools.
- Finviz:
Finviz is a filtering tool, not a VCP pattern detector. great for narrowing by trend (price above MAs), liquidity, and “near highs”, then you manually confirm the VCP structure. For VCP screening, use Finviz to filter for:- Price above 50-day and 200-day moving averages
- Stock near 52-week highs
- Strong recent performance
- Sufficient average volume (liquidity)
These filters help you find stocks already in a Stage 2 Uptrend, where demand is stronger than supply.
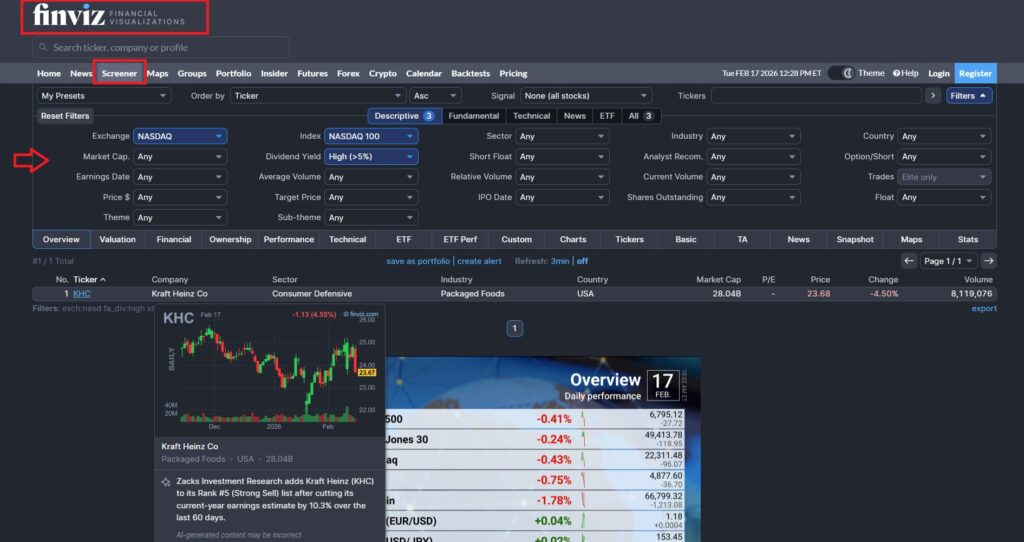
Table: Comparison of VCP Screening Tools
| Feature / Platform | Finviz | Deepvue | TradingView Stock Screener |
|---|---|---|---|
| Ease of Use | Very simple and fast | Structured presets | Flexible but requires setup |
| Built-in VCP Logic | ❌ No direct VCP detection | ✅ Preset screens inspired by VCP behaviour | ❌ No direct VCP label |
| Trend Filters (Stage 2) | Basic (Price vs MA) | Strong trend + performance filters | Advanced MA & performance filters |
| Volatility Compression Filters | Limited | Designed to capture tight ranges | Can approximate using ATR, narrow range filters |
| Volume Analysis | Basic volume filter | Focus on volume contraction logic | Customisable volume filters |
| Relative Strength (RS) | Basic performance filters | Momentum-focused presets | Performance vs index filters available |
| Best Use Case | Quick market narrowing | Finding strong momentum + tight pullbacks | Advanced technical filtering |
| Manual Chart Confirmation Needed? | ✅ Yes | ✅ Yes | ✅ Yes |
| Ideal For | Beginners / Fast scans | Growth & momentum traders | Technical traders wanting flexibility |
How to Identify US Stocks with VCP in 2025–2026
If you are trying to build a list of US stocks with vcp pattern 2026, don’t chase random “hot lists.” Build a repeatable pipeline:
Step 1: Force leadership (demand is already winning).
- Stock is in a Stage 2 uptrend (price above rising long-term MA).
- Strong Relative Strength (RS) versus the market.
Step 2: Force tightness (supply is disappearing).
Look for 2–6 contractions where each pullback is smaller than the last, plus volume contraction. Deepvue’s examples describe exactly this progressive tightening and volume shrink as the pattern forms.
Step 3: Force a clean pivot (clear decision point).
You want an obvious resistance line where price “presses” with tight closes. Deepvue calls this the pivot point and expects a volume surge when price breaks above it.
Swing Trading Breakouts Using VCP Chart Patterns
VCP works well for a swing trading breakout strategy because the pattern gives you a logical entry and a tight invalidation point. A valid vcp chart pattern typically breaks above the pivot on strong volume, which Deepvue highlights as breakout confirmation.
A clean, practical trade plan:
- Entry: buy as price clears the pivot (e.g., pivot $50 → entry $50.40).
- Stop loss placement: below the low of the final contraction (e.g., $47.80).
- Risk per share: $50.40 − $47.80 = $2.60.
- Target: start with 2R–3R (e.g., $55.60 to $58.20), then trail if momentum stays strong.
Q: What if it breaks out but volume is weak?
A: Treat it as a lower-quality breakout. VCP logic depends on supply being absorbed and demand showing up decisively—volume is the evidence.
Managing Entries, Exits and Risk in VCP Trading
A strong VCP pattern means nothing without proper execution. Many traders identify clean setups but lose money due to poor risk control. The edge in the Mark Minervini vcp strategy comes not only from structure, but from disciplined entries, clear stop loss placement, and controlled position sizing.
Entry Strategy: Timing the VCP Breakout
Entry in a VCP pattern must be precise.
- Best entry: Buy the breakout above the pivot point when volume expands (ideally 30–40% above average).
- Alternative entry: Use a Pocket Pivot inside the base (early signal) only in a strong Stage 2 Uptrend.
- Avoid: Chasing price more than ~5% above the pivot and entering on weak volume.
- Core idea: Enter when demand clearly overwhelms supply, not while price is still drifting inside the base.
Placing Stop Losses and Controlling Risk for VCP Setups
Stop-loss logic in a VCP trading pattern: if supply is truly absorbed, price should not drop hard back into the base.
Two common stop methods:
- Place the stop just below the last contraction low (e.g., low $95 → stop slightly under it).
Use a fixed risk limit of about 5–8% per trade (Minervini-style).
Trading rule:
If the breakout fails fast with heavy selling volume, exit immediately—supply likely wasn’t absorbed.
Setting Targets for VCP Pattern Breakouts
There is no single fixed VCP pattern target. Use a logical targeting method instead:
- R-multiple targets: aim for 2R–3R (e.g., risk $5 → target $10–$15 profit).
- Measured move: project the base height upward (e.g., $90–$100 base → $10 range → breakout at $100 → target ~$110+).
- Trend-following: in a strong Stage 2 Uptrend, trail stops under higher lows or MAs like 10EMA/20EMA.
Position Sizing and Trade Management with VCP Stocks
Position sizing determines survival, keeps risk controlled even if the trade fails.
Basic formula:
Account Risk per Trade = 0.5% to 1% of total capital
Example:
- Account size = $50,000
- Risk per trade = 1% → $500
- Risk per share = $5
- Position size = $500 ÷ $5 = 100 shares
During trade management:
- If breakout gains 10–15% quickly, consider partial profit.
- If price moves sideways with low volume, hold.
- If heavy selling appears, reduce exposure.
Learning from Real-World VCP Examples
Theory is useful, but real understanding comes from studying live charts. The VCP pattern becomes much clearer when you analyse how price, volume, and supply–demand behaviour unfold in actual market conditions. Studying both winning and failed setups builds judgment, which is more important than memorising rules.
Annotated Case Study of a VCP Stock from Mark Minervini’s Portfolio
Minervini shares personal trade examples and annotated charts in Trade Like a Champion. The recurring blueprint is consistent: a leading stock runs hard, then forms a tight base where supply dries up, then breaks out through a clear pivot.
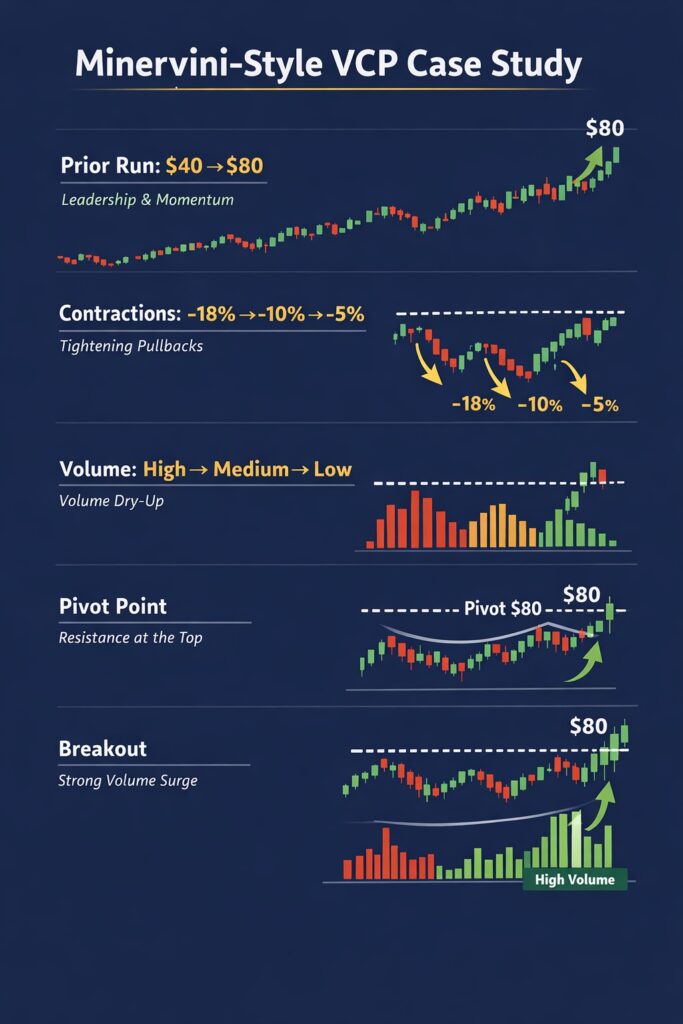
A “Minervini-style” VCP case study typically looks like this (numbers are illustrative, but the structure is the point):
- Prior run: $40 → $80 (leadership + momentum)
- Contractions: −18% → −10% → −5% (tightening pullbacks)
- Volume: high → medium → low (volume dry-up)
- Pivot point: clean resistance near the top of the base
- Breakout: price clears the pivot with strong volume (demand overwhelms supply)
If the base is tight and the trend filters are aligned, the “line of least resistance” points higher.
Comparing Different VCP Stock Patterns
Not every VCP is equal. Two common “buckets”:
- Clean VCP (high quality): tight closes, shallow last contraction, volume gets quiet near the pivot.
- Messy VCP (low quality): wide swings, deeper late pullbacks, volume stays active (supply is not exhausted).
Key point:
Strong prior momentum plus controlled pullback are vital; this helps you avoid “dead” bases in weak stocks.
Lessons from Failed VCP Setups
Most failed VCPs fail for boring reasons:
- The stock wasn’t truly in a Stage 2 trend (trend filter ignored).
- “Dry-up” never happened—volume stayed heavy (supply still present).
- Breakout cleared the pivot but volume didn’t confirm (weak demand).
- The breakout was chased too far above the pivot (bad entry, bad R:R).
Treat failures as a diagnostic: if supply wasn’t absorbed, the setup wasn’t VCP—just a range.
Advanced Tips for VCP Pattern Trading
Once you understand structure, trend, and risk control, you can refine your VCP pattern execution using technical indicators. Indicators should not replace price and volume analysis, but they can improve timing and confirmation. The key is to use them as supporting tools—not as primary signals.
Using RSI to Time Your VCP Trades
The Relative Strength Index (RSI) measures momentum on a scale from 0 to 100. In VCP trading, RSI is not used to find “oversold” levels. Instead, it helps confirm strength during consolidation and breakout.
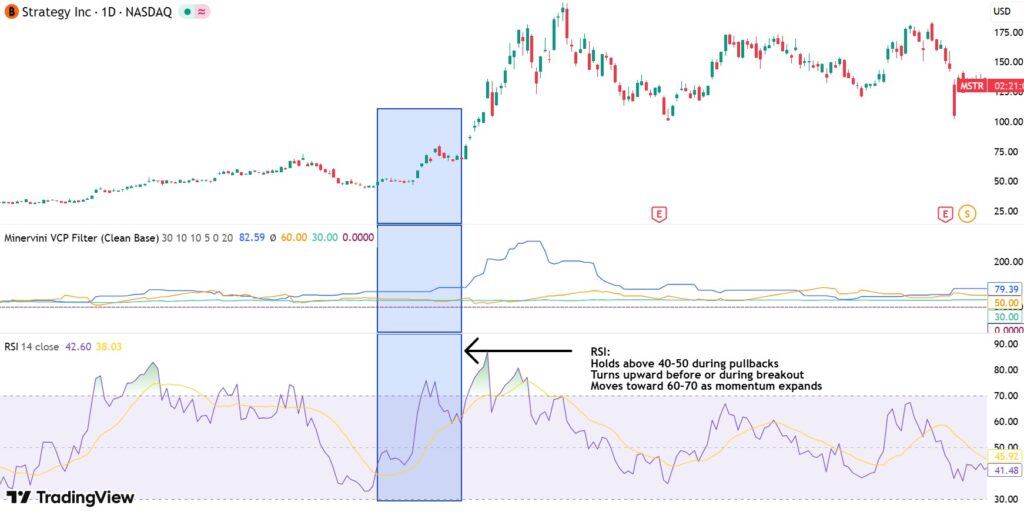
In a strong vcp stock pattern, RSI typically:
- Holds above 40–50 during pullbacks
- Turns upward before or during breakout
- Moves toward 60–70 as momentum expands
Warning:
If RSI shows bearish divergence (price makes higher highs but RSI makes lower highs), demand may be weakening.
How Moving Averages Can Support VCP Breakouts
Moving averages act as dynamic support during consolidation. In a proper Stage 2 Uptrend, price should remain above key averages such as 20-day EMA and 50-day SMA.
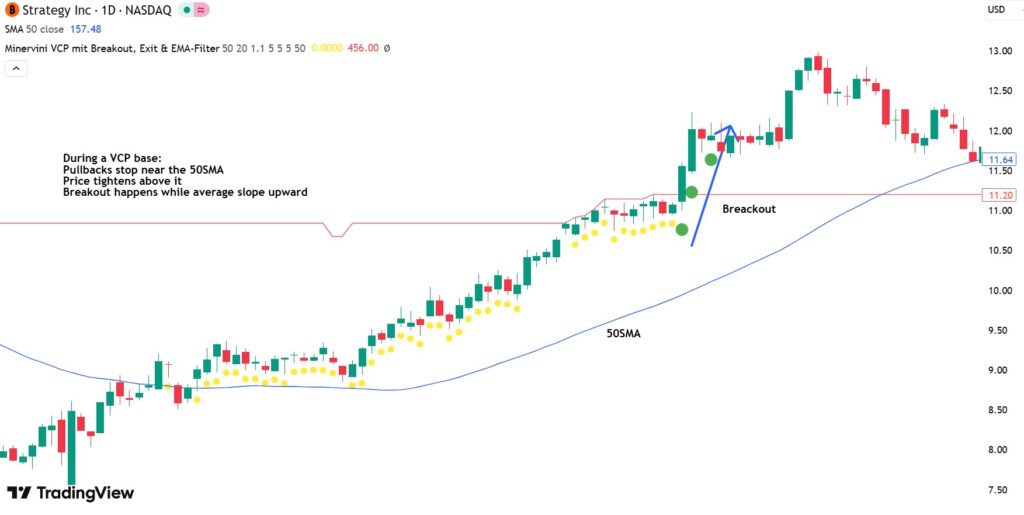
During a VCP base:
- Pullbacks often stop near the 20EMA or 50SMA
- Price tightens above these levels
- Breakout happens while averages slope upward
Warning:
Rising moving averages beneath price confirm structural strength. If price breaks below the 50SMA during the base, the setup weakens.
Applying MACD to Confirm VCP Pattern Signals
The MACD (Moving Average Convergence Divergence) measures trend momentum. In VCP setups, MACD can confirm that momentum is rebuilding before breakout.
Healthy signs include:
- MACD histogram shrinking during contraction (momentum stabilising)
- MACD line crossing above signal line near breakout
- Histogram expanding positively during breakout
Conclusion
The VCP pattern is not a “magic setup.” It is a logical way to trade when supply is clearly shrinking and demand is ready to take control. Mark Minervini’s approach works because it is selective: he focuses on leaders in a Stage 2 Uptrend, waits for tight price action and volume dry-up, then enters at a clean pivot with disciplined risk rules. If you combine structure (VCP), context (trend + RS), and execution (entry, stops, sizing), you stop guessing and start trading with a repeatable process. The goal is not to catch every breakout—it is to catch the best ones and protect capital when you are wrong.


