


In financial markets, traders continually seek tools that enable them to anticipate upcoming price movements. One of the most popular methods for this purpose is the use of Fibonacci tools. These tools are based on mathematical ratios, allowing traders to identify potential areas where the price may reverse or continue its trend. Among them, Fibonacci Projection holds a special place, as it can forecast future price levels after a market correction (Retracement) within an existing trend.
In the following sections, we will explore this Fibonacci tool in more detail.

- Projection levels work more reliably on higher timeframes, providing stronger signals for traders.
- Fibonacci Projection helps traders calculate the risk-to-reward ratio (RRR) of a trade with greater accuracy.
- Price reactions at projection levels gain more credibility when confirmed by an increase in trading volume.
- Projection is highly effective not only in Forex and stocks but also in volatile markets such as crypto, gold, and oil.
What Is Fibonacci Projection and How Traders Apply It in Technical Analysis?
Fibonacci Projection is a technical analysis tool used to identify potential price targets within a trend. It becomes active after a price correction (Retracement) and helps traders estimate how far the price may extend in the direction of the primary trend.
Unlike Fibonacci Retracement, which is drawn using only two points (the start and end of a move), Fibonacci Projection requires three points:
- The starting point of the move,
- The ending point of the initial move,
- And the correction point.
With these three points, levels such as 100%, 161.8%, or 261.8% are plotted on the chart. These levels often serve as potential support or resistance zones, providing necessary signals for trade entries or exits. Put simply, if a stock or currency pair makes an initial move upward and then experiences a correction, Fibonacci Projection helps estimate how far the next move might extend. This ability to forecast potential extensions makes Fibonacci Projection a practical tool for setting take-profit targets or identifying possible reversal zones.
Fibonacci Projection vs. Fibonacci Retracement: Key Differences and Trading Applications
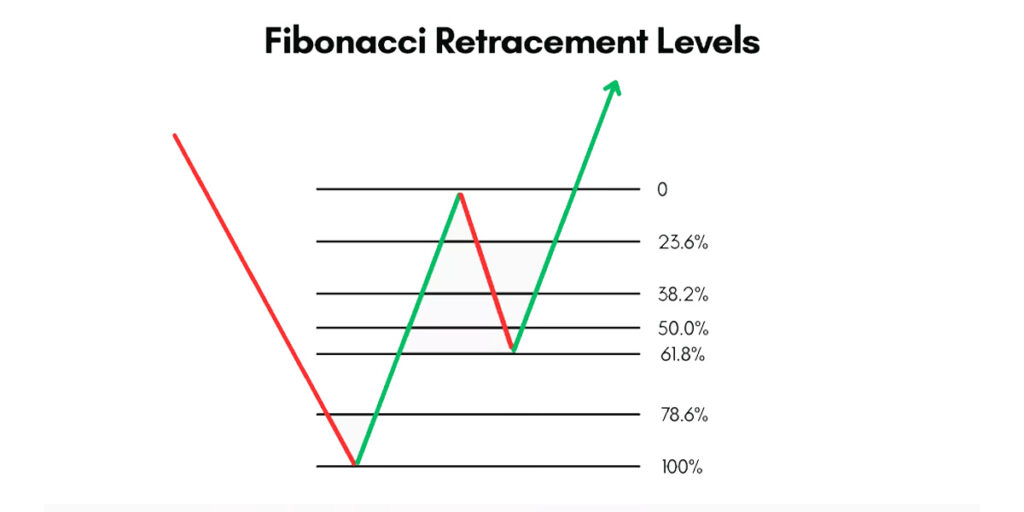
Fibonacci Retracement is drawn by selecting two key points on the chart, a Swing High and a Swing Low. Its purpose is to highlight potential support and resistance levels during a temporary price pullback.
In other words, when the price in an uptrend or downtrend retraces slightly, Fibonacci Retracement shows the likely zones where the pullback could end before the primary trend resumes.
According to Investopedia, the most commonly used retracement levels are 38.2%, 50%, and 61.8%, as they frequently act as reaction points in the market.
But Fibonacci Projection takes things one step further. This tool requires three points, and once these points are selected, levels such as 100%, 161.8%, or 261.8% are automatically plotted on the chart.

Integrating Fibonacci Projection with trading volume provides deeper insight into whether projected levels are simply psychological markers or reinforced by actual market liquidity.
Key Fibonacci Projection Levels
Within Fibonacci Projection, several significant levels stand out and attract the most attention from traders. These levels are derived from the well-known Fibonacci ratios and help identify potential zones where price may extend or react.
- 100%: where the price typically mirrors the size of the previous move.
- 161.8%: often called the “golden level,” frequently used as the primary take-profit target.
- 261.8%: a strong extension level that can be reached if the trend continues with momentum.
- 423.6%: a more distant target, usually observed in highly impulsive and long-term moves.
In other words, these levels serve as potential price checkpoints. When an asset resumes its trend after a correction, it often pauses, reverses, or at least reacts around these projections. These characteristics are why traders rely on these levels to set entry points, exit points, and risk management strategies.
How to Accurately Draw Fibonacci Projection on Trading Charts
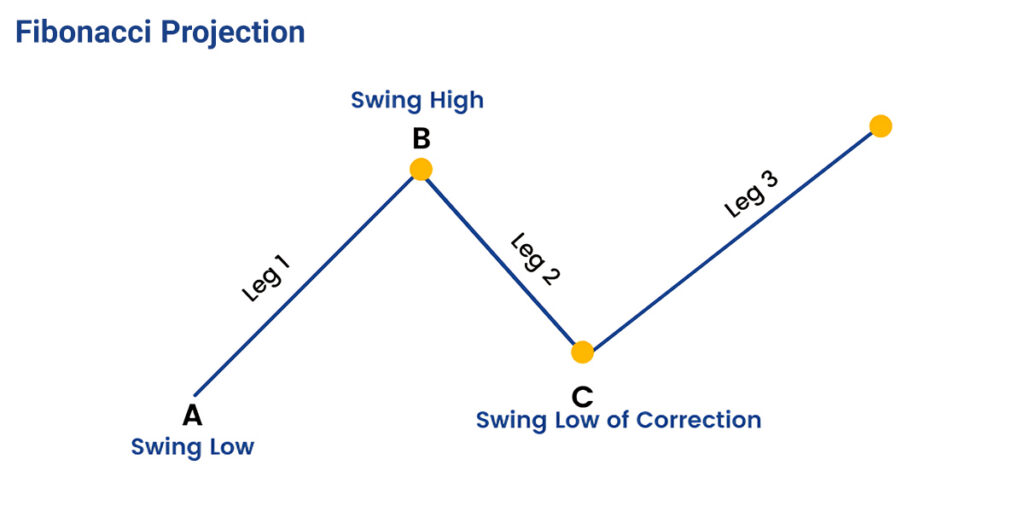
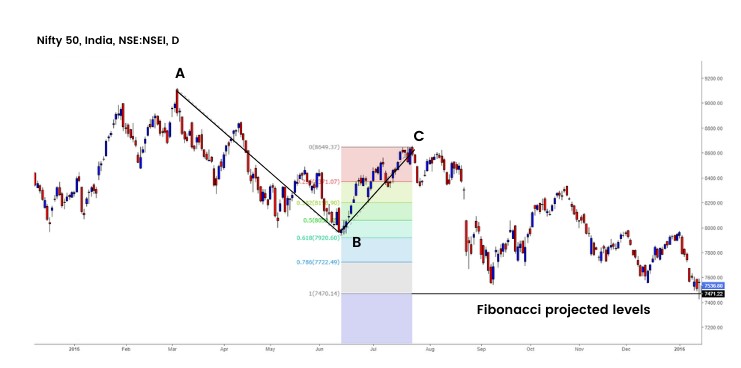
To plot the Fibonacci Projection, you need to select three key points on the chart. In the example above, these points are labelled as A, B, and C:
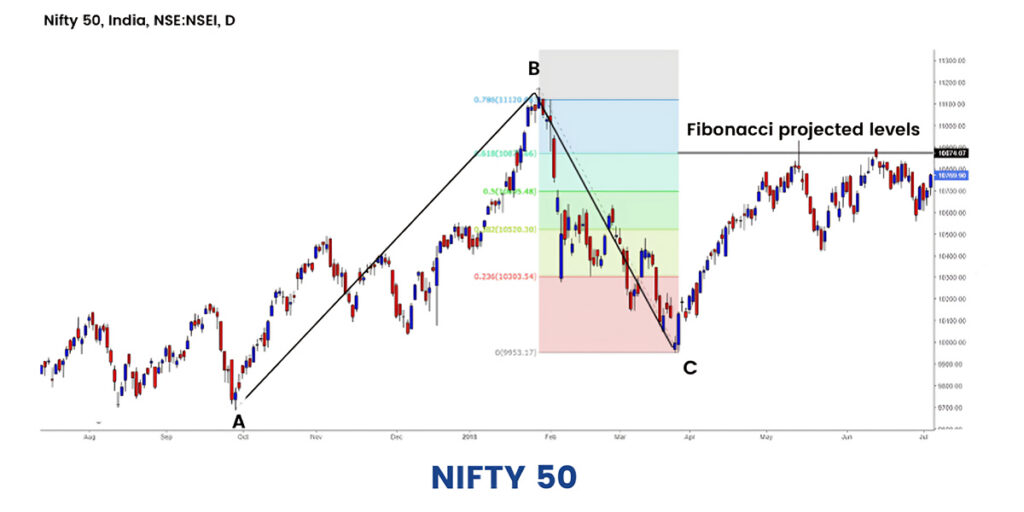
- Point A: the level where the primary upward/downward move begins.
- Point B: the highest/lowest point of the initial move, where the trend pauses and a correction starts.
- Point C: the corrective bottom/top that forms after the first move.
Once these three points are selected, the Fibonacci Projection tool automatically plots potential price targets on the chart. These typically include growth levels of 100%, 161.8%, 261.8%, and 423.6%.
- At the 100% level, the price extends by the same distance as the initial move (AB) following the correction (BC).
- The 161.8% level is one of the most important targets, often used by traders as a key take-profit level.
- Higher extensions, such as 261.8% and 423.6%, are generally reached during strong and impulsive trends.
As shown in the chart, after point C, the price resumes its upward trend and moves toward these projection levels. Each of these levels can act as a resistance zone or an area where the market reacts.
Accurate Trade Signals Using Fibonacci Projection and Price Action
The chart below illustrates how Fibonacci Projection can be combined with Price Action to refine trade decisions. By watching how candlestick patterns, breakouts, or pullbacks behave around projection levels, traders can confirm stronger entry and exit signals.
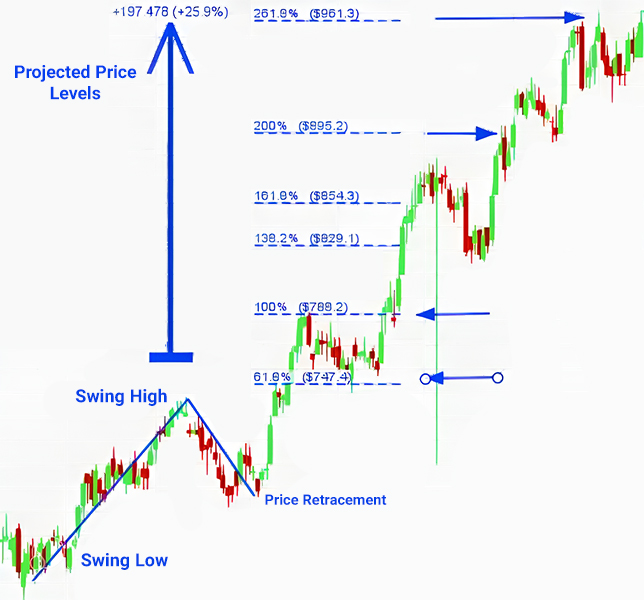
- On the chart, a Swing Low (price bottom) and a Swing High (price top) are first identified. After a price retracement, the Fibonacci Projection tool is applied, and key levels such as 100%, 161.8%, 200%, and 261.8% are plotted on the chart.
- Each time the price approaches these levels, traders can use Price Action signals such as reversal candlesticks, breakouts, or pullbacks to evaluate market reactions.
For example, if the price reaches the 161.8% level and forms a bearish reversal candle, it may suggest an exit from a long trade or even an opportunity to enter a short trade. Conversely, a decisive breakout above the 200% level, especially with high trading volume, can signal continuation of the uptrend toward the next target at 261.8%.
Applying Fibonacci Projection in complex corrective waves (such as double or triple zigzags) can often produce false signals in technical analysis and therefore requires confirmation from additional filters.
Trading with Fibonacci Projection and MACD: Confirming Key Price Levels
The chart also illustrates how Fibonacci Projection can be combined with the MACD indicator to enhance the accuracy and reliability of trading decisions.
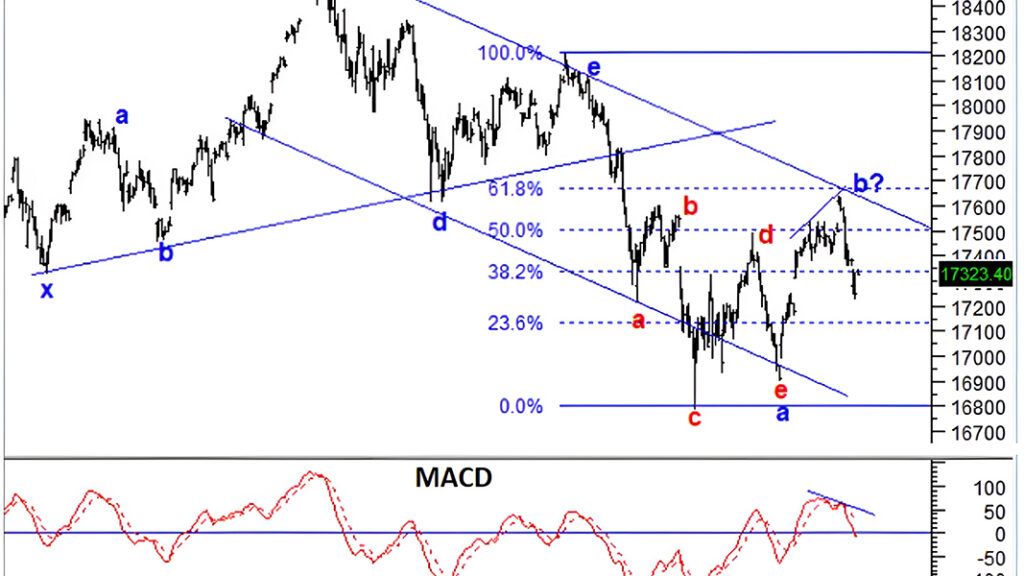
- First, the Fibonacci Projection levels are plotted on the chart.
- At the bottom, the MACD indicator is displayed, which uses two Exponential Moving Averages (EMA) to measure changes in market momentum.
- A trader can compare price action around Fibonacci levels with MACD signals—such as signal line crossovers, histogram shifts, or divergences—to identify more reliable entry and exit points.
For example:
If the price reaches the 61.8% Fibonacci level while the MACD shows a bearish divergence, it may serve as a warning of a potential decline and a good time to exit.
Conversely, if price finds support near the 38.2% Fibonacci level and MACD forms a bullish crossover, it could indicate the start of a strong upward move and provide a solid entry signal.
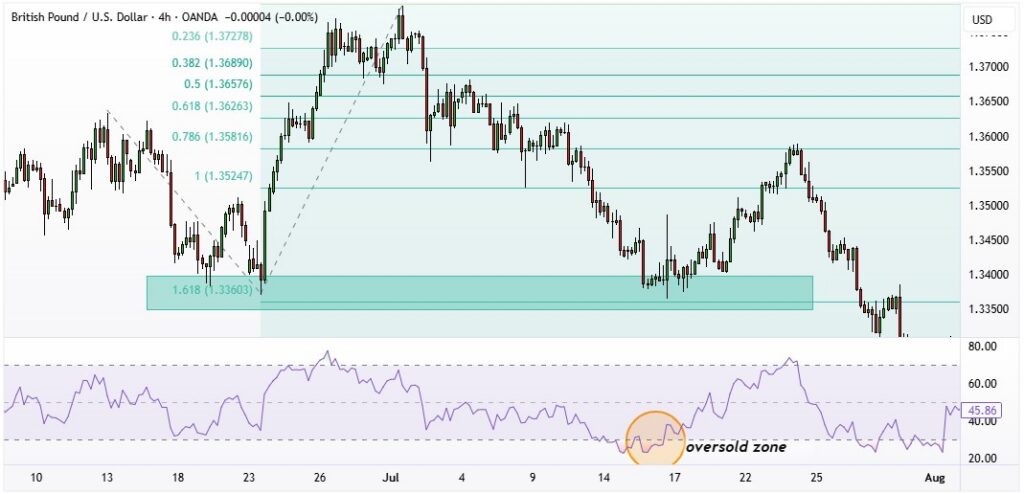
Fibonacci Projection and RSI: Confirming Key Price Levels
One powerful way to make more accurate trading decisions is by combining Fibonacci Projection with the RSI (Relative Strength Index) indicator.
Fibonacci Projection identifies potential price targets after a correction. These levels serve as potential checkpoints where the price may either continue its move or react.
RSI measures trend strength and highlights overbought or oversold conditions. When RSI is above 70, the market is considered overbought, signalling a potential pullback or reversal. When it falls below 30, the market is oversold, suggesting a higher chance of a rebound.
By combining these two tools, traders can seek confirmation before acting:
- If the price reaches the 161.8% Fibonacci Projection level while RSI is in the overbought zone, it may be a signal to exit a long trade or even consider a short entry.
- If the price is at the 100% or 161.8% Fibonacci projection level while the RSI is near the oversold zone, it could indicate the start of a new bullish move and present a good buying opportunity.
How Fibonacci Projection Enhances Cypher Harmonic Pattern Analysis
The Cypher pattern is one of the harmonic patterns in technical analysis, built on Fibonacci ratios. It consists of four main price legs: X-A, A-B, B-C, and C-D, and is widely used by traders to identify potential reversal points.
Fibonacci Projection plays a crucial role in this pattern, as it helps pinpoint the completion of the structure at point D.
- During the B-C leg, traders apply the Fibonacci Projection tool to measure the extension of this move.
- According to the rules of the Cypher pattern, point D typically falls within the 127.2% to 141.4% Fibonacci Projection of the B-C leg.
- When the price reaches this projection zone and is supported by reversal signals from Price Action, the likelihood of the Cypher pattern completing at point D increases significantly.
In other words, Fibonacci Projection acts as a guide in this pattern, helping traders determine precisely where to anticipate a market reversal and define precise entry and exit levels.
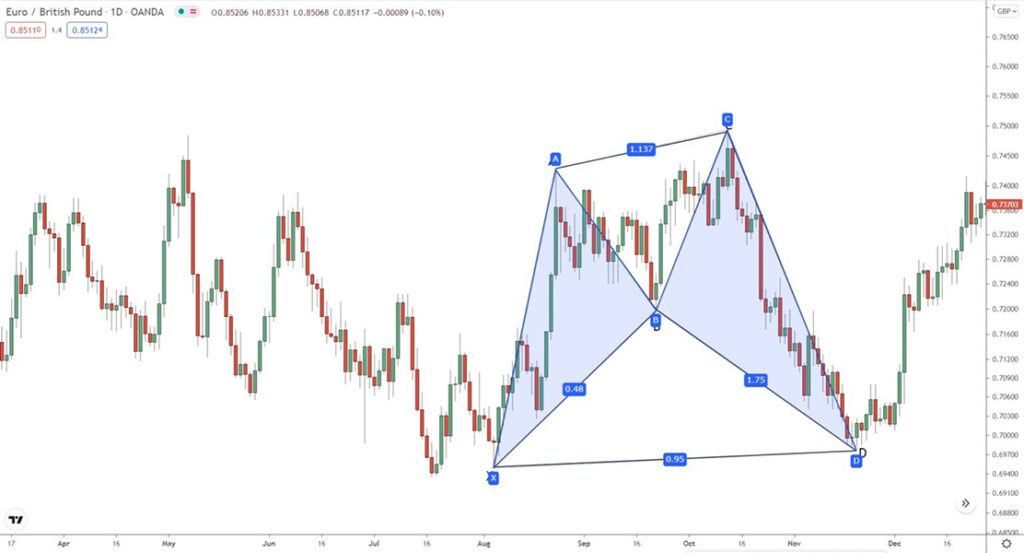
Therefore, combining the Cypher pattern with Fibonacci Projection allows traders to set their stop-loss and take-profit levels with greater precision, ultimately reducing trade risk.
For cyclic assets like gold and Bitcoin, applying Fibonacci Projection on the monthly chart can serve as a roadmap for long-term market behavior.
How Fibonacci Projection Enhances Accuracy in the Harmonic Shark Pattern
The Shark Pattern is another harmonic pattern built on Fibonacci ratios. Unlike the Cypher, it typically consists of five key points: X, A, B, C, and D. Traders use this structure to identify potential reversal zones in the market.
Here, Fibonacci Projection plays a central role in determining the completion zone of the pattern and the ideal entry point.
- During the B-C or X-A legs, the Fibonacci Projection tool is applied to measure the extensions of these moves.
- According to the rules of the Shark pattern, point D usually falls within the 113% to 161.8% Fibonacci Projection of the B-C leg, and often aligns with the 88.6% Fibonacci Retracement of the X-A leg.
When the price reaches this projection zone and reversal signals appear in Price Action or supporting indicators, the probability of the Shark pattern completing at point D becomes significantly higher.
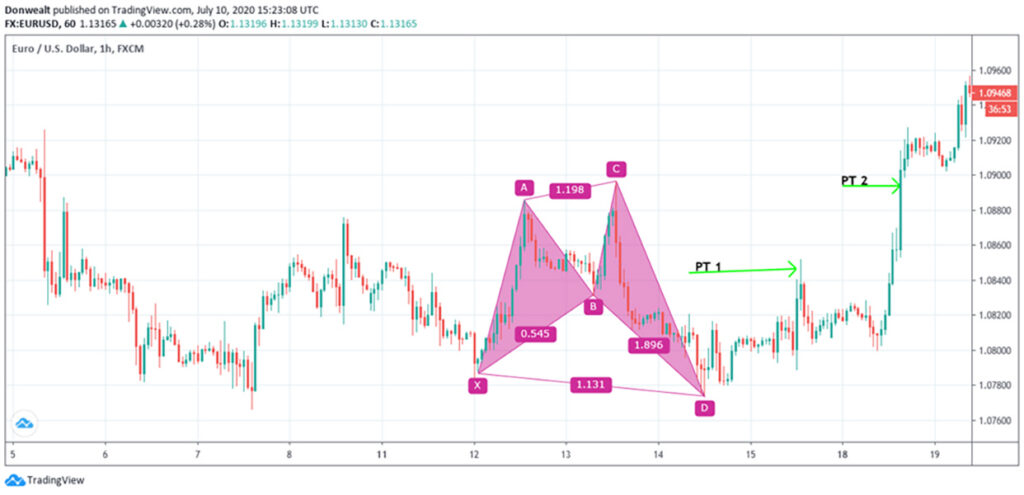
In the chart above, it is clear that after the formation of points X, A, B, and C, the price at point D was projected using Fibonacci Projection levels. Once the price reached this level, the market reversed direction and successfully achieved the predefined price targets (PT1 and PT2).
Common Mistakes Traders Make When Using Fibonacci Projection
Here are some of the most frequent mistakes traders make when applying Fibonacci Projection:
- Incorrect selection of Swing Points
One of the most significant errors is failing to identify the correct starting and ending points of the move. If points A, B, and C are misplaced, all projection levels will shift, leading to inaccurate price forecasts.
- Applying Fibonacci Projection in non-trending markets
This tool is designed for uptrends and downtrends. Using it in sideways or ranging markets often produces false signals.
- Relying solely on Fibonacci without confirmation
Some traders assume that projection levels are sufficient on their own, but they should always be confirmed with other tools, such as Price Action, RSI, or MACD, for higher reliability.
- Ignoring the appropriate timeframe
Projection levels on very short timeframes (like 5 or 15 minutes) can be unreliable. Analysing higher timeframes (4-hour or daily) provides more accurate insights into potential price targets.
- Lack of proper risk management
Many traders enter trades at levels like 161.8% or 261.8% without setting a stop-loss. No tool guarantees 100% accuracy, so applying sound risk management is essential.
Conclusion
Fibonacci Projection is one of the most practical tools in technical analysis for identifying price targets and potential reversal zones. It works best when combined with methods like Price Action, MACD, RSI, and harmonic patterns. Proper application, combined with disciplined risk management and precise swing point selection, enables traders to define entry and exit points with greater accuracy, thereby improving the profitability of their trades.
Sources: Kotaksecurities, Tradingfinder