When a price chart is moving upward, there are times when signs emerge suggesting that the bullish momentum may be losing strength. One of the most well-known signals is the Hanging Man Candlestick, which usually forms near market tops and warns traders that sellers are beginning to step in. Understanding this pattern, along with other candlestick reversal formations, helps traders gain a clearer view of market conditions and make more rational decisions. If you want to learn precisely what the Hanging Man pattern represents and how it can be applied in trading strategies, stay with us until the end of this article.
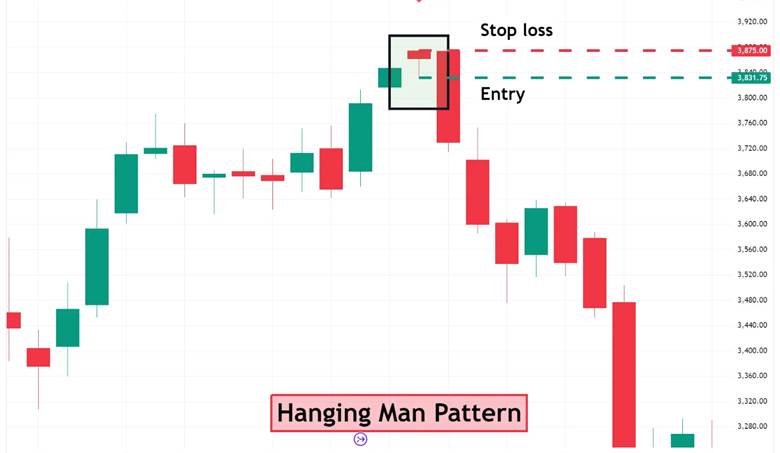
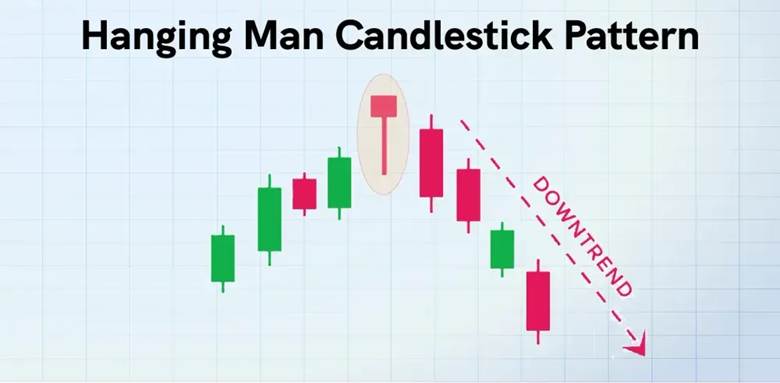
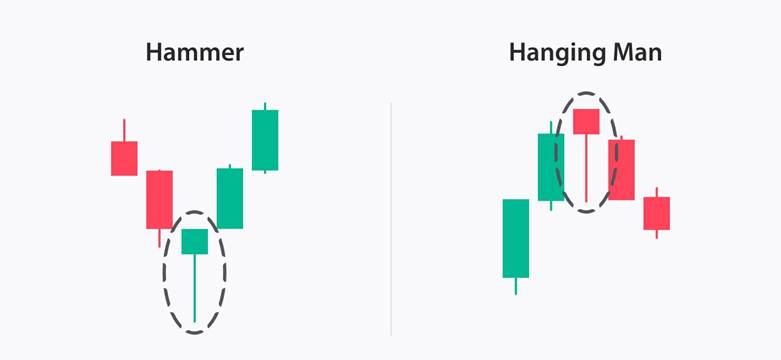
- The Hanging Man Candlestick is one of the most critical candlestick reversal patterns that often appears at the end of an uptrend and warns of a possible change in market direction.
- A long lower shadow at least two to three times the size of the real body shows intense selling pressure during that session, and the longer the shadow, the higher the chance of a bearish reversal.
- The placement of the pattern on the chart is critical, and it is considered valid only when it forms near significant price levels.
- Paying attention to the psychology behind the candlestick and understanding the behaviour of buyers and sellers is more valuable than focusing only on its visual appearance.
What is the Hanging Man Candlestick?
When the market is in an uptrend, a sudden sign may appear that warns of a possible reversal. One such signal is the Hanging Man Candlestick, which on the chart looks like a small-bodied candle with a long lower shadow.
The body is positioned near the top of the price range, while the lower shadow is typically at least twice the size of the body. At the top of the candle, there is either no upper shadow or it is tiny. This formation often suggests that buyers are losing momentum while sellers are beginning to gain strength.

When this candlestick forms at the end of an uptrend, it is viewed as a signal of weakening buying pressure and an increased chance of a bearish move. The color of the body also matters. If the closing price is lower than the opening price, resulting in a red or dark body, the bearish signal is considered stronger. Even if the body is green, the Hanging Man Candlestick can still be valid, but it requires further confirmation from the following candles.
This pattern is regarded as one of the most significant candlestick reversal patterns, helping traders better understand price action and potential shifts in momentum.
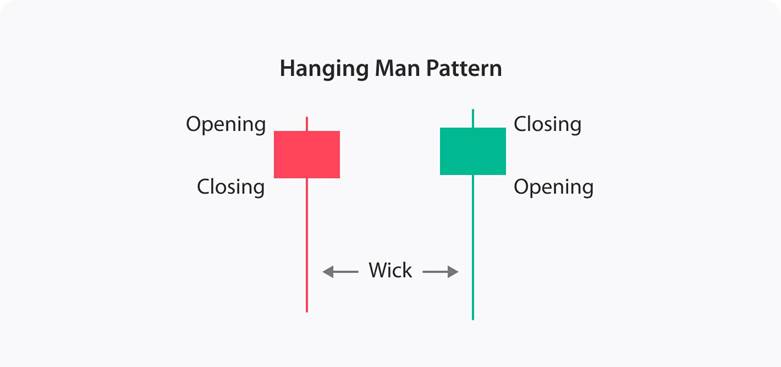
According to WRTrading, the color of the candlestick body has a direct impact on the reliability of the signal. A darker or red body usually indicates stronger selling pressure, but even a bullish body can still serve as a warning if it forms within the right market context.
Applications of the Hanging Man Candlestick in Technical Analysis
The Hanging Man Candlestick can be a valuable tool for identifying potential reversal points across various financial markets, including forex, stocks, and cryptocurrencies, especially when the price approaches a resistance level after a strong upward move. This pattern often suggests that buyers are losing control while sellers are gradually gaining influence.
Since no trading signal is foolproof, combining the Hanging Man with other technical analysis tools significantly improves its reliability. For instance, if indicators like the Relative Strength Index (RSI) indicate overbought conditions while a Hanging Man forms near resistance, the likelihood of a bearish reversal increases significantly. Moving averages, trendlines, or historical resistance zones can also serve as additional filters to confirm the validity of the setup.

In real chart examples, after a strong bullish run, the Hanging Man often appears with rising trading volume, indicating sellers stepping in. The price frequently struggles to break above resistance, and within a few subsequent candles, a downward move begins. For example, on a daily chart, when the pattern emerges at a resistance zone followed by a heavy bearish candle, it provides a clear reversal signal.
Trading volume itself is a critical factor. A Hanging Man formed with high volume shows strong seller participation, which enhances the pattern’s reliability. When it occurs near a historical resistance or supply area, the probability of a meaningful market reaction increases further.
For traders who apply price action strategies, the Hanging Man Candlestick can be a pivotal signal. By carefully examining price movement, market reactions to resistance, and volume dynamics, traders can decide whether to exit a position or enter a short trade. Using the pattern in combination with broader market context and confirmation tools helps minimize false signals and create better trading opportunities.
According to Liquidity-Provider, trading volume must be evaluated alongside the pattern. If the Hanging Man Candlestick forms with high volume, the likelihood of a genuine reversal increases, while low volume may cause the pattern to be dismissed easily.
Difference Between the Hanging Man and the Hammer Candlestick
The Hanging Man Candlestick and the Hammer Candlestick look very similar in structure. Both display a small real body with a long lower shadow, reflecting intense selling pressure during the session, followed by a partial recovery from buyers.
The key difference lies in the preceding trend. The Hanging Man forms after an uptrend and signals a potential bearish reversal. At the same time, the Hammer appears at the end of a downtrend and suggests the possibility of a bullish reversal.

The market context is crucial for interpreting these patterns. A Hanging Man near the high of an extended uptrend increases the chances of the price moving lower. Conversely, when a Hammer emerges after a decline and approaches a support zone, the probability of the price rising becomes higher.
Confirmation is essential for both patterns. Seeing a subsequent candlestick that supports the expected direction strengthens the signal. For the Hanging Man, a bearish candle following it adds credibility, while for the Hammer, a bullish candle provides the needed confirmation. Incorporating tools such as support and resistance levels, trading volume, RSI, or moving averages further reduces the risk of false signals and increases confidence in the analysis.
How to Trade Using the Hanging Man Candlestick
The Hanging Man is a vital reversal pattern, but it should never be used in isolation. To make reliable trading decisions, it must be confirmed by the following candle or supported with other tools such as indicators. Combining the Hanging Man with the RSI, moving averages, or trendlines helps refine the signal and reduce overall trading risk. Below, we break down how entry, exit, and risk management can be applied when trading this pattern.
Determining Entry and Exit Points with the Hanging Man Candlestick
For entry, traders usually wait for the next candle after the Hanging Man Candlestick to close bearishly, as this confirmation makes the signal more reliable. When this setup occurs near a resistance zone or a key psychological price level, the probability of a successful trade increases.
Exit points can be determined using major support levels, Fibonacci retracement tools, or even short-term price targets. In a simple example, if an asset rallies for several days, reaches a resistance area, and the Hanging Man pattern appears, a trader may enter a short position after the confirming bearish candle closes. The exit would then be placed at the nearest support level, aligning the trade with logical market structure.

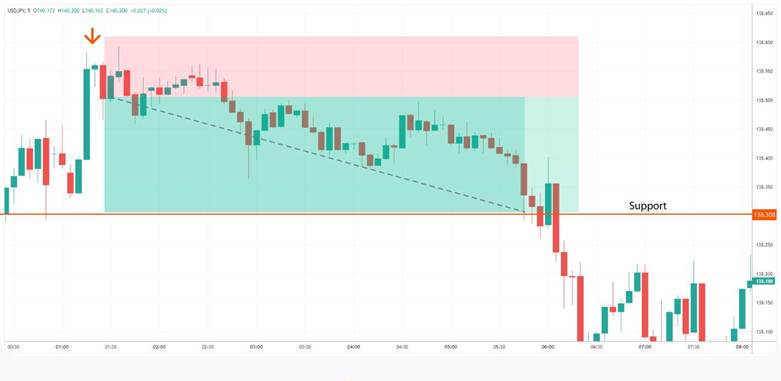
According to Corporate Finance Institute, the Hanging Man Candlestick is considered valid only when it forms during an uptrend and is confirmed by the following bearish candle.
Setting Stop Loss with the Hanging Man Candlestick
Risk management is essential in any trading strategy, and this also applies when using the Hanging Man Candlestick. A stop loss is typically placed slightly above the high of the Hanging Man, since a breakout above this level may signal that the bearish setup is invalid. The stop level should be chosen logically based on market volatility to avoid being stopped out prematurely.
Professional traders also consider the risk-to-reward ratio, often aiming for potential profits at least twice the amount of risk. To better understand position sizing, capital management, and how to effectively use stop-loss and take-profit levels, studying additional resources on risk management is strongly recommended.

Common Mistakes When Using the Hanging Man Candlestick
Using the Hanging Man Candlestick without proper confirmation can create misleading signals and costly trades. Here are the most common mistakes traders should avoid:
- Overreliance on the pattern
Using the Hanging Man by itself, without confirmation tools such as RSI or resistance levels, can result in false signals. Always combine it with other indicators.
- Misinterpreting the trend
This pattern is valid only at the end of an uptrend. If a Hanging Man appears in a sideways market or mid-trend, it is unlikely to provide a reliable bearish signal.
- Ignoring confirmation
Entering trades without waiting for the next bearish candle to confirm the setup is a significant mistake. Volume should also be considered, as higher volume amplifies the signal.
- Wrong timeframe selection
The Hanging Man and other candlestick reversal patterns are more reliable on higher timeframes, such as daily or weekly charts. On shorter timeframes, market noise often produces false signals.
- Skipping practice
Many traders fail to test this setup in a demo account. Practicing with simulated trades helps build confidence in recognising valid signals and prevents impulsive decisions in live markets.
Conclusion
The value of the Hanging Man Candlestick lies in identifying it within the proper market context. This formation suggests that a bullish trend may be nearing its end, making it one of the more practical signals among candlestick reversal patterns.
However, the Hanging Man is only truly practical when analysed in conjunction with complementary tools, such as a confirmation candle or trading volume. Traders who apply the pattern in suitable conditions and manage their risk properly are far more likely to make successful decisions. Focusing on continuous learning and practising in demo environments remains the best way to gain confidence and effectively utilise this candlestick in real trading situations.