


If you’re looking for a single indicator that can reveal market volatility, identify potential reversal points, and pinpoint precise entry and exit zones. Bollinger Bands are among the best tools available.
In this article, we’ll explore how Bollinger Bands work, how they distinguish trending and ranging phases, and what the Bollinger Bands trading strategy entails. You’ll also learn how to combine them with other indicators to build a professional, rule-based trading system for the forex and crypto markets.

- In Bollinger Bands–based trading strategies, traders can capitalize on both price reversals and band breakouts to identify high-probability entry points in the foreign exchange market.
- Combining Bollinger Bands with indicators such as RSI or MACD helps filter out false signals, allowing traders to enter trades in the direction of the prevailing trend and only in valid overbought or oversold zones.
- Since Bollinger Bands are a lagging indicator and can occasionally produce false signals, they should always be used in conjunction with price action analysis and sound risk management principles.
What Are Bollinger Bands and How Do They Work in Technical Analysis?
According to Investopedia, Bollinger Bands are one of the most widely used and trusted indicators in technical analysis. Developed by John Bollinger in the 1980s, this tool enables traders to measure market volatility and identify overbought or oversold conditions, thereby allowing for more precise entry and exit points in trades.
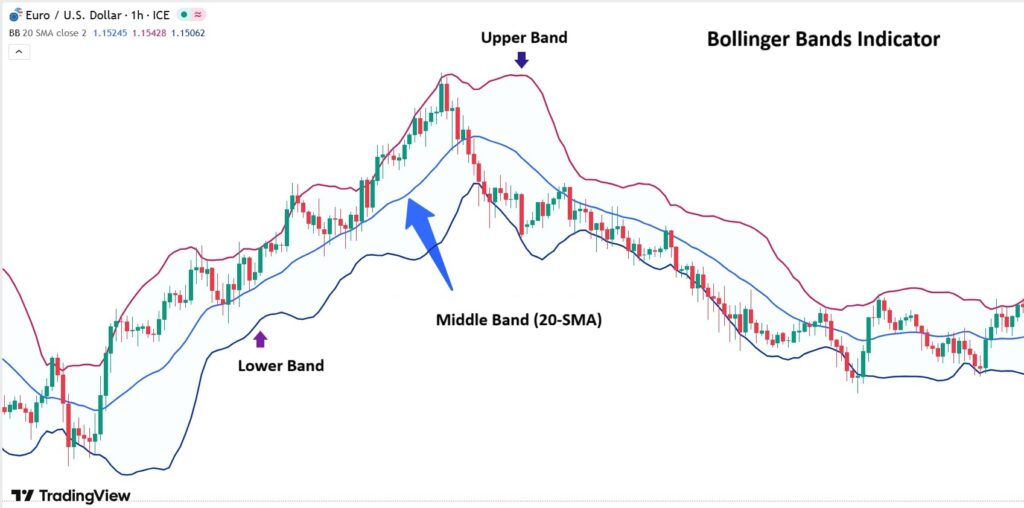
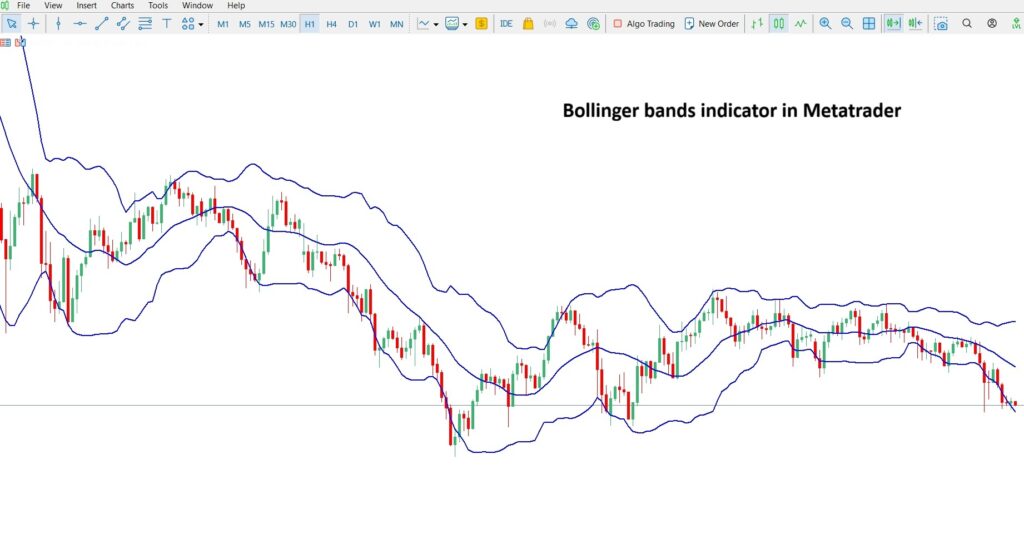
The Bollinger Bands indicator consists of three lines that move with price action:
- Middle Band: A 20-period simple moving average (SMA) that represents the overall direction of the price.
- Upper Band: Calculated by adding twice the standard deviation to the moving average, often acting as a resistance level.
- Lower Band: Calculated by subtracting twice the standard deviation from the moving average, typically serving as a support level.

An increase in the distance between the Bollinger Bands indicates a rise in market volatility, while narrowing bands suggest a period of reduced volatility or price consolidation in the market.
In addition to measuring market volatility and identifying overbought and oversold conditions, Bollinger Bands have several other powerful applications in technical analysis. These include trend analysis, setting price targets, detecting potential reversals, identifying breakout points, and serving as a confirmation tool for signals generated by other indicators such as MACD and RSI.
How to Analyze Charts Using Bollinger Bands
The Bollinger Bands indicator is a dynamic, multi-functional tool that helps traders analyze price behavior from multiple perspectives. Below are three key methods for interpreting charts using Bollinger Bands:
- Identifying trending and ranging phases;
- Interpreting price reactions to the bands;
- Detecting overbought and oversold zones.
Identifying Trending and Ranging Phases in Bollinger Bands
One of the primary uses of Bollinger Bands is to differentiate between trending and ranging market phases:
Trending Phase:
This occurs when the price consistently moves near the upper band (in an uptrend) or near the lower band (in a downtrend). During this phase, the bands expand, and the middle band (the moving average) takes on a clear directional slope.
In trending conditions, the upper band acts as dynamic resistance, while the lower band serves as dynamic support.
Ranging (Sideways) Phase:
When the market lacks a clear direction and moves within a horizontal range, the Bollinger Bands become flat and parallel to each other. In this scenario, the price fluctuates between the upper and lower bands, while the middle band (SMA) acts as a mean reversion line, a central area to which the price tends to return.
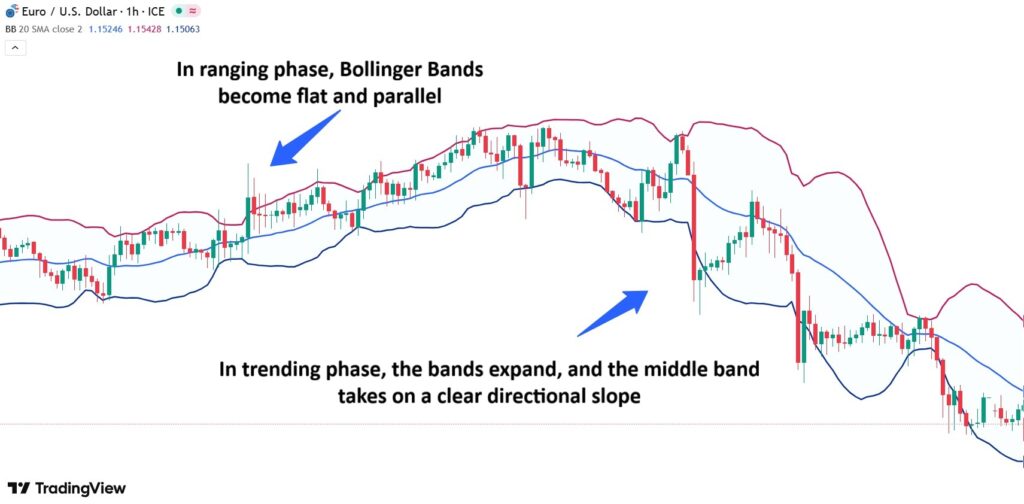
In the Bollinger Bands indicator, a sloping middle band indicates a trending market, while the width of the bands reflects the level of market volatility; the wider the bands, the higher the volatility.
How to Interpret Price Interaction with Bollinger Bands
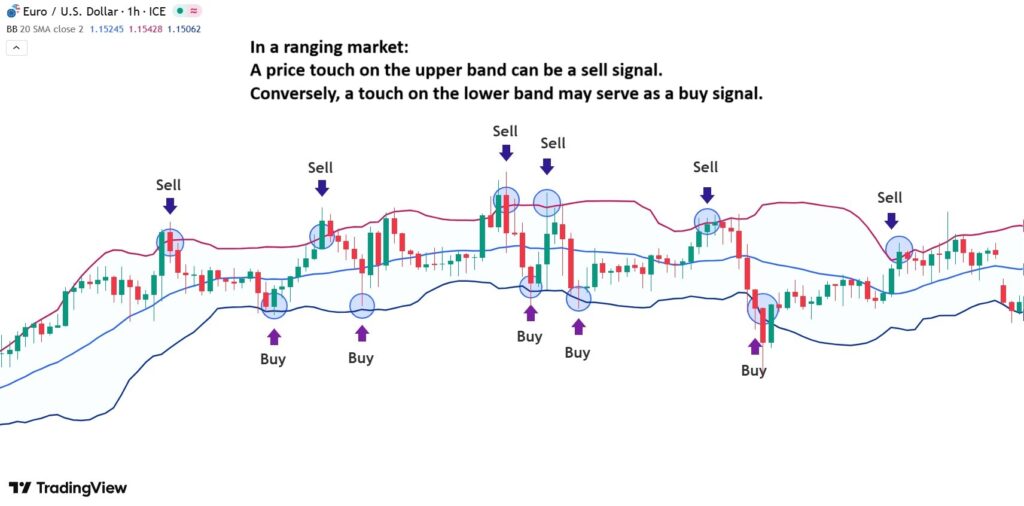
A common mistake among novice traders is assuming that a price touch on the upper band automatically signals a sell, while contact with the lower band signals a buy. This interpretation, without considering the broader market context or whether the market is in a range or a trend, can lead to significant losses.
To avoid this, traders should interpret price reactions to Bollinger Bands with market conditions in mind, fostering a cautious and mindful approach to trading.
- In a ranging market, A price touch on the upper band can indicate a potential selling opportunity, as prices are likely to revert toward the middle band and possibly the lower band. Conversely, a touch on the lower band may serve as a buy signal.
This approach is based on the principle of the ‘mean reversion strategy’.
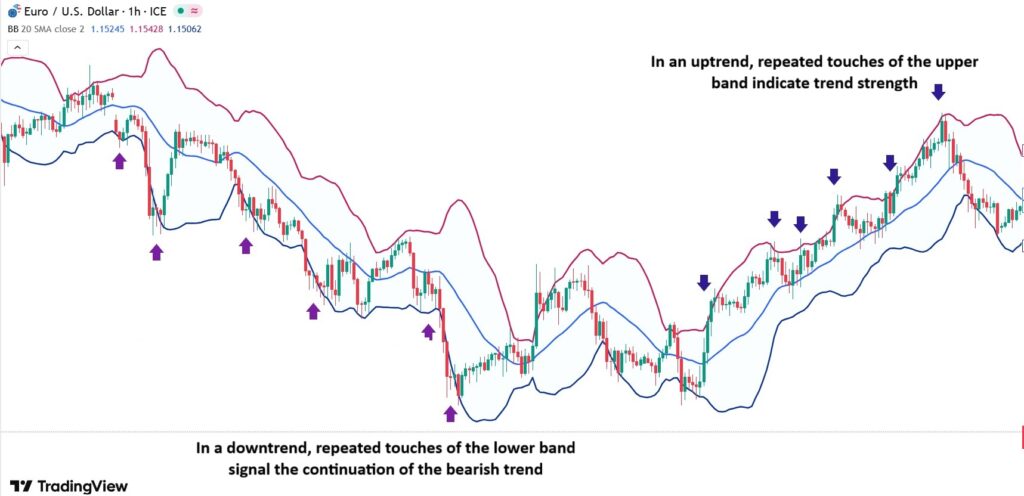
- In a trending market:
During a strong uptrend, repeated touches of the upper Bollinger Band are not sell signals; rather, they indicate strength and momentum behind the move. These repeated contacts confirm the continuation of the bullish trend. Likewise, in a strong downtrend, frequent touches of the lower band reflect intense selling pressure and reinforce the likelihood of a sustained bearish move.
Identifying Overbought and Oversold Zones with Bollinger Bands
One of the key uses of the Bollinger Bands indicator is to identify overbought and oversold conditions, helping traders time their entries and exits more effectively.
According to Skrill, the method for spotting these zones using Bollinger Bands is as follows:
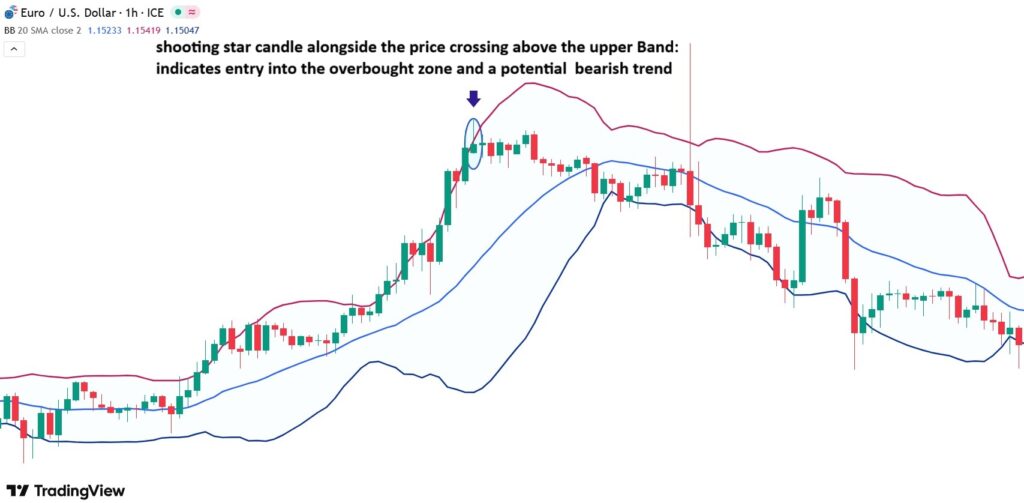
- Overbought: When the price moves near or above the upper band, especially if it’s accompanied by waning momentum and a decline in trading volume, it may signal that the market is in an overbought condition, suggesting a potential sell opportunity.
- Oversold: When the price approaches or dips below the lower Bollinger Band, it indicates that the market may be in an oversold state. This zone can present a potential buying opportunity, especially if reversal patterns such as a pin bar or bullish engulfing form form around the same area.
Bollinger Bands Trading Strategies in Forex
The Bollinger Bands indicator is a highly practical tool that can serve as the foundation for several effective trading strategies. Below, we’ll explore three of the most practical and widely used approaches.
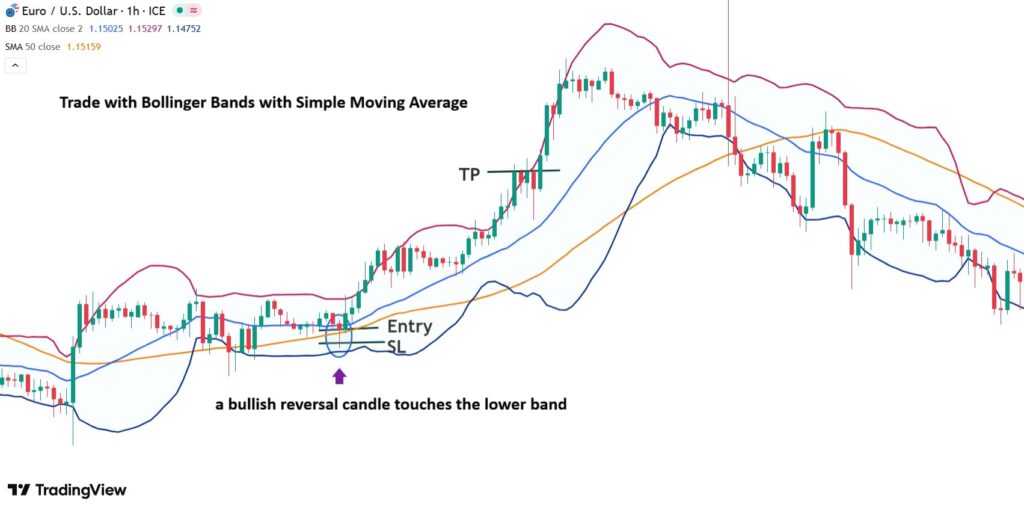
Price Reversal Strategy (Bounce from the Bands)
One of the simplest yet most effective ways to utilize Bollinger Bands is through the price reversal strategy.
This method is based on the assumption that when the price touches the upper or lower band, there’s a strong likelihood it will revert toward the middle of the range.
Here’s how it works:
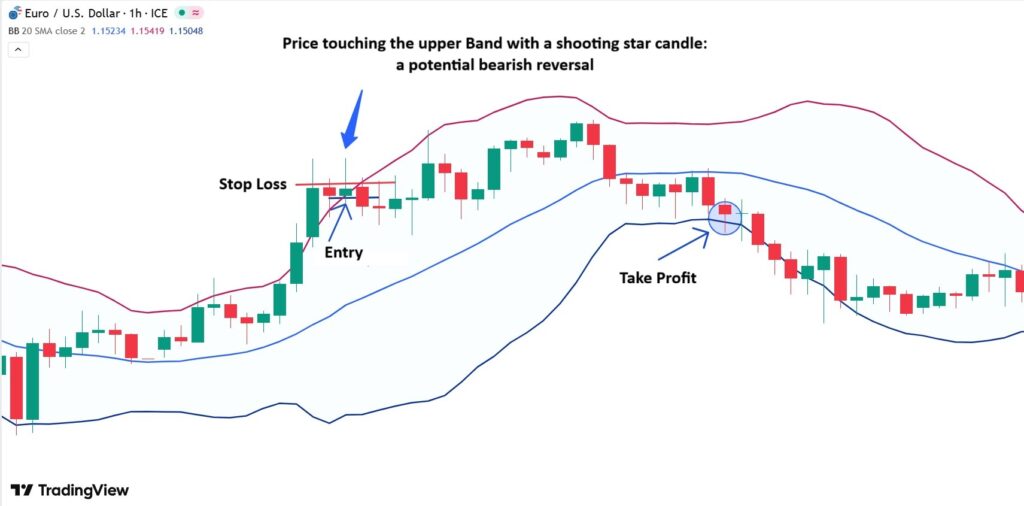
- When the price reaches the upper band and signs of trend exhaustion appear (such as a Doji or a bearish engulfing candlestick), a downward reversal may be forming.
- Enter a short position;
- Place the stop-loss slightly above the reversal candle;
- Set the take-profit target near the opposite band (the lower Bollinger Band).
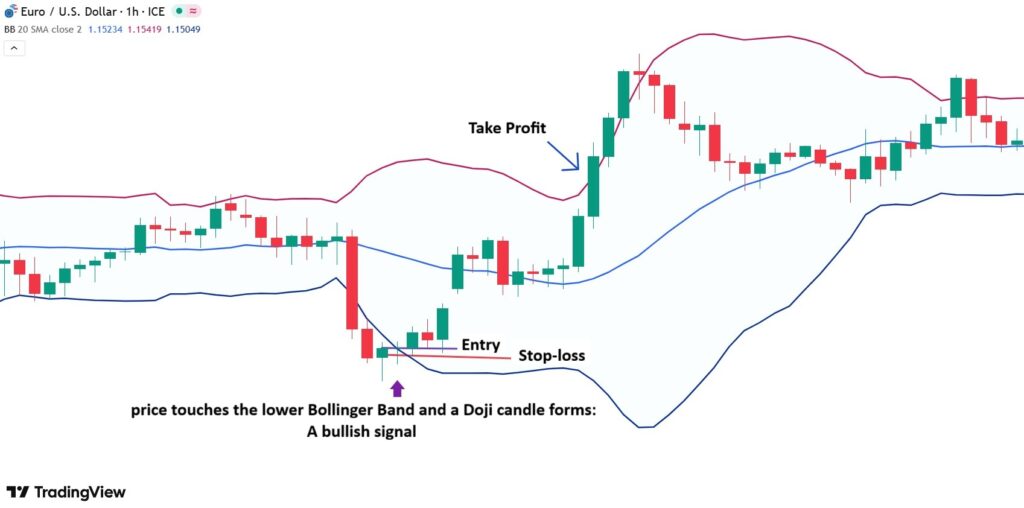
When the price touches the lower Bollinger Band and a bullish reversal candlestick (such as a hammer candlestick or bullish engulfing pattern) forms, an upward move can be anticipated. In this case:
- Enter a buy (long) position;
- Place the stop-loss slightly below the reversal candle;
- Set the take-profit target near the upper Bollinger Band.
Bollinger Band Breakout Strategy
The breakout strategy using Bollinger Bands is based on one of the market’s most fundamental behaviors: periods of low volatility are often followed by strong and explosive price movements.
In other words, when the Bollinger Bands contract and move closer together, it usually signals an upcoming breakout beyond one of the bands.
According to BabyPips, here’s how the Bollinger Band breakout strategy is executed:
- During a band squeeze, wait for the price to break out above the upper band or below the lower band.
- The closing of a full candle outside the band serves as an initial confirmation of a new trend forming.
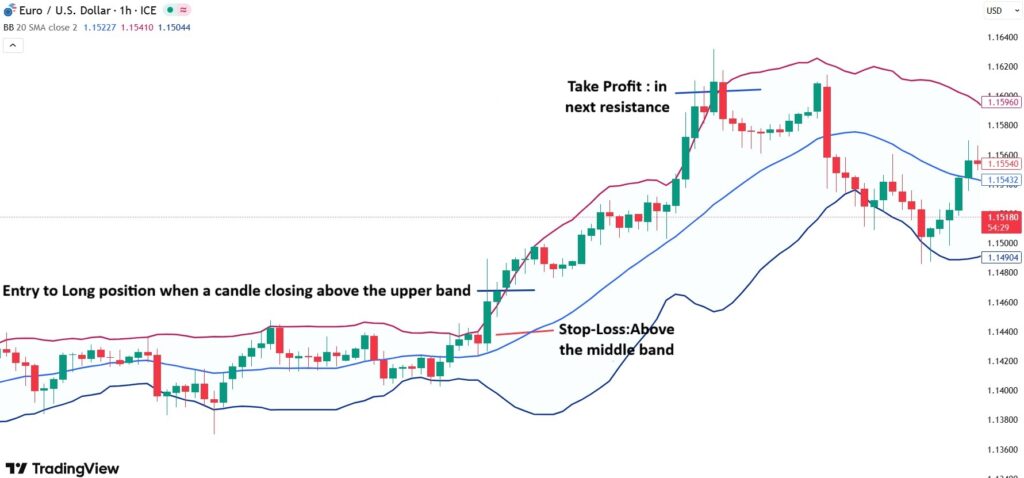
- A candle closing above the upper band indicates the beginning of a bullish trend.
In this case:
- Enter a long position;
- Place the stop-loss inside the band, slightly above the middle band (the moving average);
- Set the take-profit target equal to the bandwidth or near the next resistance level.
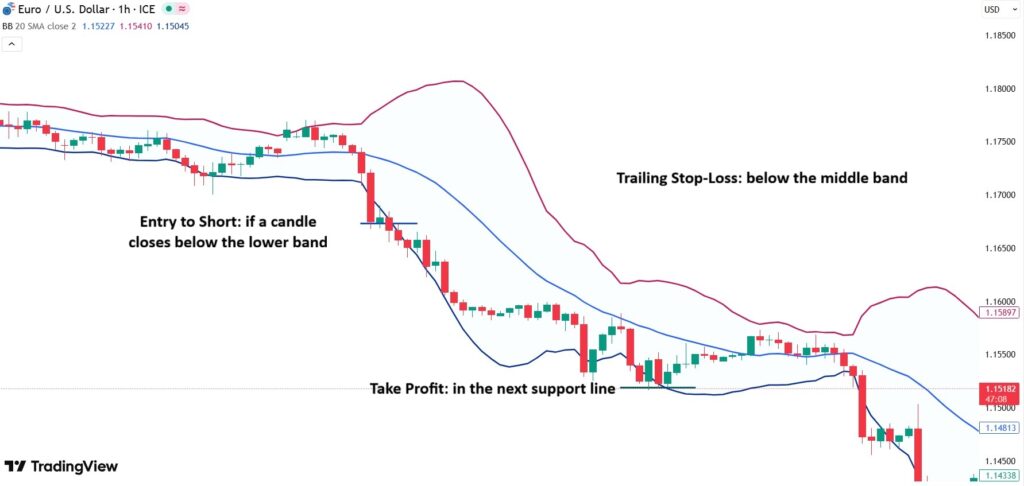
A candle closing below the lower Bollinger Band indicates the beginning of a bearish trend.
In this case:
- Enter a short position;
- Place the stop-loss inside the band, slightly below the middle band. You can also use the middle band as a trailing stop to lock in profits as the trend continues;
- Set the take-profit target equal to the bandwidth or at the next support level.
Short-Term Scalping Strategy Using Band Contraction and Expansion
This strategy is ideal for scalpers and day traders who aim to profit from quick, short-term price movements. To implement the short-term Bollinger Band contraction–expansion strategy, follow these steps:
- During a band squeeze, wait for signs of expansion that indicate increasing volatility;
- Entry: Once the price breaks above or below the middle band (moving average), enter a trade in the direction of the breakout;
- Exit: Close the trade near the opposite band or when the bands begin to flatten, signaling reduced momentum;
- Stop-loss: Place the stop-loss slightly below the moving average for long positions, or above it for short positions.
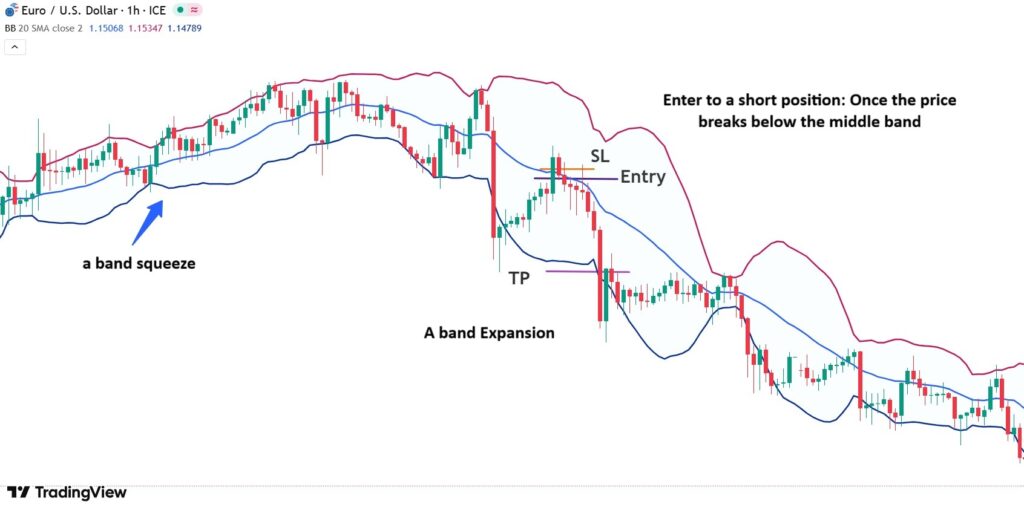
The Bollinger Band scalping strategy is most effective on lower timeframes (M15–M30), but it should be filtered using volume or ATR to avoid early entries.
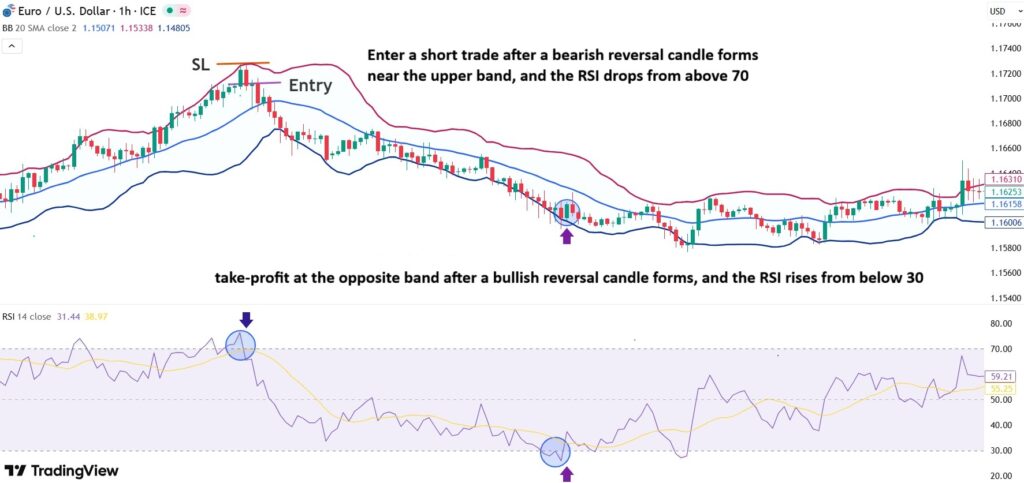
Combining Bollinger Bands with RSI to Filter Entry Signals
One of the main limitations of the Bollinger Bands indicator is its tendency to produce false reversal signals in volatile or ranging markets. To improve accuracy, traders often combine it with the Relative Strength Index (RSI), a reliable momentum oscillator used to measure price strength and identify overbought and oversold conditions.
Here’s how to combine these two indicators effectively:
- Use Bollinger Bands to identify when the price touches or moves outside the upper or lower bands.
- Check the RSI reading:
- If the price touches the lower band and the RSI is below 30, it suggests a strong chance of a bullish reversal.
- If the price is near the upper band while the RSI is above 70, it indicates a potential bearish correction.
Now, define your entry, exit, and risk management rules as follows:
- Buy Entry: Enter a long trade after a bullish reversal candle closes near the lower band and the RSI rises from below 30.
- Sell Entry: Enter a short trade after a bearish reversal candle forms near the upper band and the RSI drops from above 70.
- Stop-Loss: Place the stop-loss slightly below the reversal candle (for buys) or above it (for sells).
- Take-Profit: Set the take-profit target at the middle band or the opposite band, depending on the trend’s strength.
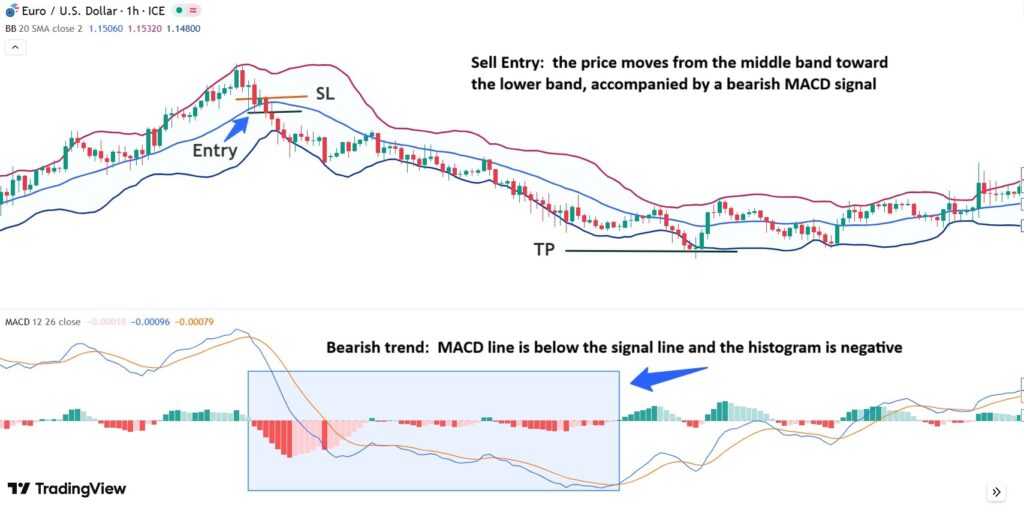
Combining Bollinger Bands with MACD to Confirm Trend Direction
The MACD indicator is one of the most effective tools for confirming trend direction and reducing false signals generated by the Bollinger Bands. By combining both indicators, traders can filter out weak reversal setups and focus only on trades that align with the dominant market trend.
Here’s how to use them together effectively:
- Use Bollinger Bands to identify the price position relative to the upper, middle, or lower bands.
- Use MACD to confirm the trend direction:
- When the MACD line is above the signal line and the histogram is positive, it confirms a bullish trend.
- When the MACD line is below the signal line and the histogram is negative, it confirms a bearish trend.
Once the trend direction is confirmed, define your entry, exit, and risk management as follows:
- Buy Entry: Enter a long trade when the price moves from the middle band toward the upper band, and the MACD gives a bullish crossover signal.
- Sell Entry: Enter a short trade when the price moves from the middle band toward the lower band, accompanied by a bearish MACD signal.
- Stop-Loss: Place the stop-loss on the opposite side of the middle band or just beyond the most recent confirmation candle.
- Take-Profit: Set the take-profit target equal to the distance between the bands or near the next support or resistance level.
Combining Bollinger Bands with Moving Averages to Identify Strong Entry Points
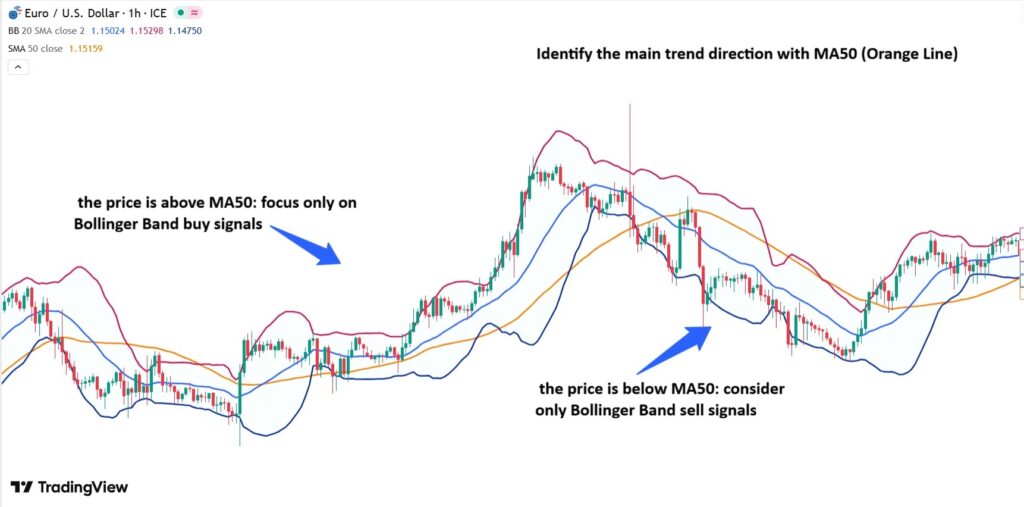
Combining Bollinger Bands with moving averages is one of the most effective and professional methods for spotting high-probability entry points in the direction of the dominant trend. Since Bollinger Bands are already centered around the 20-period moving average, adding longer-term averages, such as the 50-day (MA50) or 200-day moving average (MA200), can help confirm the market’s overall trend and improve trade accuracy.
Here’s how to apply this strategy effectively:
- Identify the main trend direction using long-term moving averages (MA50 or MA200).
- Trade only in the direction of the main trend.
- If the price is above MA50 or MA200, focus only on Bollinger Band buy signals.
- If the price is below MA50 or MA200, consider only Bollinger Band sell signals.
Determining Entry, Exit, and Risk Management Levels:
- Buy Entry: If the price is above the MA50, touches the lower Bollinger Band, and a bullish reversal candle forms, enter a long position.
- Sell Entry: If the price is below the MA50, reaches the upper Bollinger Band, and a bearish confirmation candle appears, enter a short position.
- Stop-Loss: Depending on the trade direction, place the stop-loss slightly below or above the reversal candle.
- Take-Profit: Set the take-profit target at the opposite band or just before the next key support or resistance level.
Advantages and Limitations of the Bollinger Bands Indicator in Forex
The Bollinger Bands indicator is one of the most popular analytical tools in the Forex market. Like any technical indicator, it comes with its own strengths and weaknesses. According to insights from the Corporate Finance Institute, here’s an overview of the key advantages and limitations of using Bollinger Bands.
Advantages of the Bollinger Bands Indicator
Advantages of the Bollinger Bands Indicator include:
- Identifies Market Volatility:
Bollinger Bands expand and contract in response to price fluctuations, clearly indicating periods of high and low volatility in the market. - Dynamic Support and Resistance:
The upper and lower bands act as dynamic support and resistance levels, adapting to real-time price movements. - Versatile Across Markets:
Bollinger Bands are effective in any market, from Forex and stocks to cryptocurrencies, and perform well across all timeframes. - High Compatibility:
When combined with other indicators, such as RSI, MACD, or moving averages, Bollinger Bands help enhance signal accuracy and reduce false entries. - Applicable to Multiple Strategies:
This indicator can be integrated into various trading strategies, including trend-following, reversal, and scalping approaches, making it suitable for traders with different styles and objectives.
Limitations of the Bollinger Bands Indicator
Disadvantages of the Bollinger Bands Indicator include:
- False Signals:
In highly volatile markets, a price touching or breaching the bands does not necessarily indicate a reversal, which can lead to false entry signals. - Lagging Nature:
Since Bollinger Bands are derived from moving averages, they tend to react with a delay to sudden price changes—making them a lagging indicator rather than a predictive one. - Dependency on Settings:
The default parameters of Bollinger Bands may not be suitable for all assets or trading strategies. Traders are encouraged to adjust the period and deviation settings to fit their market conditions and personal style.
How to Install and Activate the Bollinger Bands Indicator on MetaTrader and TradingView
To install and activate the Bollinger Bands indicator in MetaTrader and TradingView, follow the steps below:
Installing Bollinger Bands on TradingView:
- Open your price chart.
- Click on the “Indicators” tab from the toolbar at the top of the chart.
- Type “Bollinger Bands” in the search bar and click on the indicator to add it to your chart.
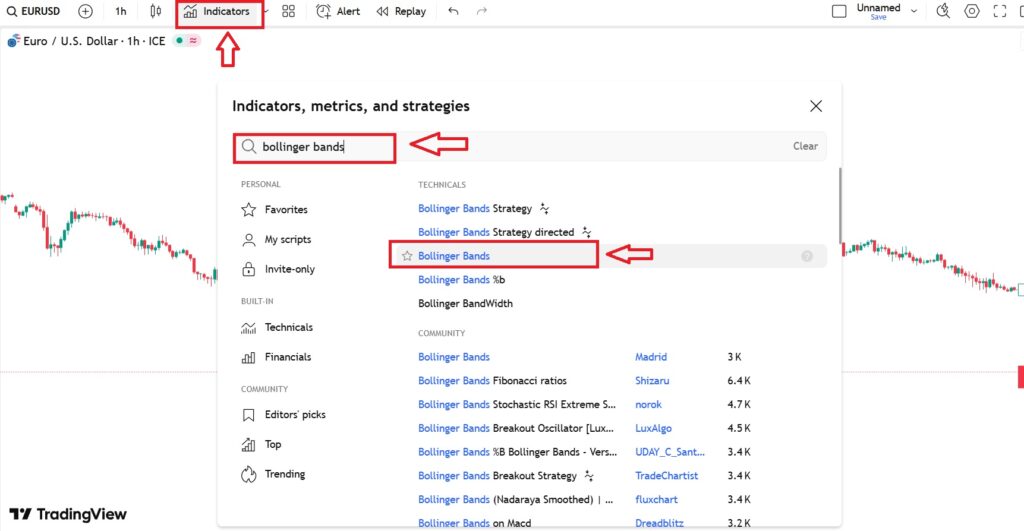
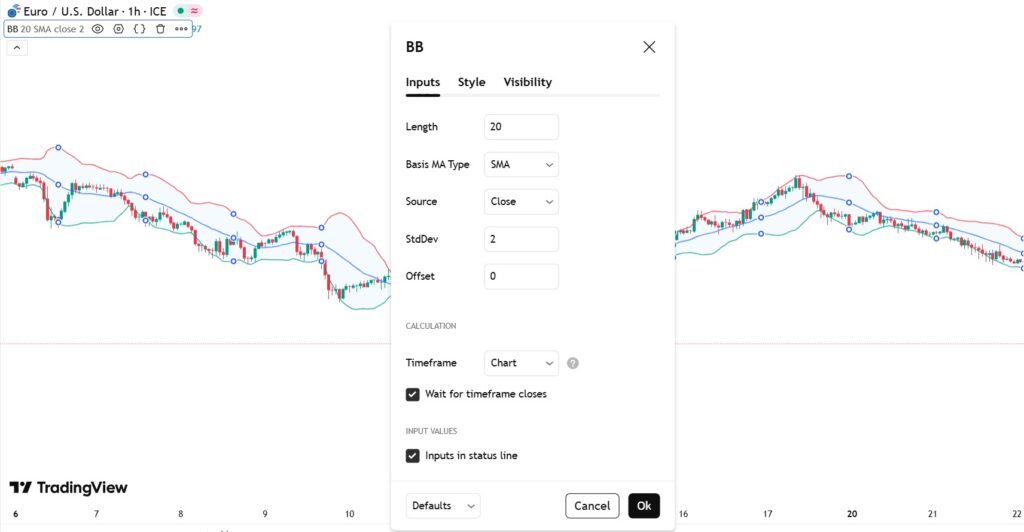
- right-click on the indicator and select “Settings.” This will open the configuration window where you can adjust the indicator’s parameters to match your trading strategy.
Installing the Bollinger Bands in MetaTrader
- Open your price chart in MetaTrader.
- Go to the “Insert” tab located on the top toolbar.
- From the menu, navigate to Indicators → Trend → Bollinger Bands, and click to add the indicator to your chart.
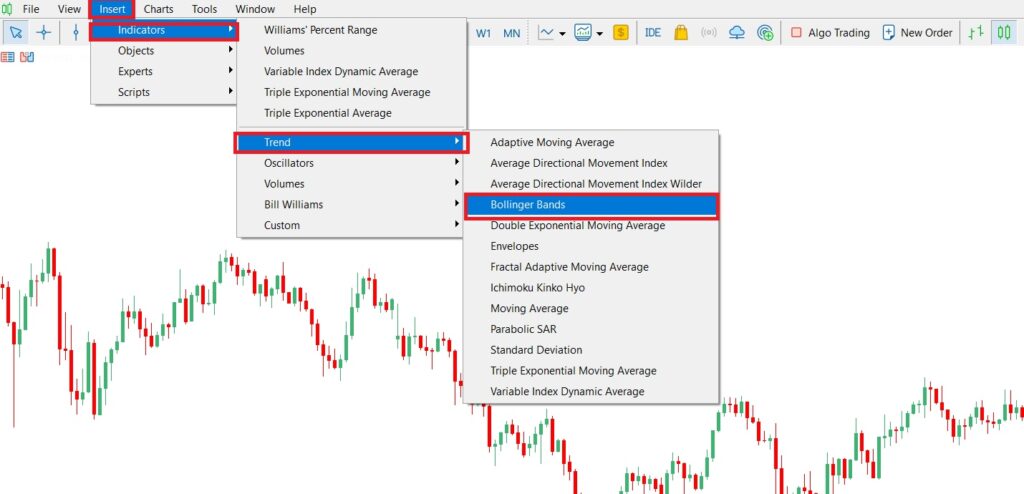
- Click on the Bollinger Bands name to open the settings window.
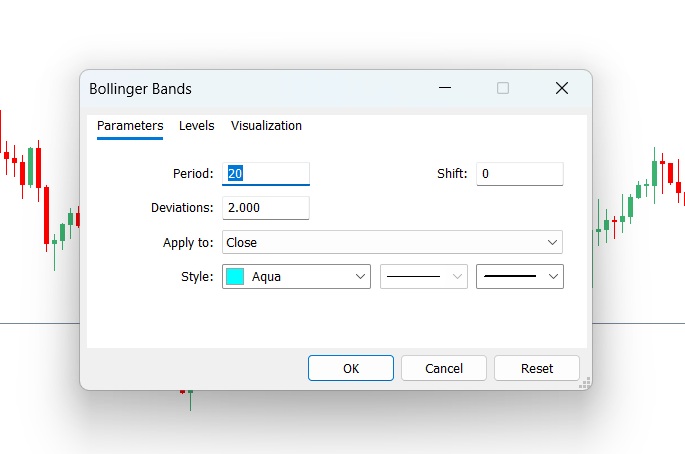
- After making your desired adjustments, click OK to apply the changes and add the indicator to your price chart.
Conclusion
Bollinger Bands are far more than a simple indicator on a chart — they offer a complete framework for understanding market volatility, identifying trending and ranging phases, and building a solid Bollinger Band strategy in forex. However, relying on this tool alone can be risky. The smart approach is to combine it with complementary indicators, such as RSI, MACD, and moving averages, along with strong risk management principles. This intelligent combination is what bridges the gap between an average trader and a professional one.


