Many traders use the MACD indicator on TradingView to better understand market momentum and trends, as this tool clearly highlights price direction changes through the combination of moving averages. In fact, the MACD indicator on TradingView helps you identify entry and exit points more accurately, allowing you to conduct your analysis with greater confidence. In this article, we will explore, in simple terms, how to use, configure, and apply the different versions of this indicator so you can incorporate it professionally into your analysis. If you’re looking to gain a deeper understanding of market behavior, stay with us until the end of the article to discover all the features of this powerful tool.
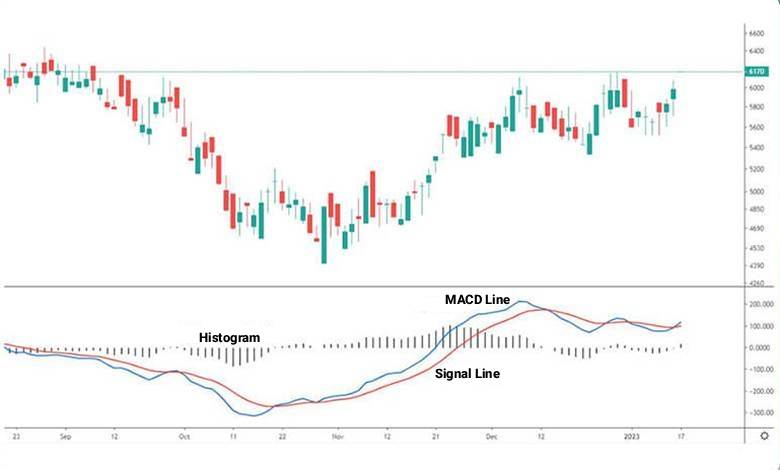
- The MACD indicator is one of the most accurate tools for measuring momentum and trend changes, and a proper understanding of it can form the foundation of many analytical strategies.
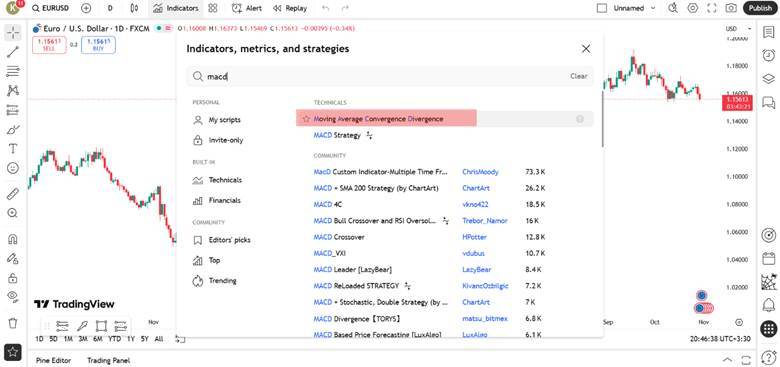
- TradingView, with its customization options, alerts, and various MACD versions, provides a more powerful environment for technical analysis compared to other platforms.
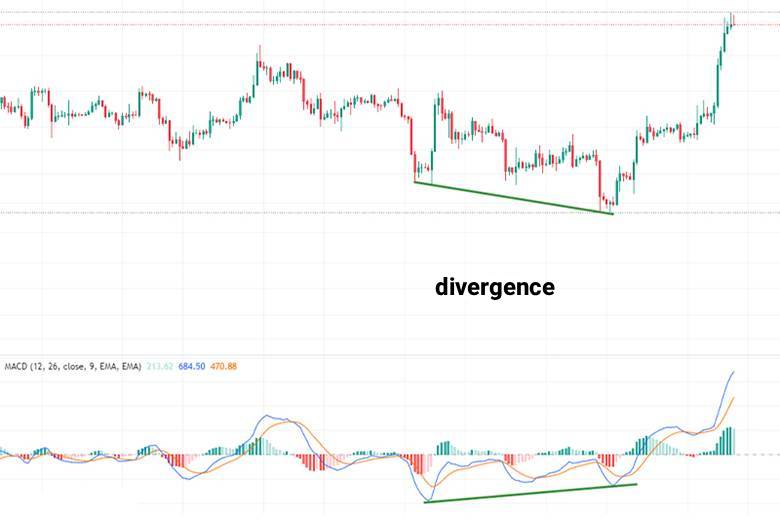
- Combining MACD with tools like divergence, price action, and complementary indicators transforms market analysis from a purely signal-based approach to a more multi-dimensional one.
- Success in using MACD depends on practice, testing in demo accounts, and adjusting settings to the market type, rather than simply memorizing formulas or following ready-made signals.
What is the MACD Indicator and What Role Does It Play in Technical Analysis?
The MACD indicator, which stands for Moving Average Convergence Divergence, is one of the most popular technical analysis tools for identifying momentum and trend direction. This indicator consists of three main components:
- The MACD Line, which represents the difference between two exponential moving averages (EMAs) with periods of 12 and 26.
- The Signal Line, which is the 9-period EMA of the MACD Line and helps in identifying entry and exit points.
- The Histogram, which displays the difference between the MACD and Signal Lines in the form of bars. The histogram essentially indicates whether the strength of the trend is increasing or decreasing.
When the MACD line crosses above the Signal line, it is generally a signal of a potential trend reversal. Similarly, crossing the zero line can indicate the beginning of a fresh upward or downward movement. According to various studies on TradingView, about 70% of the signals from this indicator are considered valid in strong trends. On this platform, the MACD indicator allows users to observe these changes with high precision, helping them make better trading decisions.
One of the key applications of the MACD indicator on TradingView is identifying a phenomenon known as divergence. For example, when the price is forming lower lows but the MACD is making higher lows, this could indicate a potential trend reversal. This is called positive divergence, and it can serve as a warning of an end to a downtrend.
This feature has made the MACD a popular tool among analysts for early detection of market changes. Ultimately, when used alongside other technical tools, the MACD provides a clearer picture of the trend’s strength and direction.
How to Activate the MACD Indicator on the TradingView Platform
To activate the MACD indicator on the TradingView platform, simply log in to your account and open the chart of your choice. At the top of the page, select the “Indicators” option to open the tools window. In the search bar, type “MACD” and select the “Moving Average Convergence Divergence” option. The indicator will automatically appear at the bottom of the chart, and you’ll be able to see the MACD line, Signal line, and Histogram.
At this point, if you click on the settings icon, you’ll be able to adjust the periods and colors based on your analytical style. One of the attractive features of TradingView is that even with the free version, you can use multiple indicators simultaneously and save your custom settings. This simplicity and the wide range of features have led many users to introduce this tool as the first option for trend analysis in TradingView tutorials.
Once the MACD indicator is activated on TradingView, you can use it on any asset, such as stocks, cryptocurrencies, or currency pairs. For example, on the EUR/USD chart, you can clearly observe momentum changes and crossover signals with the help of the MACD. This simple process takes just a few seconds but provides you with a deeper insight into the market’s status.
MACD Indicator Settings on TradingView
When using the MACD indicator on TradingView, it’s important to first familiarize yourself with its default settings. These settings typically consist of three key numbers: 12 for the fast moving average, 26 for the slow moving average, and 9 for the Signal line. This combination is effective in most markets as it strikes a good balance between sensitivity and accuracy. However, short-term traders sometimes opt for faster settings, such as 5, 13, and 1, to make the indicator respond more quickly to price changes.
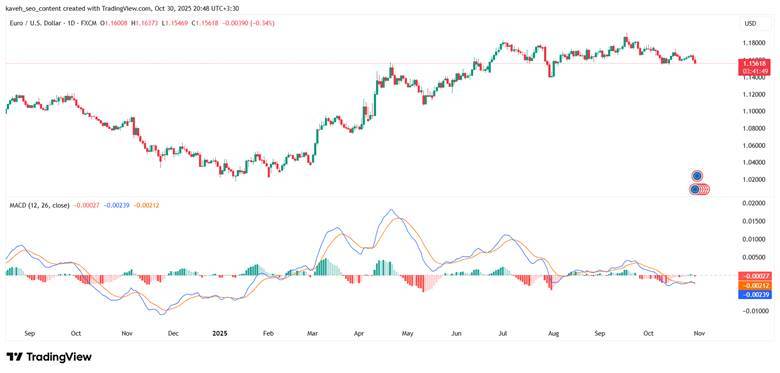
In long-term trading, it is common to either maintain the default settings or even increase the periods (e.g., 24/52/18) to reduce noise.
In the settings section, you can use the gear icon to customize the appearance of the MACD. This area allows you to change colors, line thickness, and toggle the visibility of the histogram. For example, some analysts choose contrasting colors for the positive and negative sections of the histogram to make the trend strength more visible. The right color scheme for the MACD indicator on TradingView helps make signal detection easier and more accurate.
Although changing the settings may be tempting at first, it’s important to avoid over-optimization. Sometimes traders select settings based solely on past data, which might not perform well in real-time market conditions. It’s recommended to test any changes in a demo account or through backtesting to ensure the MACD’s performance aligns with your trading style.
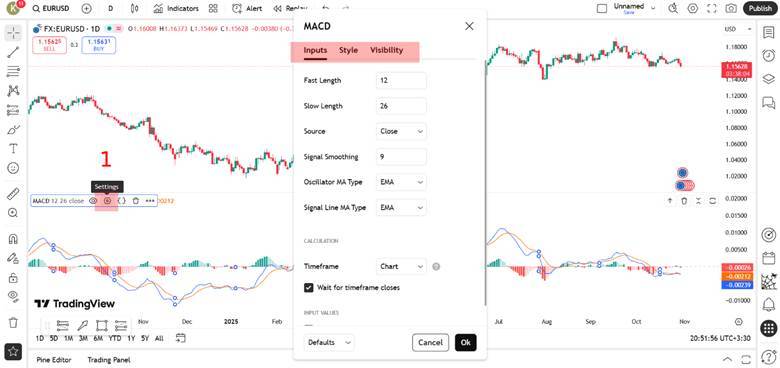
Excessive changes to settings without backtesting can lead to over-optimization, meaning you customize the settings to perform well on historical data but they may not work effectively in real market conditions. Therefore, it is recommended to first test the settings on a demo account or with past data.
How to Set Alerts for the MACD Indicator on TradingView
To set an alert on the MACD indicator in TradingView, first, open your desired chart and click on the bell icon at the top of the page. In the window that appears, specify the alert condition. A common option is when the MACD line crosses the Signal line, as this crossover typically signals a momentum change in the market. By selecting this option and choosing your preferred time frame, you can set the alert to activate only on specific time frames.
Next, choose the type of notification. TradingView allows alerts to be sent via mobile notification, email, or a pop-up on the screen. This feature ensures you don’t miss any important signals, even when you’re not actively monitoring the chart. For example, if you’re trading in the cryptocurrency market, you can set an alert to notify you via the app as soon as a bullish or bearish crossover occurs.
Setting alerts on the MACD is one of the simplest ways to react quickly to trend changes, helping you identify trading opportunities on time without needing to monitor the chart for hours.
An important point to keep in mind when using the MACD is that it is a lagging indicator. This means it is based on past price data and, as a result, it may react to market changes with a delay.
Comparison of Different MACD Versions on TradingView
On the TradingView platform, there are several versions of the MACD indicator, designed by the community of users. Each of these versions has unique features that allow traders to choose the one that best suits their trading style.
The default version is sufficient for most users, but newer versions, with more diverse color schemes and visual displays, make it easier to understand market trends. Overall, the MACD indicator on TradingView gives you the flexibility to choose between simple and advanced versions, based on your needs.
Difference Between Default MACD and MACD Color
The default version of the MACD includes two simple lines and a standard histogram that shows market momentum changes. In contrast, the MACD Color version is designed with a variety of colors for the histogram bars. In this version, the green color indicates increasing bullish momentum, while the red color indicates decreasing momentum.
These colors help traders more easily detect trend changes. For example, when the histogram changes from red to green, it signals a potential beginning of an upward movement. Combining this version with tools like Bollinger Bands can provide more precise signals.
Difference Between Default MACD and MACD 4C
The MACD 4C version is one of the most popular versions among professional users. This version uses four different colors to display momentum strength, making trend changes clearer. Lighter colors typically indicate strengthening momentum, while darker colors show weakening momentum.
Additionally, some versions of 4C can identify divergences, helping traders spot potential market reversals earlier. However, the default version remains a reliable choice for those looking for simplicity and focus on the primary signals.
Difference Between MACD on TradingView and MetaTrader
At first glance, there may not seem to be a significant difference between the MACD versions on TradingView and MetaTrader, but in practice, these two platforms serve different purposes. On TradingView, the MACD indicator is displayed with a more precise graphical appearance, customizable color schemes, and the ability to use multiple time frames simultaneously.
Additionally, users can choose different MACD versions from the community scripts section and modify the visual or computational settings. As a result, the MACD indicator on TradingView offers greater flexibility for technical analysts.
In contrast, MetaTrader is primarily focused on automated trading and direct broker connectivity. The MACD version on this platform is simpler and is better suited for automated strategies, such as Expert Advisors (EAs). Overall, MetaTrader excels in automation but doesn’t match TradingView in terms of visual display and features.
When comparing tools, indicators like the RSI are more accurately implemented for algorithms in MetaTrader, while TradingView’s charts are more suitable for visual analysis. Ultimately, many professional traders use TradingView for their analysis with visual tools and price action methods and then execute trades on MetaTrader, taking advantage of both platforms simultaneously.
Conclusion
Overall, the MACD indicator on TradingView is one of the key tools for identifying momentum and trend changes in technical analysis. Cryptocurrency moving averages and displaying a histogram, it helps traders more accurately identify entry and exit points. If you’re a beginner, it is recommended to first test different settings and strategies in a demo account to familiarize yourself with the MACD’s behavior in various market conditions.
With time and consistent practice, your understanding of how the market reacts to the signals from this indicator will deepen. By using new features like alerts and advanced versions on TradingView, the MACD becomes an even more powerful tool for precise trend analysis and more confident decision-making in trades.