icon icon Home
icon icon Accounts
icon icon Quick start
icon icon Symbols

Everything You Need to Know About Moving Averages and Their Use in Trading Strategies

Author
Abe Cofnas
Abe Cofnas
calendar Last update: 3 December 2025
watch Reading time: 14 min

A moving average is far more than just a line drawn on a chart. It acts as an intelligent filter that removes short-term noise and emotional volatility, revealing the true direction of the market. By smoothing scattered price data into a clear and continuous flow, the moving average helps traders avoid emotional reactions to random market fluctuations and instead base their decisions on the dominant trend.

bookmark
Key Points:
  • Moving averages can act as an effective filter for identifying trend strength.
  • In highly volatile markets, using a combination of multiple moving averages with different time periods can generate more reliable trading signals.
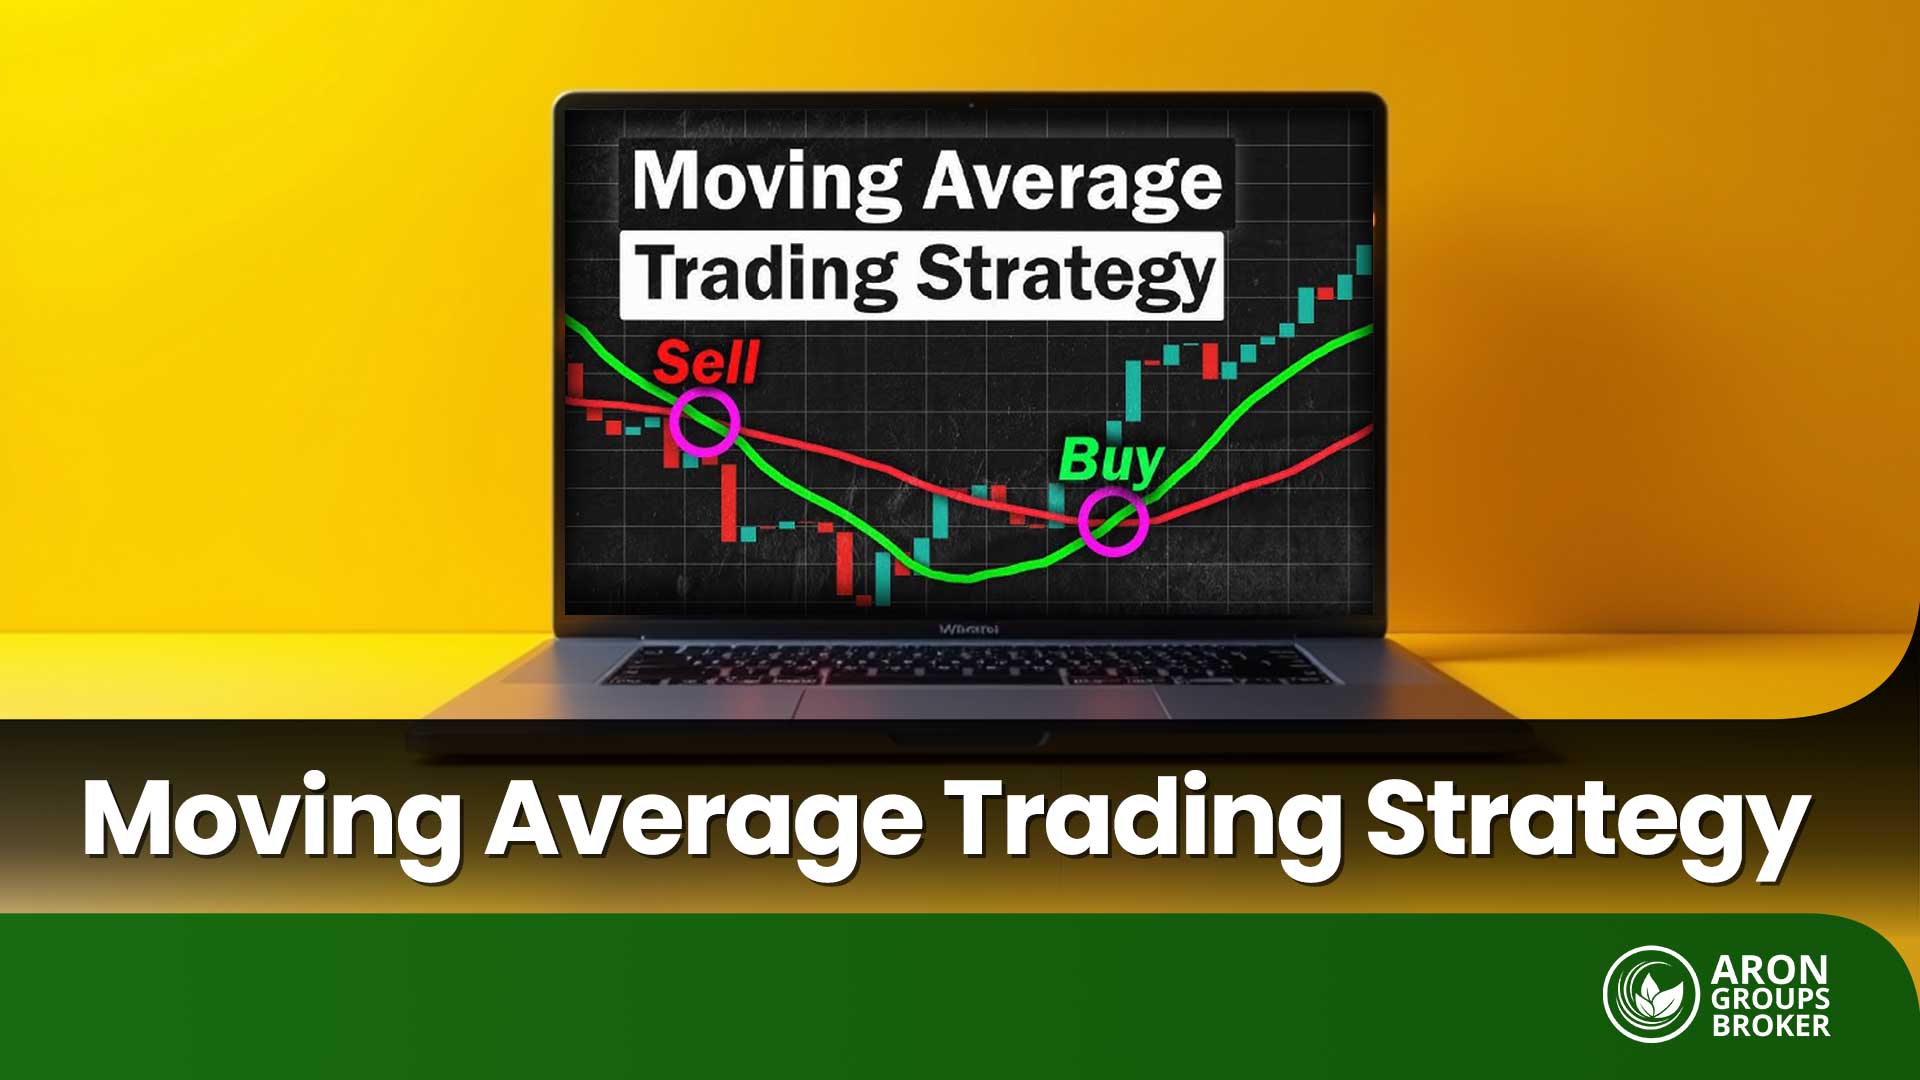
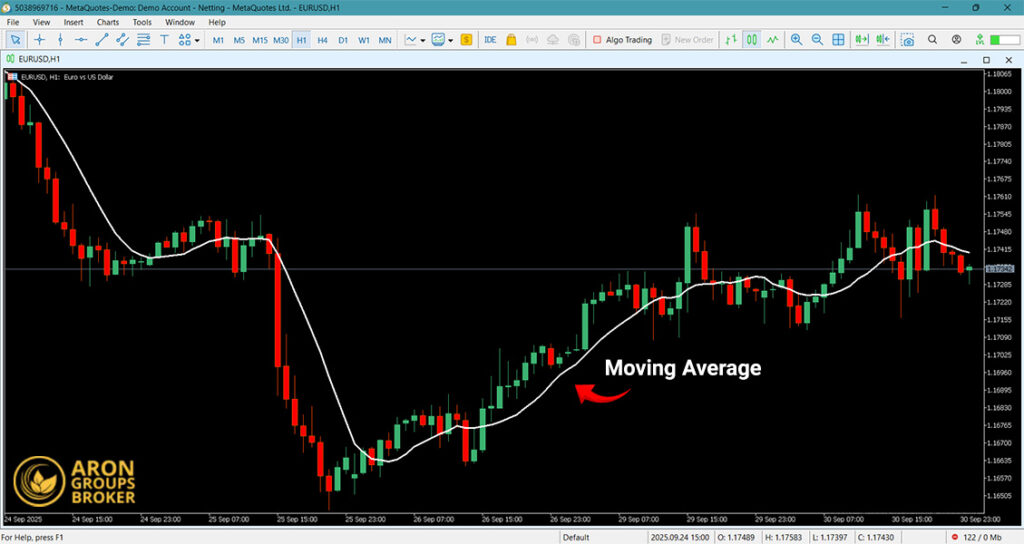
  • Moving averages are extremely useful for identifying market cycles and potential reversal points.
  • Combining moving averages with trading volume can significantly improve the accuracy of trading signals.

What Is a Moving Average and How Does It Work?

According to BabyPips, the Moving Average (MA) is one of the simplest yet most widely used tools in technical analysis. Its primary function is to calculate the average price of an asset over a specified period. By smoothing out price fluctuations, this indicator helps traders filter out short-term noise and gain a clearer view of the market’s overall trend.

Moving Average
Moving averages play several important roles in technical analysis, including:
  • Identifying market trends: By observing the slope and direction of the moving average, traders can easily determine whether the market is trending upward or downward.
  • Determining support and resistance levels: Moving averages often act as dynamic support and resistance levels, helping to limit or reverse price movements.
  • Generating trading signals: When the price crosses above or below a moving average, or when two moving averages produce a crossover, it can generate buy or sell signals.
  • Filtering market noise: By smoothing out short-term fluctuations and insignificant volatility, moving averages help traders focus on the bigger and clearer picture of market structure.
sms-star

According to Investopedia: A moving average (MA) helps traders smooth out price data over a chosen period, which reduces random short-term fluctuations and reveals the underlying trend more clearly.

Types of Moving Averages in Technical Analysis

Moving averages come in several forms, each using a different calculation method and sensitivity level. These variations allow traders to analyse price behaviour from multiple perspectives. Below, we’ll explore the most common types of moving averages and how each one is used in technical analysis.

What Is the Simple Moving Average (SMA)?

The Simple Moving Average (SMA) is the most basic type of moving average. It is calculated by taking the arithmetic mean of closing prices over a selected period. Because of its straightforward structure, the SMA provides a clear and smoothed view of the market trend, making it a popular tool among traders of all levels.

Everything You Need to Know About Moving Averages and Their Use in Trading Strategies

To calculate the Simple Moving Average (SMA), you simply add up the closing prices over the selected period and divide the result by the number of days.

SMA = (P₁ + P₂ + … + Pₙ) / n

Where:

  • n is the number of time periods, and
  • P₁, P₂, …, Pₙ represent the prices from period 1 to period n.

For example, if you want to calculate a 10-day SMA, you add the closing prices of the past 10 days and then divide the total by 10.

Why is it called “moving”?

Because with each new day, the first (oldest) price drops out of the calculation, and the latest price is added. This means the calculation window continually shifts forward.

sms-star

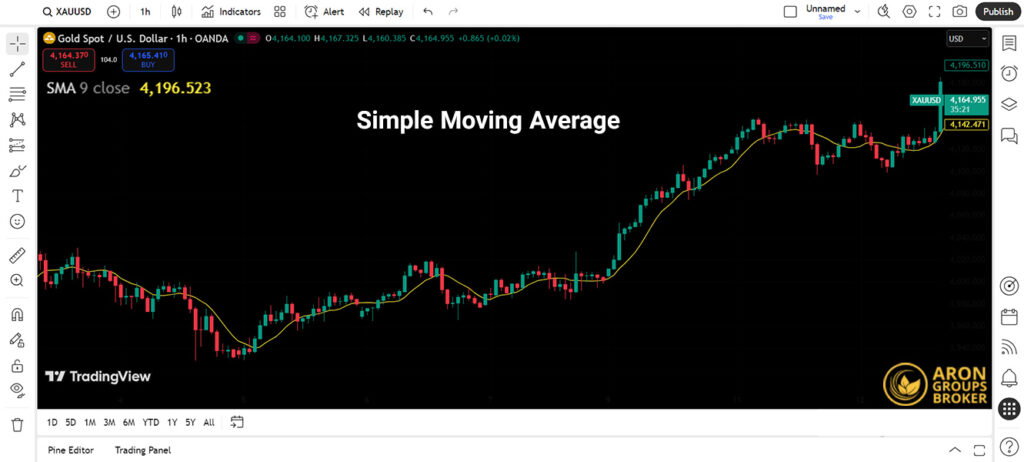
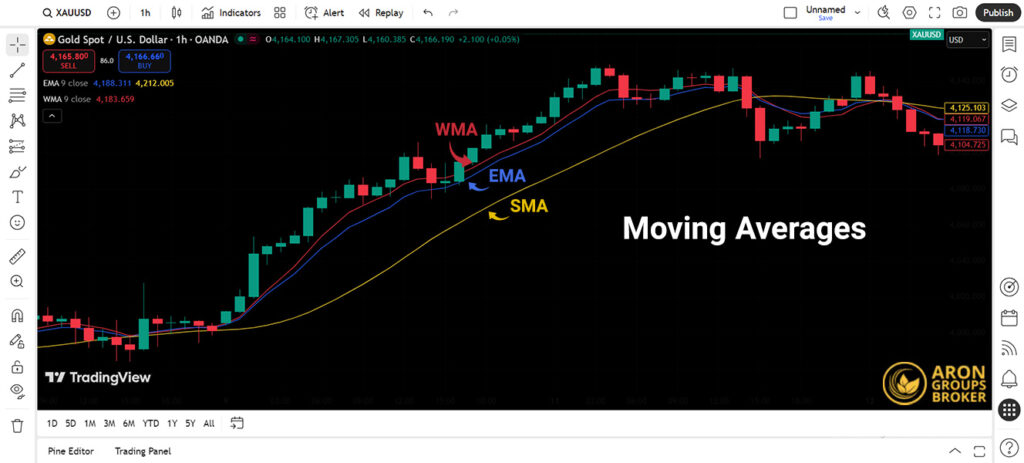
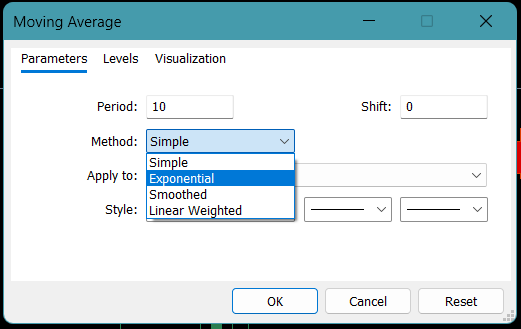
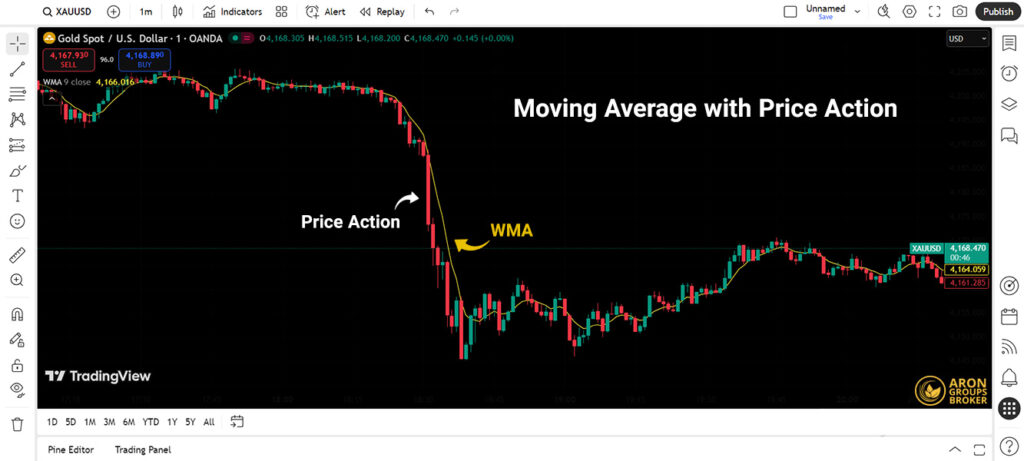
The SMA assigns equal weight to all prices within the selected time period; yesterday’s price has the same impact on the average as the price from 10 days ago. As a result, the SMA tends to react more slowly to sudden or recent price changes, making it a lagging indicator.

Exponential Moving Average (EMA) and How It Differs from SMA

The Exponential Moving Average (EMA) is a more advanced type of moving average that assigns greater weight to recent price data. This weighted approach makes the EMA more sensitive to price changes, allowing it to react much faster to market fluctuations compared with the Simple Moving Average (SMA).

Moving Average

Calculating the EMA is slightly more complex than the simple moving average (SMA) because it uses a smoothing factor to give more weight to recent data. The general formula is as follows:

EMA = [Day’s Price × (2 / (n + 1))] + [EMA Yesterday × (1 – (2 / (n + 1)))]

In this formula:

  • n represents the number of periods;
  • Today’s Price is the current day’s price;
  • and EMA Yesterday is the exponential moving average from the previous day.
sms-star

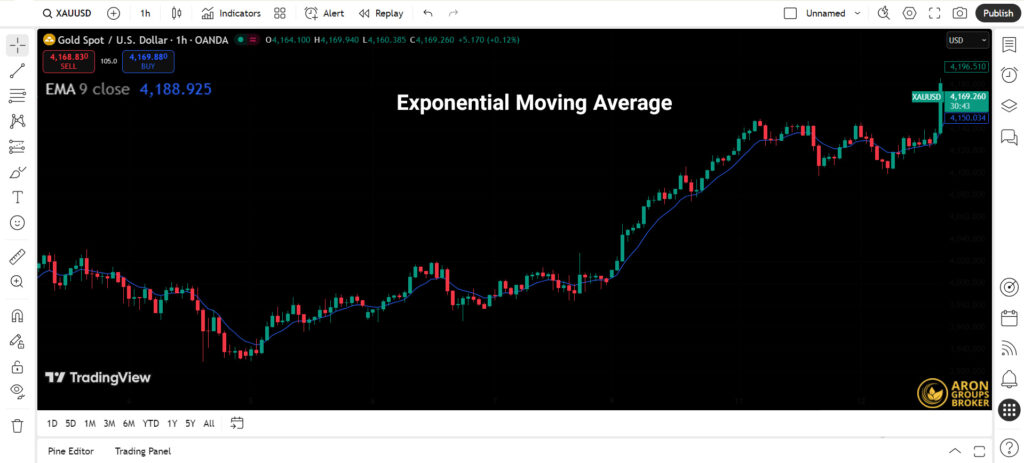
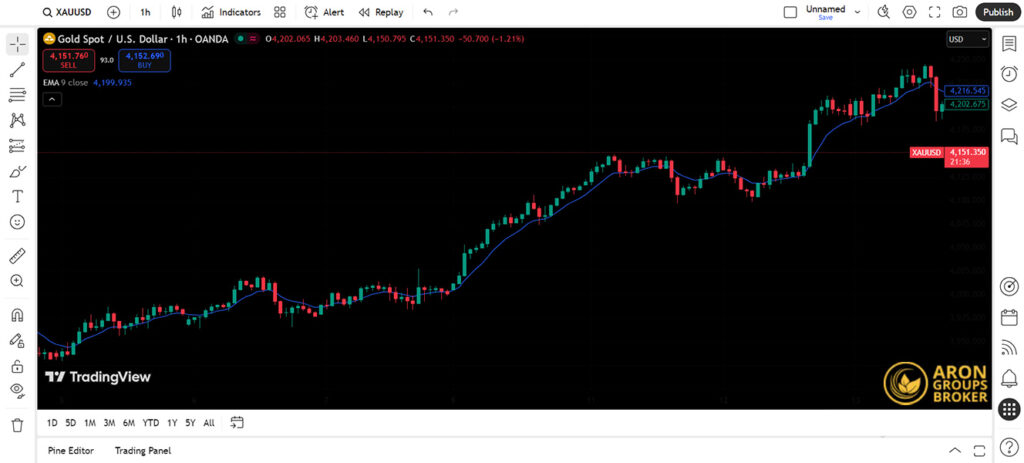
According to analysis by StockCharts, since the EMA assigns more weight to recent data, it exhibits less lag compared to the SMA. This characteristic makes the EMA a more suitable choice for short-term traders who need faster trading signals.

Weighted Moving Average (WMA)

The Weighted Moving Average (WMA) is another type of moving average that assigns weights to prices. Unlike the Exponential Moving Average (EMA), which uses complex exponential formulas, the WMA employs a linear weighting scheme for price data.

In the WMA system, more emphasis is placed on recent data: the most recent price receives the highest weight, and the weight of older prices decreases linearly as you move further back in time.

Everything You Need to Know About Moving Averages and Their Use in Trading Strategies

Example: Suppose we want to calculate a 5-day Weighted Moving Average (WMA):

  • Today’s price (most recent) receives a weight of 5.
  • Yesterday’s price receives a weight of 4.
  • The price from 5 days ago (oldest) receives a weight of 1.

The mathematical formula for this indicator is:

WMA = [ (Price₁ × w₁) + (Price₂ × w₂) + … + (Priceₙ × wₙ) ] / (w₁ + w₂ + … + wₙ)

Where:

  • n is the total number of periods;
  • Price₁, Price₂, …, Priceₙ are the prices for periods 1 to n (usually closing prices);
  • w₁, w₂, …, wₙ are the weights assigned to each period.

In terms of sensitivity to price fluctuations, the WMA ranks in the middle:

  • Its reaction is faster and more sensitive than the Simple Moving Average (SMA).
  • However, it is generally less sensitive than the Exponential Moving Average (EMA).

Although this type of moving average is not as widely used among traders as the SMA or EMA, it can be a very useful tool in specific trading strategies that require a particular type of linear weighting.

Type of Moving AverageReaction Speed (Sensitivity)Weighting MethodBest Use
EMA (Exponential)Very FastPuts most weight on recent pricesShort-term trading and quick trend change detection
WMA (Weighted)FastLinear weighting (decreasing from newest to oldest)Strategies based on recent price movements
SMA (Simple)SlowEqual weight to all prices in the periodIdentifying long-term and stable trends
SMMA (Smoothed)Very SlowHeavy weighting on very old dataNoise filtering and detecting major trends

How to Use Moving Averages in Technical Analysis

In this section, you will learn about the practical applications of moving averages in technical analysis.

Moving Averages as Dynamic Support and Resistance

One of the most useful features of moving averages is their ability to act as dynamic support and resistance levels. The key difference is that, unlike horizontal support and resistance lines fixed at specific price points, a moving average follows the price closely, with its level constantly adjusting.

Moving Average

Behavior of These Levels in Different Market Conditions:

In an Uptrend:

  • The moving average acts as a support floor.
  • When the price approaches the moving average line during temporary pullbacks, it often encounters buying interest and bounces back up.
  • A strong break below the moving average can signal a weakening uptrend or a potential trend reversal.

In a Downtrend:

  • The moving average serves as a resistance ceiling.

  • When the price rises toward the moving average during temporary rallies, it usually meets selling pressure and falls again.
  • A decisive break above the moving average may indicate a weakening downtrend and a possible change in market direction.
sms-star

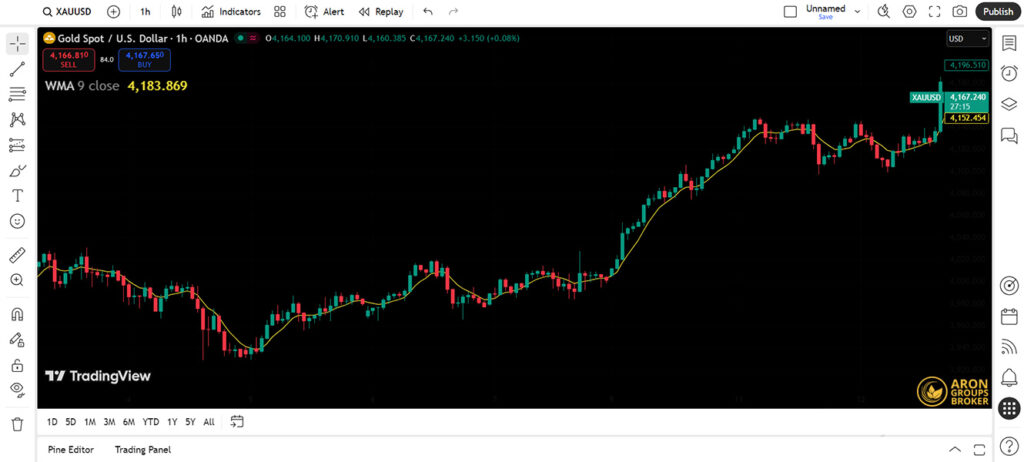
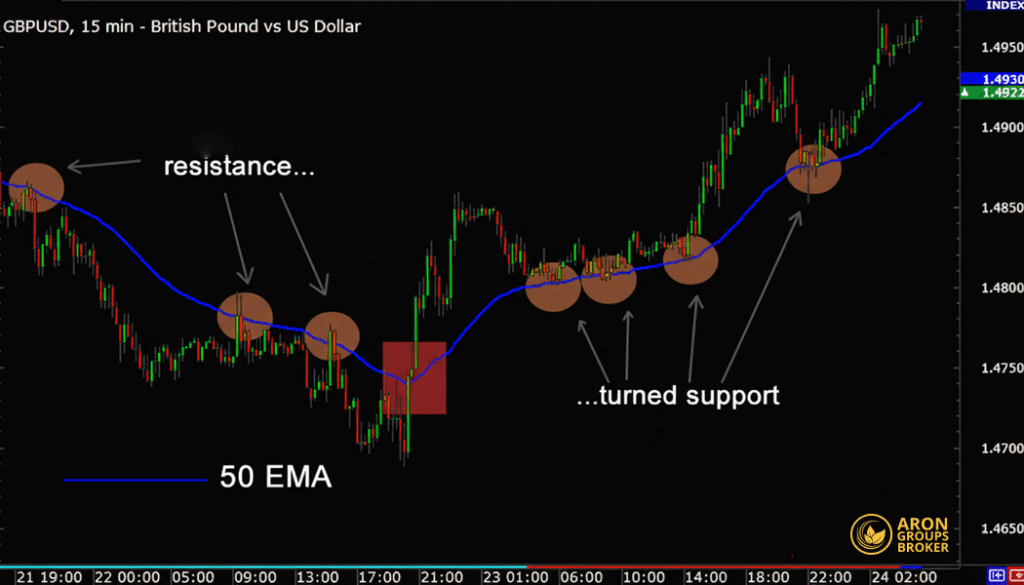
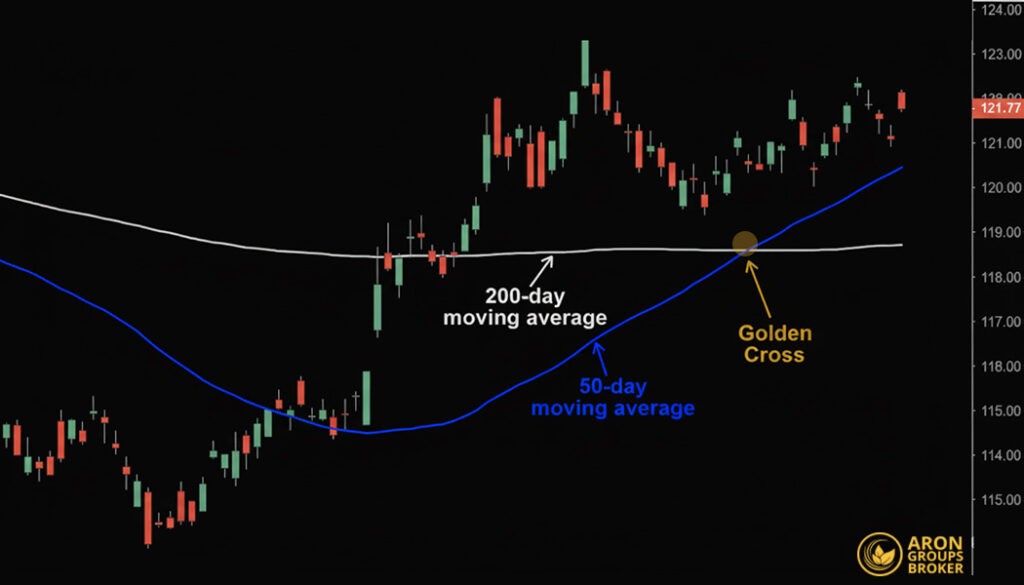
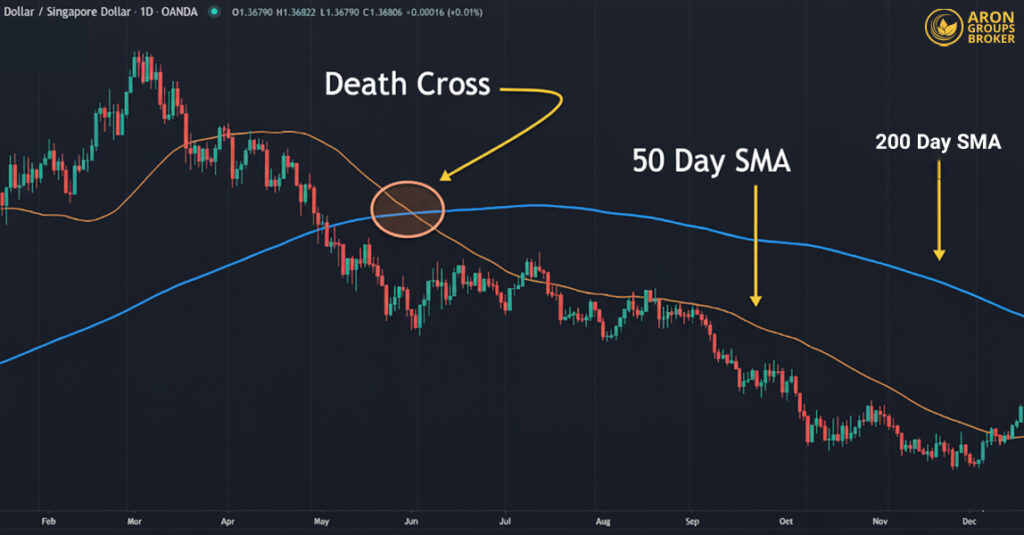
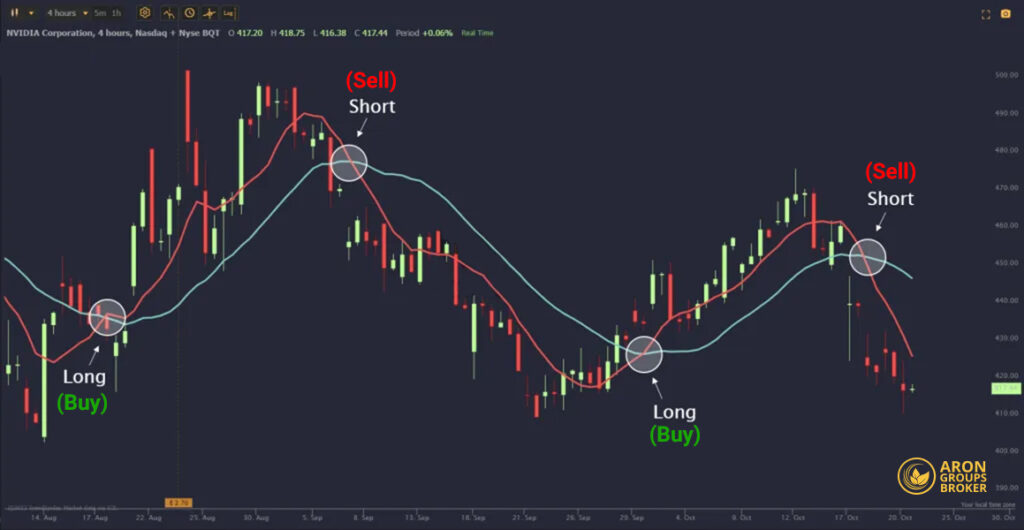
Long-term moving averages (such as the 50-day or 200-day) act as stronger support and resistance levels, while short-term moving averages (such as the 10-day or 20-day) are more sensitive but may generate false signals.

Buy and Sell Signals Using Moving Average Crossovers

One of the most popular strategies for using moving averages is the “crossover” method, which traders use to identify potential trading opportunities. In this approach, analysts typically employ two moving averages with different timeframes; one short-term and one long-term.

1. Golden Cross

A Golden Cross occurs when the short-term moving average (for example, the 50-day MA) crosses above the long-term moving average (for example, the 200-day MA).

This event is generally considered a strong buy signal and an indication of the beginning of a bullish trend.

Moving Average

2. Death Cross

This pattern is the exact opposite of the Golden Cross and occurs when the short-term moving average crosses below the long-term moving average.

This event is often interpreted as a strong sell signal and a serious warning of the potential start of a downtrend.

Everything You Need to Know About Moving Averages and Their Use in Trading Strategies

3. Price Crossovers with Moving Averages

In addition to the interaction between two moving averages, the way the price crosses the moving average line itself can also provide important trading signals:

  • Buy Signal: Generated when the price strongly crosses the moving average from below to above.
  • Sell Signal: Generated when the price breaks the moving average from above to below.

How to Add and Activate the Moving Average Indicator in MetaTrader and TradingView

Now that we understand the importance of the moving average, let’s see how to add and activate it in both MetaTrader and TradingView step by step.

Adding a Moving Average in MetaTrader

To add a moving average in MetaTrader, follow these steps:

  • Open MetaTrader and select the chart you want to analyze.
  • From the Insert menu, choose Indicators.
  • In the Trend submenu, select Moving Average.
Moving Average
  • In the opened window, you can set the type of moving average (SMA, EMA, WMA), the time period, and the color.
Moving Average
  • Click OK to apply the moving average to the chart.
Everything You Need to Know About Moving Averages and Their Use in Trading Strategies

Adding a Moving Average in TradingView

To add a moving average in TradingView, follow these steps:

  • Open TradingView and select the chart you want to analyze.
  • Click on the Indicators button at the top of the chart.
  • In the search box, type Moving Average.
Moving Average
  • From the search results, select Moving Average.
  • In the settings window, you can customize the moving average type, time period, color, and other parameters.
Moving Average
  • Click OK to apply the moving average to your chart.
Moving Average

Best Moving Average Settings for Trading

In this section, we’ll explore the optimal moving average settings for different trading styles and how to choose the right time period that aligns with your trading goals.

Setting Moving Averages for Scalping, Day Trading, and Swing Trading

There’s no fixed formula for selecting the right moving average settings; it depends entirely on your trading style. Below, we’ll review optimal settings for the three main trading styles: scalping, day trading, and swing trading.

1. Scalping

In scalping, speed is key, so you should use short-term moving averages (e.g., 5, 10, and 20 periods).

  • Recommended Type: EMA (Exponential Moving Average) is preferred because it reacts faster to price changes.

  • Golden Combination: Using EMA 5 and EMA 13 together can provide highly effective entry and exit signals for quick trades.

2. Day Trading

For day trading, balancing speed and accuracy is crucial. It’s better to use medium-term moving averages (e.g., 9, 20, and 50 periods).

  • Suggested Combinations:

    • EMA 9 and EMA 21;
    • SMA 20 and SMA 50.

  • Special Use: EMA 20 alone can act as an efficient dynamic support or resistance level, helping you identify trade opportunities within the day.

3. Swing Trading

Swing trading aims to capture larger trends, so longer-term moving averages (e.g., 20, 50, and 200 periods) are recommended.

  • Trend Identification: Combining SMA 50 and SMA 200 is excellent for spotting the market’s main long-term trend.

Entry Points: Using SMA 20 helps you identify optimal entry and exit points within the prevailing trend.

Trading StyleRecommended TimeframesSuggested Moving Average TypeCommon Combination
ScalpingShort (e.g., 5, 10, 20)EMA (faster reaction)EMA 5 & EMA 13
Day TradingMedium (e.g., 9, 20, 50)Mixed (EMA & SMA)EMA 9 & 21 / SMA 20 & 50
Swing TradingLong (e.g., 20, 50, 200)SMA (trend identification)SMA 50 & SMA 200
sms-star

Choose your time frame based on the asset’s volatility. Highly volatile assets perform better on longer time frames, which filter market noise and minimize false trading signals.

Popular Moving Averages

Professional traders often rely on specific moving average settings that have proven effective over time. The most commonly used configurations include:

SMA 50 and 200 Combination:

This classic combination is the most popular tool for identifying long-term market trends. The interaction between these two lines forms the well-known “Golden Cross” and “Death Cross” patterns, providing highly reliable signals for market participants.

EMA 12 and 26 Combination: 

These two numbers form the core calculation of the MACD indicator. Using this combination is highly effective for detecting short-term trend changes.

EMA 9, 21, and 55 Combination: 

Known as the “Reebok” setup, this trio is an excellent tool for swing traders. It helps them not only determine the trend direction but also pinpoint precise entry and exit points.

SMA 20:
This line is the backbone of the Bollinger Bands indicator. Additionally, the SMA 20 can act independently as a strong dynamic support or resistance level.

Choosing the Right Timeframe for Your Moving Average

Here is a guide to selecting the appropriate timeframe based on the type of moving average:

Short Timeframes (1–15 minutes):

  • Best for: Scalping;
    Recommended settings: Short periods (e.g., 5–20);
  • Suggested type: EMA is preferred in these intervals due to its higher sensitivity and faster reaction to price changes.

Medium Timeframes (30 minutes–4 hours):

  • Best for: Day trading;
  • Recommended settings: Medium periods (e.g., 20–50);
  • Suggested type: A combination of SMA and EMA can provide useful results in these timeframes.

Long Timeframes (Daily–Weekly):

  • Best for: Swing trading and long-term investing;
    Recommended settings: Long periods (e.g., 50–200);
  • Suggested type: SMA is preferred here due to its greater stability and ability to provide a clearer overall market picture.
sms-star

Boost the accuracy of your trading signals with multi-timeframe analysis. For instance, if a buy signal appears on the 4-hour chart, don’t enter immediately. Confirm that the daily trend is also bullish before taking the trade.

Double Moving Average Strategy

The double moving average strategy uses two moving averages with different time periods simultaneously; one short-term and one long-term.

Everything You Need to Know About Moving Averages and Their Use in Trading Strategies

To succeed with this method, it is essential to follow the four rules below:

  • Buy Signal: A buy signal is generated when the short-term moving average crosses the long-term moving average from below.
  • Sell Signal: A sell signal is generated when the short-term moving average crosses the long-term moving average from above.
  • Trend Filter: Always trade only in the direction of the main trend.


Example: If the current price is above the 200-day moving average, the overall trend is considered bullish. In this case, you should only look for buy signals and ignore sell signals.

  • Risk Management: Using a stop-loss is mandatory. Place the stop-loss at a logical level (for example, slightly below the most recent swing low before the buy signal).

Combining Moving Averages with Price Action


The combination of moving averages and price action can create a highly effective trading strategy in the market. While price action focuses on analyzing the raw and pure movements of price without relying on indicators, moving averages serve as a supportive tool to clarify the trend direction and trend strength.

Moving Average

To apply this method, follow these steps:

  • Identify the Trend with a Moving Average: First, use a reliable moving average to determine the market’s primary trend. For example, if the price is above the line, the trend is considered bullish. 
  • Wait for a Price Retracement (Pullback): In an uptrend, avoid entering immediately. Wait for the price to retrace, move lower, and approach or touch the moving average line. 
  • Spot Price Action Patterns: When the price reaches near the moving average, look for reversal patterns. Candlestick patterns such as pin bars, engulfing patterns, or other bullish formations are highly reliable in this area. 
  • Enter the Trade: Once a price action pattern confirms that the price is likely to resume in the direction of the main trend, you can enter the trade with higher confidence. 
  • Set Stop Loss and Take Profit:  
    • Stop Loss: Place it slightly below the price action pattern (or under the moving average line).
    • Take Profit: Set your target at the next resistance level in the market.
sms-star

This strategy is particularly suitable for traders who want to enter the market at the optimal price, such as buying at corrective lows.

Conclusion

The moving average is a statistical tool designed to filter out emotional noise and clarify the market’s main trend. Its effectiveness depends less on fixed settings and more on customizing the parameters according to the asset’s volatility and the trader’s time horizon. For optimal use, it is essential to combine moving average signals with price action analysis, which helps compensate for its inherent lag and enhances the reliability of entry and exit points. Ultimately, this indicator should be used as part of a well-structured trading system, alongside precise risk management, to avoid discretionary or subjective decisions.

Continue Reading
not-found
calendar 3 December 2025
Rate this article

Leave a Reply

Your email address will not be published. Required fields are marked *

No thanks