When you read a price chart, the numbers are only the surface; the real story is where traders’ orders cluster. In Smart Money Concept (SMC), that cluster is liquidity, and it often drives the market’s quick spikes and reversals.
Two key patterns here are Equal Highs (EQH) and Equal Lows (EQL), which reveal common stop-loss and entry zones. Because institutions often target these pools, EQH and EQL help you spot fake breakouts and avoid liquidity-grab traps.
Used well, they can reduce avoidable losses and make your trading decisions more controlled in volatile conditions.
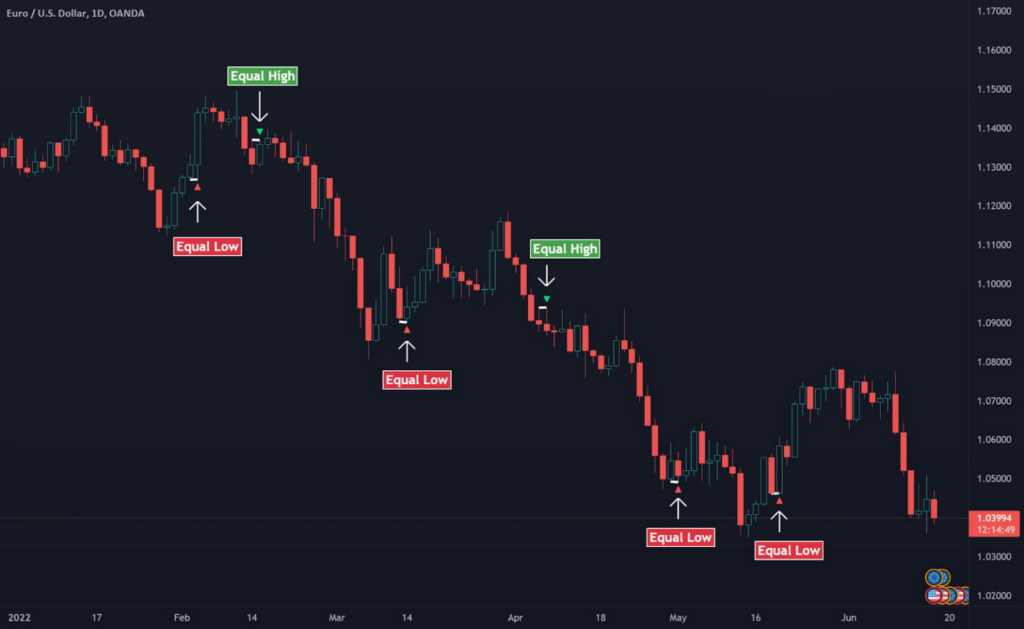
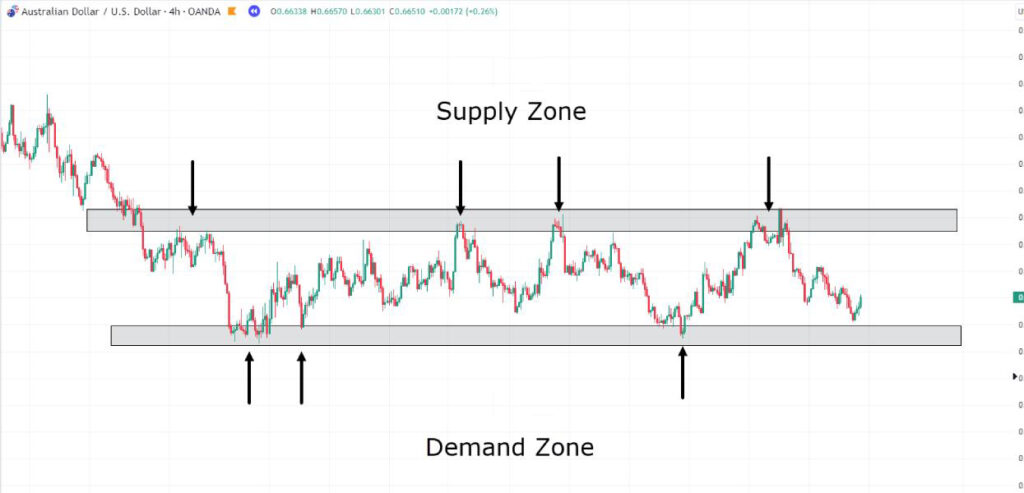
- EQL and EQH are usually more reliable on higher timeframes, such as the four-hour or daily chart, for clean structure and confirmations later too.
- Combining EQL and EQH with volume indicators can make identifying liquidity traps clearer, especially when price spikes and then reverses quickly.
- Real breakouts typically come with strong candles and high volume, not short, weak pushes that fade within minutes again and again.
- Spotting EQL and EQH helps you place your stop-loss more intelligently and safely, away from nearby liquidity pools.
What are Equal Highs (EQH) in Smart Money? (EQH trading meaning)
According to fluxcharts, Equal Highs (EQH) form when the price reaches the same high several times but fails to break through it cleanly each time. In traditional analysis, this pattern is treated as a strong resistance level that traders watch closely on charts everywhere in markets.
In Smart Money, though, the zone signals a place where smart money liquidity has stacked above the highs for later sweeps.
Above an EQH, you often find sellers’ stop-loss orders and breakout buy orders, which together create buy-side liquidity for a raid. Large institutions may push prices above those highs to trigger orders, release liquidity, and then reverse quickly.
After that liquidity grab, the market often moves against breakout traders who bought late at the top.
In short, EQH helps you locate liquidity pools above highs and reminds you that a visible break is not always a real one.
Key Insight:
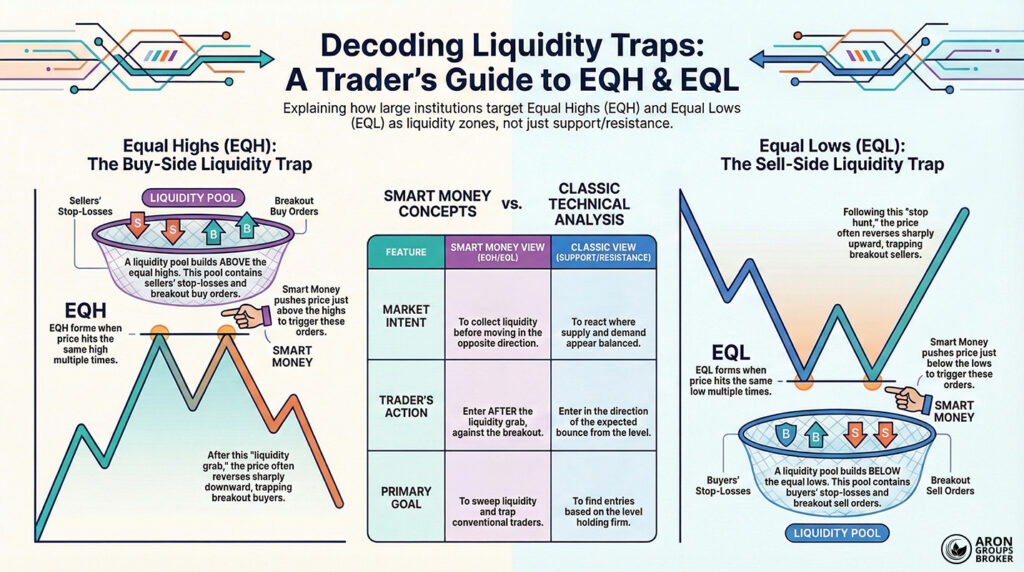
Breakout buy orders are placed by traders who expect an uptrend to continue once the price decisively clears a previous high. They set their buy entries above the high, and those orders become part of the liquidity that smart money can sweep.
What are Equal Lows (EQL) in Smart Money? (EQL in trading)
Equal Lows (EQL) form when the price reaches the same low several times but cannot break decisively below it. In classic methods, this zone is seen as strong support that traders often expect to hold during pullbacks. In Smart Money Concept (SMC), however, this area is more often treated as a liquidity trap zone.
Below these lows, you usually find buyers’ stop-losses and breakout sell orders, creating sell-side liquidity in one cluster. When large institutions push prices slightly below these lows, stops get triggered, and the needed liquidity is released quickly. After this stop-hunt, the market often rebounds strongly, trapping late sellers and clearing weak longs.
In short: EQL shows where stop hunting is likely and can help identify bullish liquidity traps in practice.
Key Insight:
Breakout sell orders are placed by traders who expect a downtrend to continue once the price breaks below a prior low. They place sell entries below the low, and those orders become part of the liquidity that institutions can sweep.
The role of EQL and EQH in identifying liquidity traps
Based on Metatrader, one of the most important uses of EQL and EQH in Smart Money is identifying liquidity traps early. A liquidity trap happens when the market moves to fool retail traders into triggering orders, then reverses hard.
- In EQH (Equal Highs):
Above equal highs, there is usually buy-side liquidity from sellers’ stops and breakout buys. Smart money pushes slightly higher, triggers orders, and then the price drops fast instead of continuing upward. - In EQL (Equal Lows):
Below equal lows, there is usually sell-side liquidity from buyers’ stops, and breakout sells. Smart money dips slightly lower, triggers orders, and then drives price upward to reverse the move sharply.
Example
Imagine the price reaches 1.2000 three times and cannot move higher, forming an EQH on the chart clearly. Many traders believe that if this level breaks, the uptrend will continue, so they place breakout buys above it.
Smart money pushes the price to 1.2010, triggers orders, and then the price quickly falls to 1.1950 afterward. That sequence is a classic liquidity grab trading setup, and it often traps breakout traders at the worst time.
How to trade using EQL and EQH
After understanding EQL and EQH, the next step is applying them in real trades with clear rules. Below, we first cover how to spot entry and exit points, then how to use these levels for stop-loss and take-profit.
Finding entry and exit points with EQL and EQH
To find a solid entry or exit, you can use EQL and EQH as liquidity-based reference zones.
- When Equal Highs (EQH) form and price starts reversing after a false breakout, it can signal a sell entry.
- When Equal Lows (EQL) appear, and price moves up again after a liquidity grab, it can signal a buy entry.
- Exits are usually taken at the next liquidity level or a key support/resistance zone to lock in sensible profit.
Setting stop-loss and take-profit with EQL and EQH
When trading Smart Money setups based on EQL or EQH, you must define stop-loss and take-profit precisely. This keeps risk controlled and prevents one bad trade from damaging your account significantly over time.
Stop-loss
- If you enter a sell after an EQH setup, place the stop-loss slightly above the equal highs.
- If you enter a buy after an EQL setup, place the stop-loss slightly below the equal lows.
Take-profit
- You can set a take-profit at the first next liquidity pool or at major support/resistance zones ahead.
- A practical risk-to-reward ratio is at least 1:2 or 1:3, meaning potential profit is two to three times risk.
In other words, the stop-loss sits just beyond the EQL or EQH, while the take-profit targets the next likely reaction zone. This approach makes your profit and loss planning structured, realistic, and less emotional during fast-moving markets.
The image shows a 15-minute chart of GBP/USD with tools like Elliott Waves, a double-top pattern, and Fibonacci retracement levels. Its link to the stop-loss and take-profit topic is clear when you map those marked highs and lows to liquidity concepts.
- The marked highs (Top 1 and Top 2) and the marked lows can be treated as EQH and EQL zones in SMC.
- Around those points, a trader can place a stop-loss just beyond the highs or lows to avoid obvious stop sweeps.
- The chart’s Target area and Fibonacci levels can act as take-profit zones as the next move unfolds.
The difference between EQH/EQL and classic support and resistance
In classic support and resistance, traders treat a level as support or resistance after several failed break attempts. If the price cannot push through the level, they expect a reversal from that same point on the chart.
In the Smart Money Concept, these levels are not just support or resistance; they are zones where significant liquidity has accumulated.
| Feature | EQH & EQL in Smart Money | Classic Support & Resistance | Double Top / Double Bottom |
|---|---|---|---|
| Definition | A zone where liquidity clusters, including stop-losses and pending orders, around equal highs or lows. | A level where price reacts, and traders expect a bounce or rejection from that area. | A pattern with two tests at one level often signals a potential trend-reversal setup. |
| Primary goal | Sweep liquidity first, then move in the opposite direction after orders are triggered. | Find entries or exits based on price bouncing repeatedly from the level. | Provide a clearer reversal signal based on the pattern’s rules and confirmation. |
| Risk profile | Higher risk, because liquidity traps and false breaks are common around these zones. | Medium risk, because the level can still break and invalidate the bounce idea quickly. | Medium risk, because it depends on confirmation and proper pattern execution. |
| Typical use | Enter after the liquidity grab, usually in the opposite direction of the breakout move. | Enter in the direction of the expected bounce, directly from the level’s first reactions. | Enter the reversal direction once the pattern confirms a shift in structure. |
| Market intent | Collect liquidity so large players can execute entries with less slippage and better fills. | React to an important level where supply and demand are assumed to balance. | Signal a broader change in market direction after momentum weakens at the level. |
The difference between EQH/EQL and double top / double bottom patterns
In classic technical analysis, double tops and double bottoms are treated as clear signals of a confirmed trend reversal. When a double top or double bottom forms, most traders expect the trend to flip and open trades in the opposite direction.
With EQH and EQL, however, the focus is mainly on liquidity zones rather than a guaranteed change in trend. The market often breaks these levels to collect liquidity, so the move does not automatically mean a reversal is coming.
In many cases, the sweep can be followed by trend continuation, depending on structure, momentum, and higher-timeframe context.
The difference between EQH/EQL and supply and demand zones
Supply and demand zones usually reflect strong buying or selling that happened in the past, often driven by institutions. When price returns to these zones, a reaction is likely because large traders may execute remaining orders there again.
The key difference is that supply and demand point to past areas where big trades occurred and an imbalance was created. EQH and EQL, however, mark places where fresh liquidity has accumulated and is ready to be swept or hunted.
Conclusion
Understanding EQL and EQH helps traders spot liquidity traps and distinguish real breakouts from fake breakouts correctly. With better entry and exit planning and a well-placed stop-loss, trades can become safer and more consistently profitable.