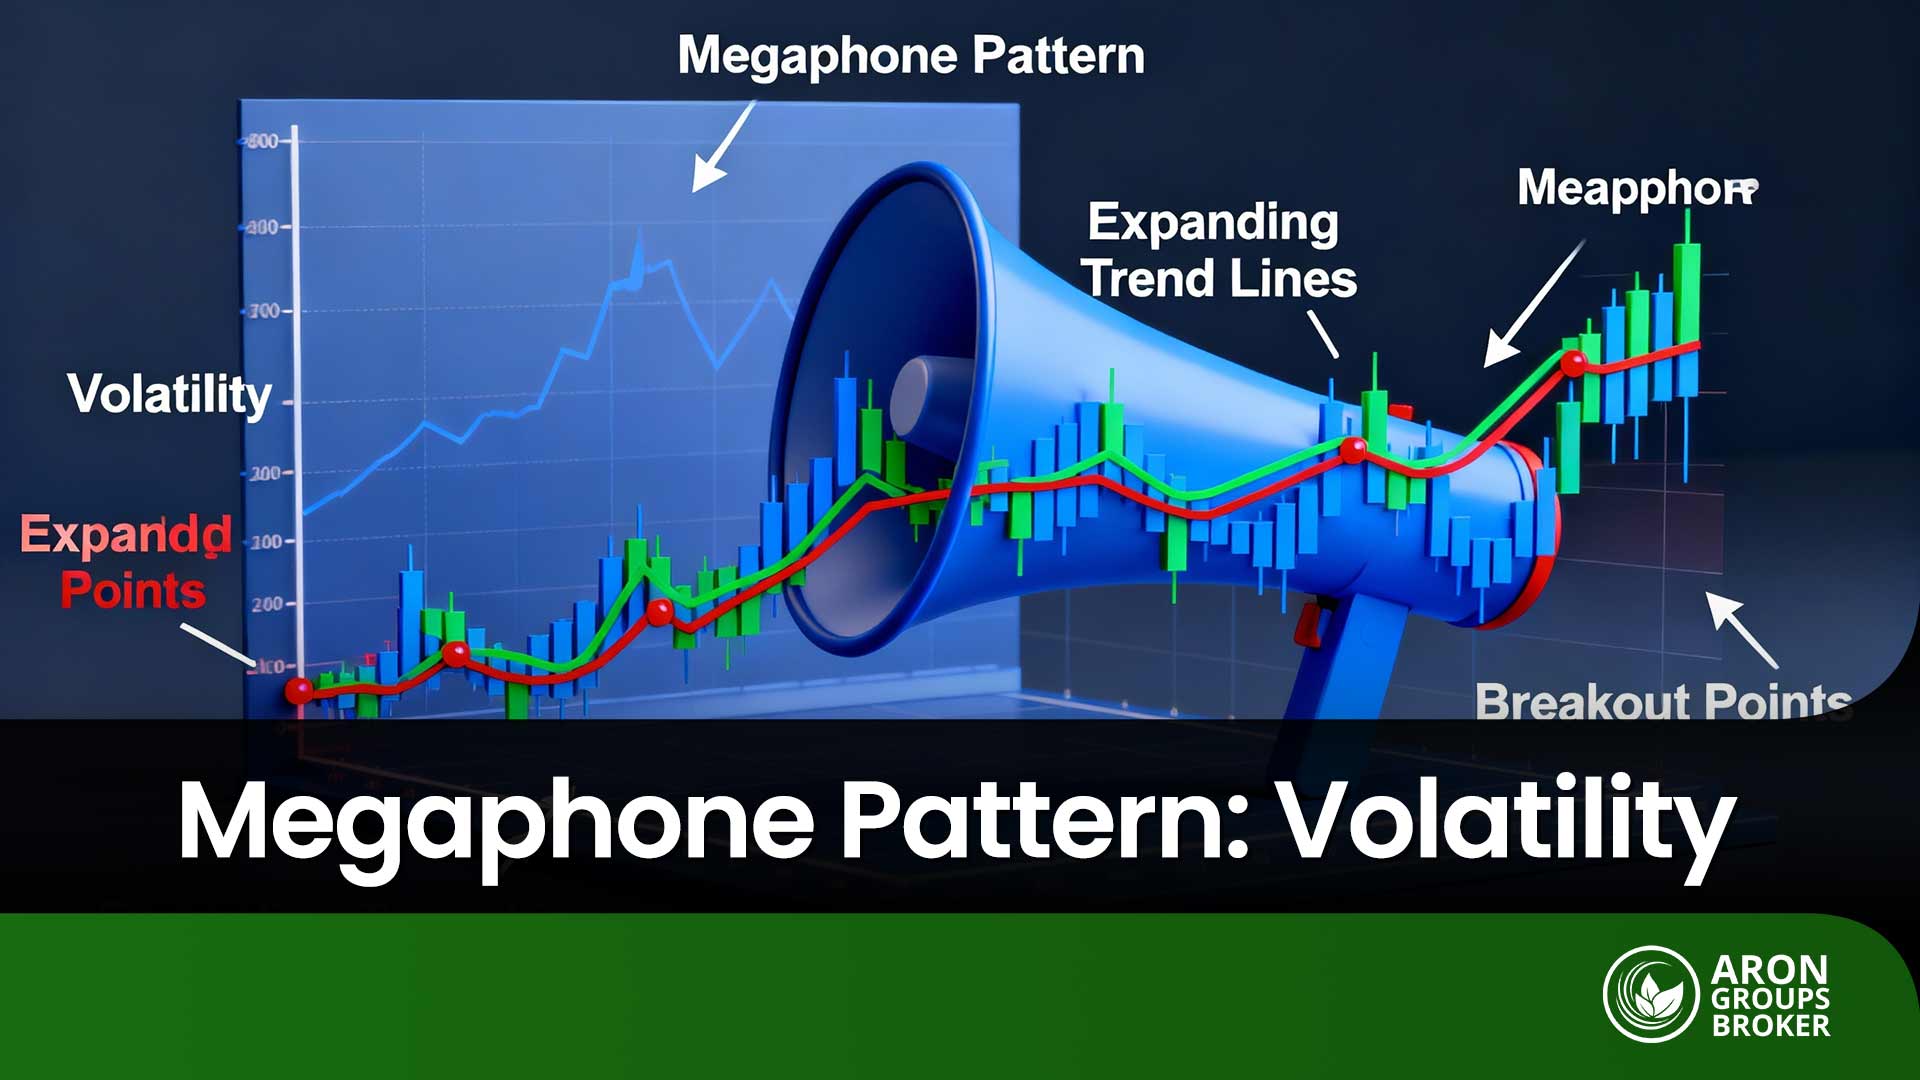


In technical analysis, markets sometimes act neither bullish nor bearish, but wildly unstable and hard to predict. These sharp swings may look random at first, yet they often signal a specific formation called the Megaphone Pattern. This pattern confuses many beginners, but it can create strong opportunities for experienced swing traders.
Inside the chaos, a hidden structure forms that can point to explosive price moves when identified correctly. It is often associated with false breakouts, a widening range, and difficult decision-making under uncertainty. Exactly these traits make it attractive for short-term strategies focused on volatility and fast entries or exits.
What You Will Learn in This Article?
We will break down the complexities of this pattern so you can identify it with confidence:
- How to spot the “inverted triangle” shape on a chart.
- Specific strategies for managing volatility.
- How to tell a Megaphone apart from other common patterns like “flags” or “wedges.”

- The Megaphone Pattern is a chart pattern that shows a diverging channel between support and resistance levels.
- This pattern signals rising price volatility and a widening trading range over time.
- Swing traders can use internal swings inside the pattern to seek profits, while managing risk carefully.
What Is the Megaphone Pattern?
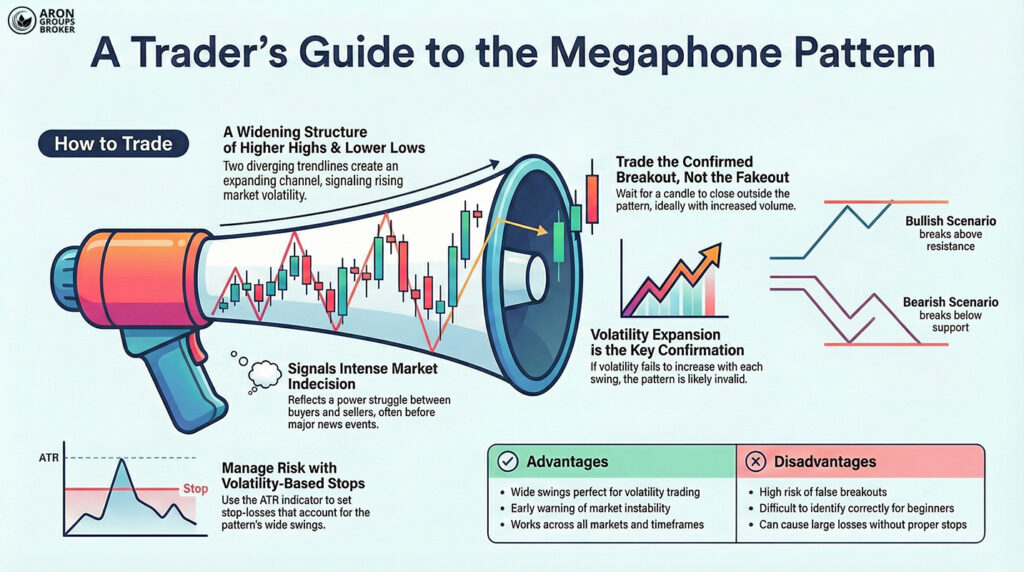
The Megaphone Pattern is a chart-based technical formation defined by a gradual expansion in price swings. It consists of two diverging trendlines:
- One rising and one falling, which creates a widening structure.
Because of its expanding shape, many traders also call it an “inverted symmetrical triangle” or a “loudspeaker pattern.”
Main Signs of the Megaphone Pattern
- Higher highs and lower lows are forming in sequence, expanding the swing range over time.
- Clear signs of intense conflict between buyers and sellers, which increases uncertainty and volatility.
- Often appears when markets face major uncertainty, like earnings reports, elections, or key Federal Reserve decisions.
Why Is the Inverted Symmetrical Triangle Important?
This pattern matters not only because of its unique shape, but also because it reflects unstable volatility conditions. Sources like StockCharts highlight it for the way it signals widening swings and repeated failed break attempts. Spotting it early can help avoid large losses or enable quicker entries and exits during high-volatility moves.

Key Insight:
The most valuable information in a Megaphone Pattern is not direction, but volatility expansion. If volatility fails to increase with each swing, the structure is likely noise, not a valid megaphone.
Q: Can a Megaphone Pattern fail without ever breaking out?
A: Yes. Some megaphones dissolve into range trading when volatility collapses suddenly, often after news clarity removes uncertainty from the market.
Overall Structure of the Pattern and How It Forms on a Chart
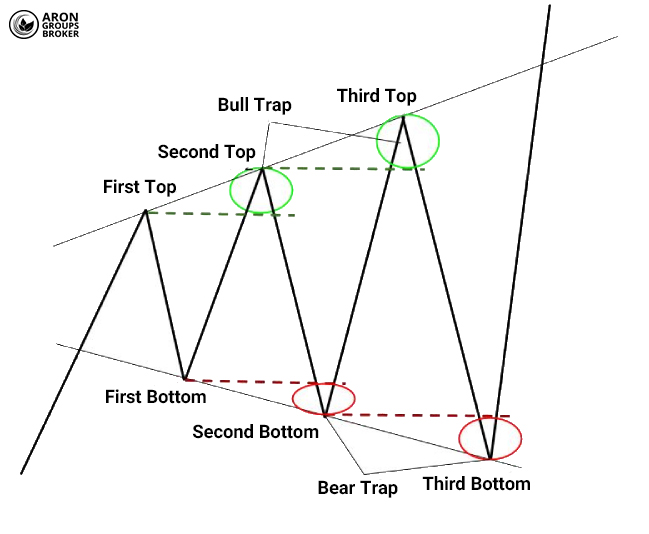
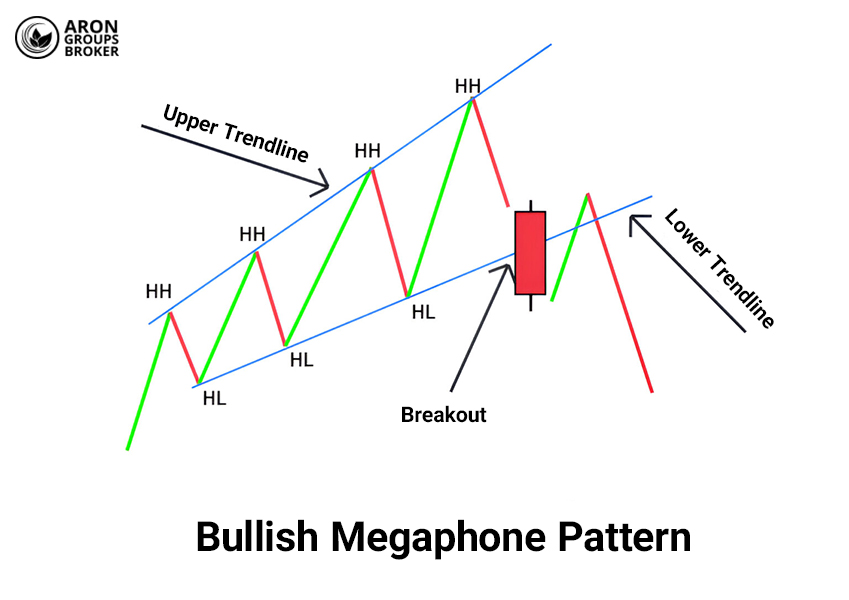
Two diverging trendlines define the Megaphone Pattern (or inverted symmetrical triangle). Each new peak forms higher than the previous one, and each new trough forms lower than the prior one. In the image below, the structure of a Megaphone Pattern is shown in a simplified form.
Pattern Formation Phases
- Starts with limited swings: At first, the market moves with relatively normal volatility around the initial high and low.
- Forms higher highs: Buying pressure breaks the prior peak and prints a second, then a third, higher top.
- Forms lower lows: Sellers step in aggressively and push prices to lower bottoms after the second and third tops.
- Wider distance between tops and bottoms: This widening gap reflects rising volatility and growing market indecision.
Key Features of the Megaphone Pattern
The Megaphone Pattern is a classic but lesser-known technical analysis pattern, especially attractive to swing traders. The following characteristics typically recognise this pattern:- Visual shape: Diverging, resembling a megaphone or an inverted triangle with an expanding range over time.
- Chart structure: A sequence of higher highs and lower lows, showing expanding price swings in both directions.
- Volatility-driven nature: Wide and high-risk swings, unlike common triangle patterns that usually converge and compress.
- Signal of market indecision: It reflects intense conflict between buyers and sellers, often with repeated reversals.
- Typical timing: It often appears ahead of major news releases or corporate earnings reports and guidance.
- Confirmation with other tools: Indicators like RSI, ATR, and volume are recommended to validate trades more reliably.
- Risk management: Bull traps and bear traps are common, so setting a proper stop-loss is essential.
Types of the Megaphone Pattern in Technical Analysis
Depending on the direction of the final breakout, the Megaphone Pattern is generally classified as bullish or bearish. In both cases, strong volatility and a diverging structure are shared, but the final signals differ.Bullish Megaphone Pattern
In this case, after wide and misleading swings, the price eventually breaks above the upper resistance and trends upward.- An upside breakout after the last peak forms, signalling a shift in momentum toward buyers.
- The signal is confirmed by rising volume or RSI crossing above the 50 level with stronger participation.
- It suits price action strategies and trend-following traders who look for continuation after confirmation.
Pro Tip:
Enter on a valid breakout, and use ATR to set a realistic stop-loss in this setup.
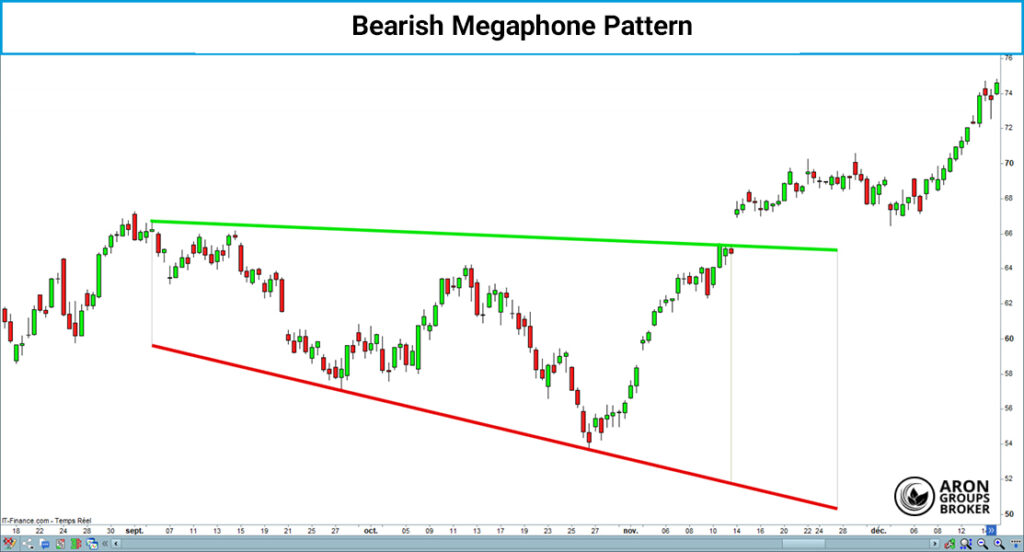
Bearish Megaphone Pattern
In the bearish version, after deceptive swings, the market finally breaks downward and enters a correction or sharp decline.
Key features include:
- A support breakdown followed by a lower low, confirming downside pressure and weakening demand.
- It is often accompanied by bearish RSI divergence or a notable drop in trading volume and participation.
- It fits short-selling setups and timely exits from long positions before downside acceleration.
How to Identify and Trade the Megaphone Pattern
In this section, we cover how to spot the Megaphone Pattern and the key rules for entry, exit, stop-loss, and take-profit.How to Recognise the Megaphone Pattern on a Chart
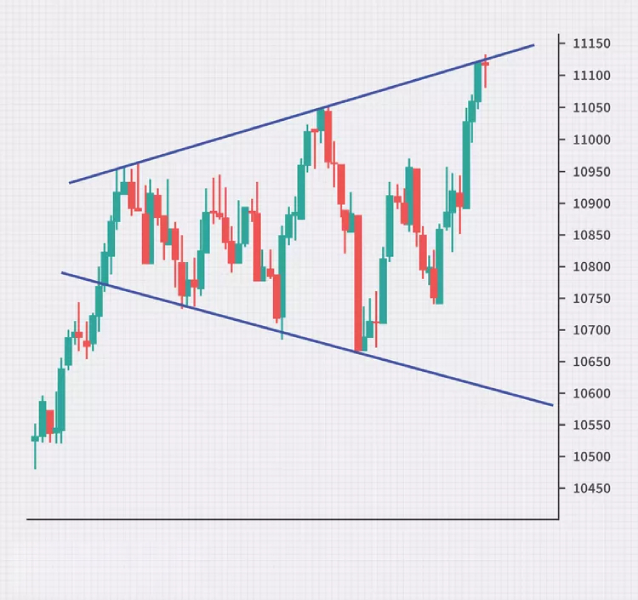
The pattern is identified by two diverging trendlines, with highs rising gradually and lows falling over time. Peaks move higher (Higher Highs) while troughs move lower (Lower Lows), creating an expanding price range.How to Set Entry and Exit Points Using Trendline Breakouts
When trading a Megaphone Pattern, entry should not be based on a brief touch or momentary line break. Many breakouts in this pattern are fake or misleading, so trades should start only after a confirmed breakout. Signs of a valid breakout include:- A candle closes above resistance in bullish setups, or below support in bearish setups.
- Rising trading volume at the breakout moment shows stronger participation and commitment.
- Positive MACD divergence, or RSI crossing above the key 50 level with improving momentum.
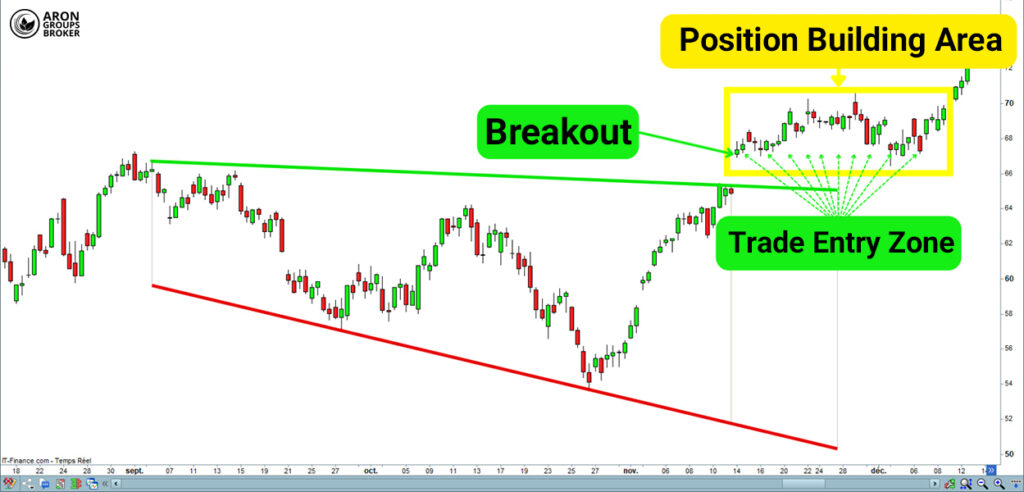
The yellow zone is called the Position Building Area, where professionals enter gradually instead of all at once. This approach helps manage risk, expand exposure after confirmation, and minimise losses if the breakout fails.
Take-profit is usually set near prior resistance, using Fibonacci tools, or at a measured target based on swing size.
Pro Tip:
Megaphone Patterns lose reliability if they stretch too long without a decisive breakout. Extended duration often leads participants to lose conviction, increasing fakeouts and reducing the probability of follow-through.
Q: Is it better to trade inside the Megaphone or wait for the breakout?
A: Inside trading suits advanced traders only, while breakout trading favours discipline, confirmation, and clearer risk control for most participants.
Setting Stop-Loss and Take-Profit in the Megaphone Pattern
Whether bullish or bearish, choosing the correct stop-loss location is a central part of risk management.
How to Place a Stop-Loss
In a bullish Megaphone Pattern, the stop-loss is typically placed slightly below the most recent swing low. In a bearish Megaphone Pattern, the stop-loss is placed above the most recent swing high to protect short trades. To avoid premature exits from normal volatility, using the ATR indicator can be extremely helpful.
ATR, such as ATR 14, shows the average price range over a period, helping you size stops dynamically. This allows a logical buffer that matches current volatility rather than using an arbitrary fixed distance.
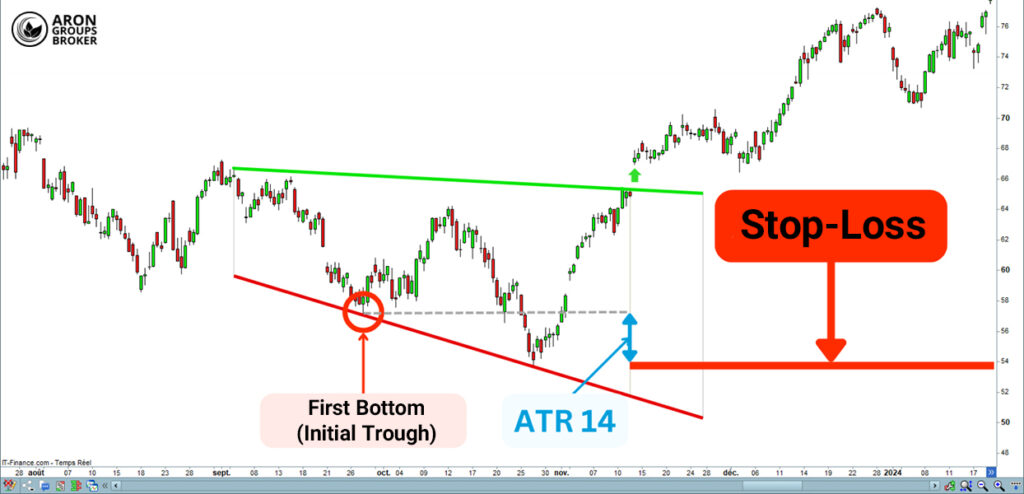
- The lower red line is the support trendline in a bearish Megaphone Pattern.
- The orange circle at the bottom marks a key support level and a critical reference point.
- The blue arrow labelled ATR 14 shows a volatility-based buffer used as a stop-loss safety margin.
- The thick horizontal red line marks the exact stop-loss level where you should exit if the price breaks lower.
How to Set a Take-Profit
A common take-profit method uses the vertical distance between the pattern’s top and bottom. This approach is known as the Measured Move, where the swing height becomes the projected profit target. In the image below, the distance from the first bottom to the final top is measured at about 93 pips. That distance is then projected downward from the breakdown point to define the take-profit level.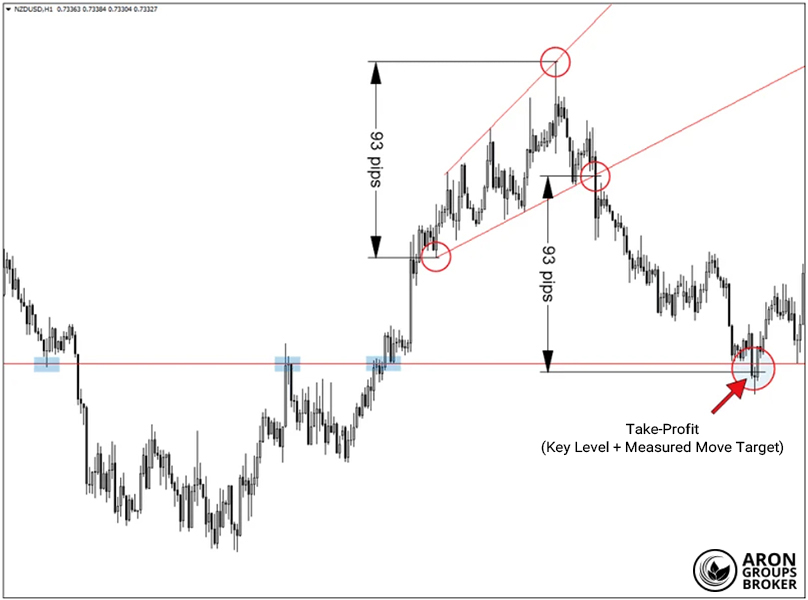
- It is 93 pips below the breakdown point, matching the measured move target.
- It also aligns with a prior key level on the chart, strengthening the target’s technical validity.
Pros and Cons of Using the Megaphone Pattern in Trading
As a high-volatility structure in technical analysis, the Megaphone Pattern can offer attractive opportunities, but it also brings risks. Below, we review the main advantages and disadvantages of this pattern.Advantages of the Megaphone Pattern
The key benefits of the Megaphone Pattern include:- Wide swings for volatility trading: This pattern creates a broad price range that appeals to traders aiming to profit from strong, rapid fluctuations.
- Works across markets and timeframes: It appears across forex, stocks, crypto, and indices, and can be analysed across lower to higher timeframes.
- Early warning of market instability: When it forms, it often signals rising uncertainty, making it a useful alert tool for risk-aware traders.
- Can be confirmed with other tools: Combining it with ATR, volume, RSI, or MACD can improve signal quality and reduce decision errors.
Disadvantages and Limitations of the Megaphone Pattern
The main drawbacks of the Megaphone Pattern include:- High risk of fake breakouts: Because volatility is extreme, breakouts are often misleading and can trigger early entries and unnecessary losses.
- Difficulty identifying the full structure: Many traders, especially on lower timeframes, struggle to draw correct diverging lines and misread the pattern.
- High risk without proper position sizing: With a wide range, skipping a clear stop-loss can lead to large drawdowns and rapid account damage.
- Less common in low-volatility markets: It usually forms during economic uncertainty or major news events, and it rarely appears during calm or steady trends.
Pro Tip:
Even correct Megaphone breakouts can swing deeply against you before continuation. Smaller position sizing often improves long-term results more than trying to perfectly time entries.
Q: Why do traders emotionally struggle with Megaphone Patterns?
Ar: Expanding swings amplify fear and greed simultaneously, causing overreaction, revenge trading, and premature exits if emotions are unmanaged.
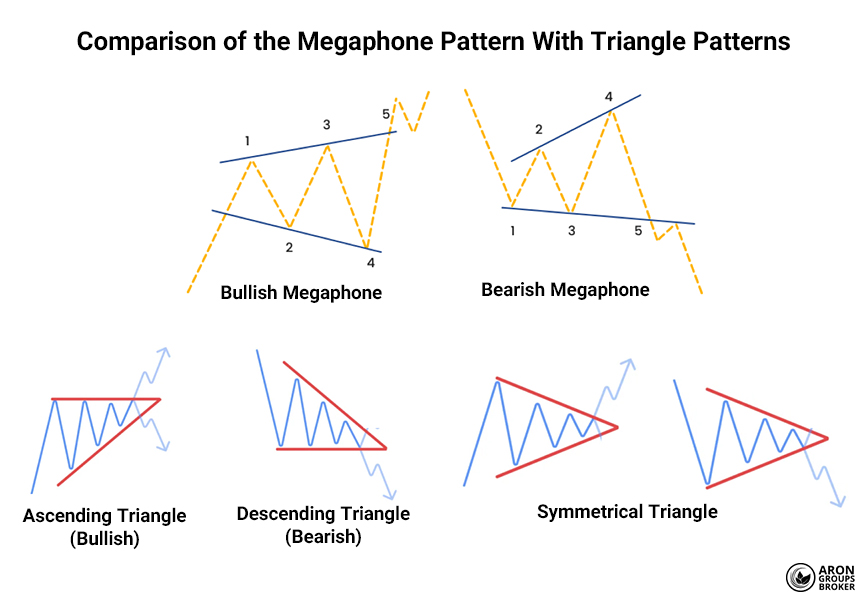
How the Megaphone Pattern Differs From Other Triangle Patterns
The Megaphone Pattern (inverted symmetrical triangle) differs from symmetrical, ascending, and descending triangles in key ways.
These differences can be grouped into five major areas.
1) Geometric Structure
The Megaphone Pattern has two diverging trendlines that spread apart over time, which creates an expanding shape.
Other triangle patterns have converging trendlines that compress price into a tightening consolidation zone.
2) Price Volatility Behaviour
In a megaphone, volatility typically increases, and both highs and lows expand as the range grows wider.
In most triangles, volatility usually decreases as price moves into a narrower, more controlled range.
3) Market Psychology
A megaphone reflects confusion, excitement, and uncertainty, with buyers and sellers repeatedly overpowering each other.
Other triangles often show a calmer “pause” phase, where the market consolidates before the next directional move.
4) Breakout Signal
Megaphone breakouts are often sudden and powerful, driven by a release of built-up volatility and pressure.
Triangle breakouts are usually more predictable and controlled because the market has been compressing into a setup.
5) Placement Within a Trend
The Megaphone Pattern can appear mid-trend or near the end, acting as either continuation or reversal.
Most triangle patterns are more commonly continuation structures that form in the middle of an existing trend.
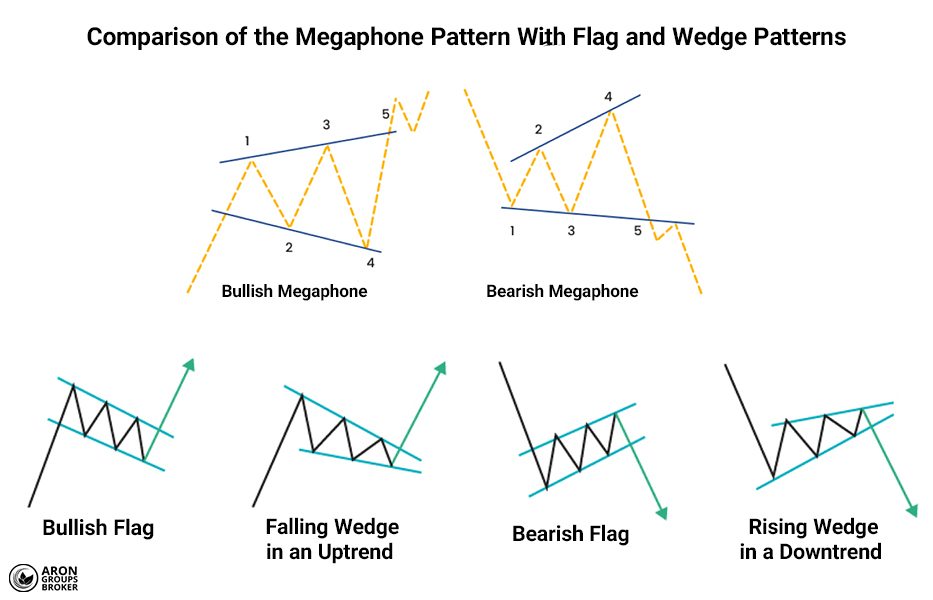
How the Megaphone Pattern Differs From Flag and Wedge Patterns
With its expanding structure and intense price swings, the Megaphone Pattern differs noticeably from flag and wedge patterns. While megaphones often form in high-volatility conditions and may signal either reversal or continuation, flags and wedges look cleaner.
Flags and wedges usually reflect more order and clearer direction within trends, which makes their setups easier to manage.
The main differences across these three patterns include the following areas:
Visual Shape
- Megaphone: Diverging trendlines that expand outward as price swings grow wider over time.
- Flag: A tight, relatively parallel channel that forms as a brief consolidation after a strong move.
- Wedge: Converging trendlines with a steeper angle, creating a narrowing structure toward an apex.
Price Behaviour Inside the Pattern
- Megaphone: A gradual expansion in volatility, with wider swings and more aggressive reversals.
- Flag: Limited, steady oscillations that often move against the main trend during the consolidation phase.
- Wedge: Compressed swings that shrink over time, showing decreasing volatility as pressure builds.
Pattern Function
- Megaphone: Can act as either a continuation or reversal pattern, depending on context and breakout direction.
- Flag: Mostly a continuation pattern that pauses before the trend resumes in the original direction.
- Wedge: Can be continuation or reversal, depending on slope, trend context, and breakout confirmation.
Volatility and Risk Level
- Megaphone: High volatility and higher risk, making it more suitable for swing traders and volatility strategies.
- Flag and Wedge: More controlled volatility, often better for traders focusing on cleaner trend structures.
Volume Behaviour During Breakout
- Megaphone: Breakouts are often accompanied by a sudden surge in volume due to volatility expansion.
- Flag and Wedge: Breakouts more commonly occur with a gradual rise in volume as pressure accumulates.
Pro Tip:
When you are ready to enter a "long" position (buying), consider using a Buy Stop Limit Order. This allows you to enter the trade with much higher precision during volatile moments.
Why Is the Megaphone a Rare but Important Pattern?
The Megaphone Pattern rarely appears on charts, but when it forms, it can strongly signal market instability and a nearby high-risk event.
- Shows a power struggle between buyers and sellers: As highs rise and lows drop, the conflict between forces becomes intense.
- Hints at potential news or crises: It often appears before major economic releases, central bank policy shifts, or political turbulence.
- A caution signal: If identified correctly, traders can avoid bad entries by using stop-loss rules and confirmation tools.
- An opportunity for swing traders: When managed well, the pattern’s violent internal swings can be profitable for professionals.
Conclusion
The Megaphone Pattern is complex and carries more risk than typical patterns. However, for traders who understand technical tools, it can be a very profitable setup.
Unlike most patterns where price moves become smaller (converging), the Megaphone pattern expands. This makes it challenging to analyse, but rewarding for those who follow a disciplined plan.
Tips for Success:
- Identify Early: Spotting the pattern early helps you prepare for the big price swings.
- Use Confirmation Tools: Always use secondary technical indicators to confirm a move before you trade.
- Manage Your Risk: Without careful analysis, this pattern can lead to “fakeouts” and unnecessary losses.
To succeed with this pattern, a trader must have a deep understanding of market behaviour and remain calm during sudden price spikes. Keeping your emotions in check is just as important as the chart itself.