


The TQQQ Challenge is a strategy where investors aim to grow small accounts quickly by regularly buying ProShares UltraPro QQQ (TQQQ).
This fund targets three times the daily performance of major technology stocks in the Nasdaq-100.
Leverage can amplify gains in rising markets but equally magnifies losses. This article explains TQQQ, the challenge’s mechanics, historical results, practical strategies, and critical risks in simple language. Read to the end for a clear view of whether this high-risk approach suits you.

- The TQQQ Challenge is a regime-dependent strategy; its success relies more on trend strength and volatility structure than on simple direction.
- In leveraged ETFs (LETFs), long-term outcomes are shaped more by volatility decay (beta slippage) and sequence risk than by raw index performance.
- Comparing TQQQ vs QQQ long term requires evaluating survivability and capital stability, not just peak return potential.
- Sustainable participation demands structured allocation, defined drawdown protection, and realistic expectations for risk and return.
The TQQQ Challenge Explained: Origins, Logic and Market Appeal
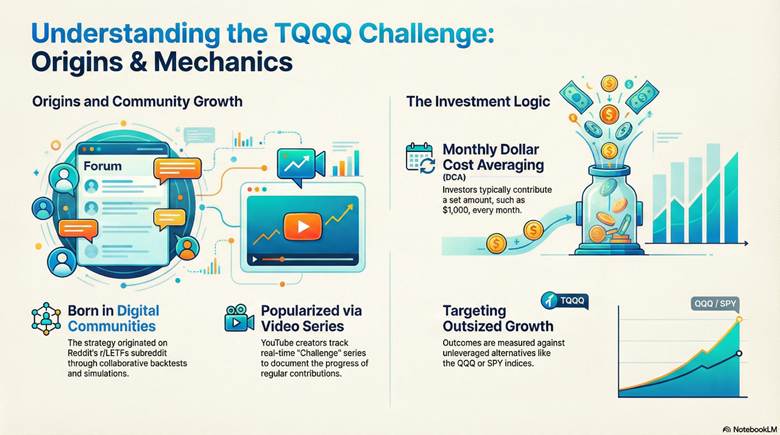
The TQQQ Challenge originated from online trading communities, particularly the Reddit subreddit r/LETFs (Leveraged ETFs), where enthusiasts discuss long-term strategies utilising leveraged ETFs, such as ProShares UltraPro QQQ (TQQQ).
Discussions often feature backtests and simulations of monthly investments, sometimes called dollar cost averaging (DCA), to achieve outsized growth over decades.
YouTube channels have popularised the concept further, with creators running “TQQQ Challenge” series that track regular contributions (e.g., $1,000 monthly) and compare outcomes against unleveraged alternatives like QQQ or SPY.
The Concept of Accelerated Account Growth
This approach focuses on compounding through amplified daily returns. In strong bull markets, 3x leverage can turn modest regular investments into substantial portfolios faster than traditional indexing.
Participants share projections showing potential multi-fold growth, appealing to those with limited starting capital who seek quicker wealth building.
Capital Efficiency and the Leverage Attraction
Small accounts benefit from leverage because it provides greater market exposure without needing large sums upfront. Instead of buying $30,000 of Nasdaq-100 exposure directly, an investor can achieve similar directional impact with far less capital via TQQQ.
This efficiency draws traders aiming to maximise returns on limited funds, though it increases vulnerability to downturns.

Key Insight:
Leverage magnifies both gains and losses equally. A small account can grow rapidly in rising markets but face severe erosion during volatility or corrections.
Social Trading and the Rise of Challenge Culture
Social media has fuelled a “challenge” mentality, where traders post progress updates, backtests, and monthly recaps. This creates community motivation, with participants committing to consistent contributions and sharing results publicly.
The format encourages discipline while highlighting real-world performance through major events like crashes and recoveries.
According to ProShares official documentation, TQQQ seeks daily 3x results and is designed for short-term use, not long-term holding.
Warning:
Leveraged products like TQQQ carry substantial risk of loss, especially over extended periods due to daily resets and volatility. Consider your risk tolerance carefully.
Understanding TQQQ: Structure, Leverage and Index Exposure
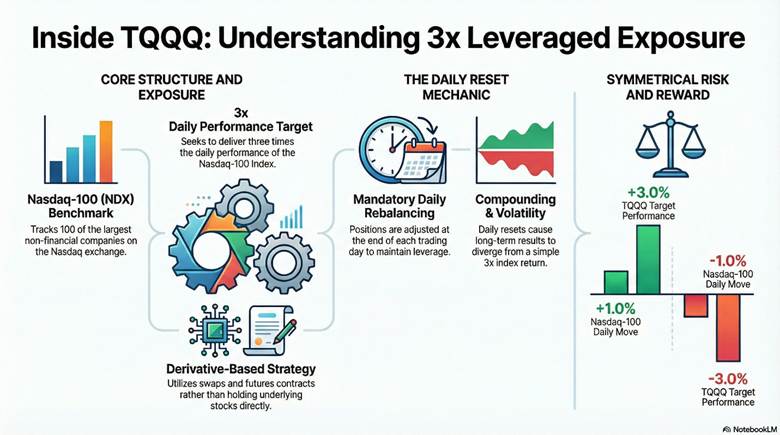
ProShares UltraPro QQQ (TQQQ) is a leveraged ETF (LETF) that seeks to deliver three times the daily performance of the Nasdaq-100 Index.
The fund uses derivatives such as swaps and futures contracts instead of holding underlying stocks directly.
This structure provides efficient amplified exposure but introduces unique mechanics that affect longer-term results. Traders must carefully assess allocation, including determining portfolio risk, when incorporating such instruments.
How ProShares UltraPro QQQ Tracks the Nasdaq 100
TQQQ achieves its leverage through financial instruments like swap agreements and futures. These contracts allow the fund to target 3x the daily move of the Nasdaq-100 without purchasing all component shares.
The fund primarily uses derivatives to seek results that correspond to three times the daily performance of the Nasdaq-100 Index, before fees and expenses.
Daily Reset Mechanics in Leveraged ETFs (LETFs)
Each trading day ends with a reset of leverage. The fund rebalances its holdings to maintain exactly 3x exposure for the following day.
Daily compounding means that over time, TQQQ’s return will likely differ significantly from simply ‘3x’ the long-term index return.
According to Investopedia, leveraged ETFs rebalance daily by adjusting derivative positions, ensuring the leverage multiple applies only to that day’s index return.
Important Note:
Leveraged ETFs are complex and designed primarily for short-term trading. Extended holding periods may produce results that deviate significantly from expected multiples.
Exposure Mapping to Nasdaq 100 (NDX / USTEC)
The Nasdaq-100 Index (NDX) tracks 100 of the largest non-financial companies on the Nasdaq exchange, heavily weighted toward technology.
TQQQ provides direct 3x daily exposure to this index, often referenced alongside symbols like USTEC in certain trading platforms for similar Nasdaq-based instruments.
A 1% daily rise in NDX targets a 3% gain in TQQQ (before fees). Conversely, a 1% decline aims for a 3% loss.
Did You Know?
A single volatile day can wipe out weeks of gains due to 3x amplification.
Q: How does the daily reset affect holding TQQQ over multiple days?
A: The daily reset means TQQQ compounds are based on each day’s performance separately. For example, if the Nasdaq-100 rises 5% on day one (TQQQ targets +15%) and falls 4.76% on day two (back to start for NDX), TQQQ would target -14.28% on day two, ending lower overall due to the mathematical effects of compounding on a leveraged basis.
The Mathematics of Leverage: Compounding, Decay and Path Dependency
Leveraged ETFs such as TQQQ introduce mathematical effects from daily resets and compounding. These include volatility decay (beta slippage), return distortion, and path dependency.
Over time, they can cause performance to deviate from simple multiples of the underlying index. Grasping these dynamics aids in understanding risk and return in amplified strategies.
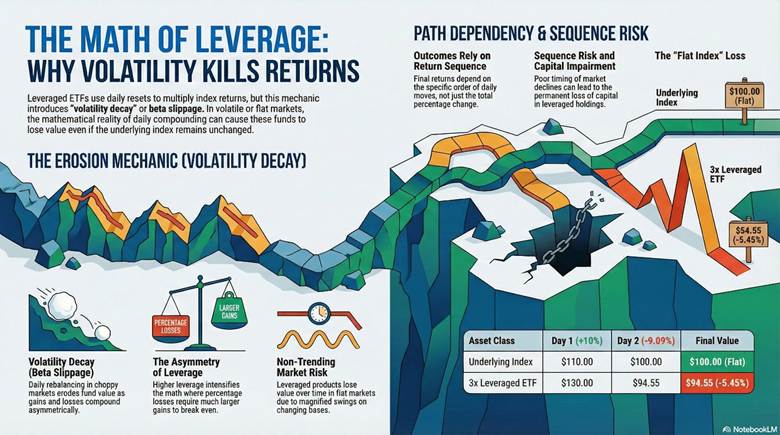
Volatility Decay (Beta Slippage) Explained
Volatility decay (beta slippage) occurs when daily rebalancing in choppy markets erodes value. Gains and losses compound asymmetrically at higher leverage.
In flat but volatile periods, the underlying index may end unchanged. Yet the leveraged ETF often finishes lower due to magnified swings on a changing base.
According to GraniteShares, volatility decay arises from the daily reset, causing leveraged products to lose value over time in non-trending markets.
Why Compounding Distorts Leveraged Returns
Daily compounding multiplies returns on the prior day’s value. A large gain followed by a proportional loss leaves less capital for recovery.
This effect intensifies with leverage. Percentage losses require larger percentage gains to break even.
According to Investopedia, compounding in 3x ETFs can amplify risks, leading to returns that fall short of expected multiples over extended periods.
Warning:
In choppy markets, daily rebalancing can compound losses, even if the index later recovers.
Path Dependency and Sequence Risk in LETF Performance
Path dependency means outcomes rely on the order of daily returns, not just the total change. Different sequences with the same average can yield varied results.
This creates sequence risk. Poor timing of declines can permanently impair capital in leveraged holdings.
| Scenario (2 Days) | Underlying Index (e.g., QQQ) | 3x Leveraged (e.g., TQQQ Target) | Ending Value (from $100) |
|---|---|---|---|
| Day 1: +10% | $110 | +30% → $130 | - |
| Day 2: -9.09% | Back to $100 | -27.27% → ~$94.55 | Index: $100 TQQQ: $94.55 (loss despite flat index) |
Key Insight:
Volatility decay (beta slippage) can turn a flat market into a losing proposition for leveraged holdings.
Trading leveraged products involves substantial risk of loss of capital. Consider whether you understand how these products work before investing.
Structural Risk Assessment: Is TQQQ Safe?
Many investors ask: Is TQQQ safe? The clear answer is no. TQQQ is not safe for most investors, particularly over long periods or without hedging. Its 3x leverage amplifies losses dramatically during market downturns.
Historical events and structural features highlight significant dangers. Effective drawdown protection becomes essential for anyone considering exposure.
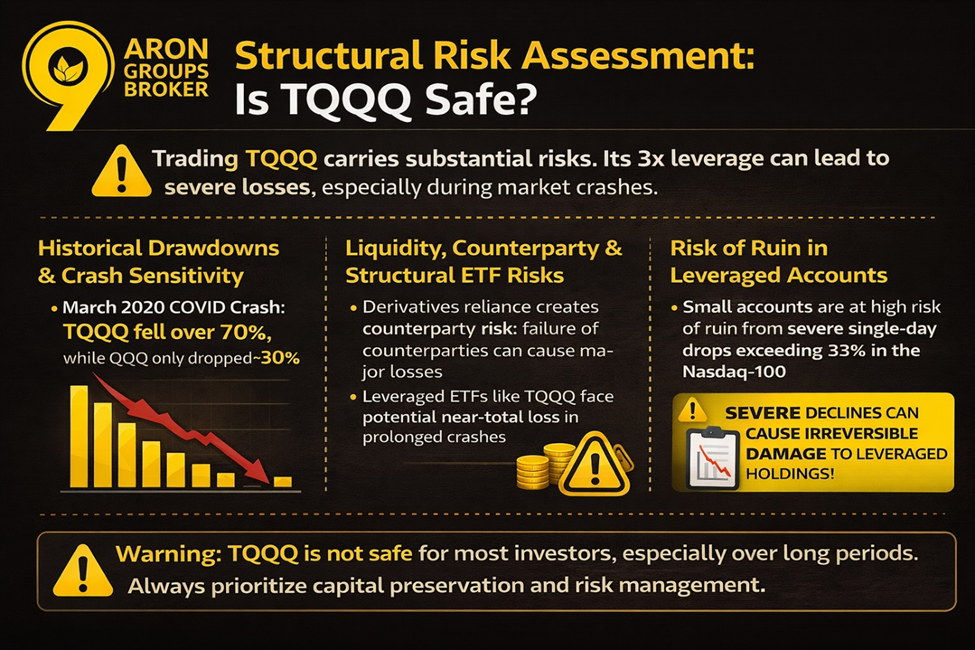
Historical Drawdowns and Crash Sensitivity
TQQQ experiences extreme declines in bear markets. Leverage triples the impact of index drops, leading to rapid value erosion.
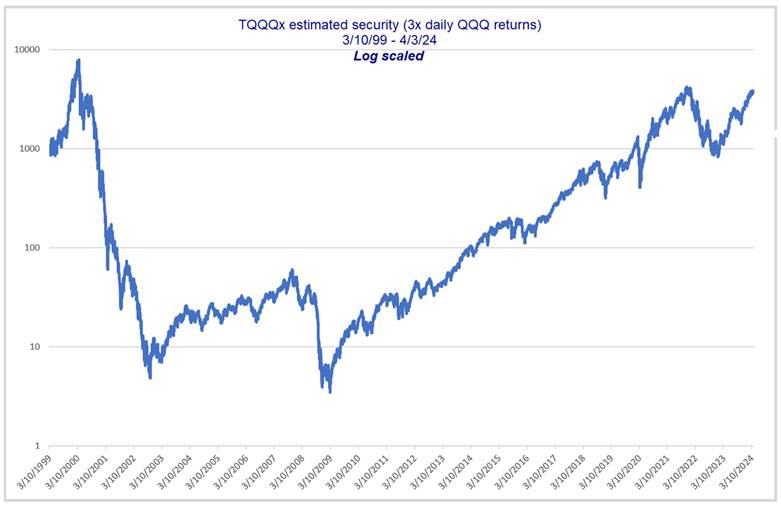
During the March 2020 COVID-19 crash, TQQQ fell approximately 70–80%, while the unleveraged QQQ dropped around 25–30%. The 2022 bear market saw TQQQ decline by over 80%.
According to Seeking Alpha, TQQQ dropped about 66% in the early 2020 downturn, far exceeding QQQ’s losses.
Note: In March 2020, TQQQ fell by over 70% while QQQ fell ~30%.
Liquidity, Counterparty, and Structural ETF Risks
TQQQ generally maintains high liquidity as a popular ETF. However, structural risks persist from its reliance on derivatives.
Counterparty risk arises from swap agreements used to achieve leverage. If a counterparty defaults, though rare and mitigated by collateral, it could affect performance. Daily rebalancing also adds friction in volatile conditions.
leveraged ETFs like TQQQ face potential near-total loss in prolonged crashes, underscoring structural vulnerabilities.
Risk of Ruin in Small Leveraged Accounts
Small accounts face heightened danger. A severe single-day drop exceeding 33% in the Nasdaq-100 could theoretically wipe out a 3x position entirely.
Without careful sizing and safeguards, volatility can lead to permanent capital loss. Determining portfolio risk and applying strict risk management helps mitigate this threat.
Trading leveraged products involves substantial risk of loss of capital. Consider whether you understand how these products work before investing.
Warning:
Severe market declines can cause irreversible damage to leveraged holdings. Always prioritise capital preservation.
Q: Is TQQQ safe for beginners or small accounts? No. Beginners and those with limited
A: capital should avoid TQQQ due to its extreme volatility and potential for rapid, substantial losses. Leverage magnifies downturns, increasing the risk of ruin. Sources consistently recommend it only for experienced traders with robust drawdown protection and short-term horizons.
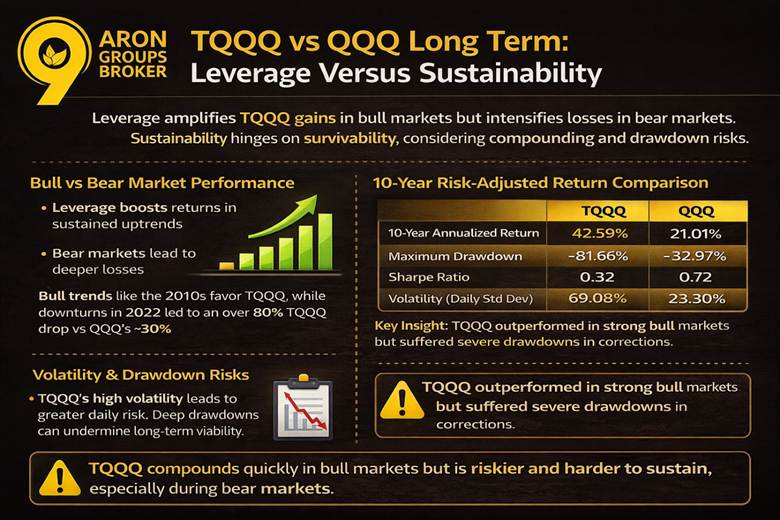
TQQQ vs QQQ Long Term: Leverage Versus Sustainability
When traders compare QQQ long term performance with leverage, the key question is sustainability. TQQQ can compound faster in extended bull trends, yet it can suffer deeper drawdowns in volatile regimes.
This makes TQQQ vs QQQ long-term less about “which is higher,” and more about “which is survivable.” A sensible comparison starts with your expected return assumptions, then stress-tests what happens during bear markets.
Performance Across Bull and Bear Cycles
TQQQ shines in strong upward trends. Leverage compounds gains dramatically when the Nasdaq-100 rises consistently.
In bull cycles, such as much of the 2010s and post-2020 recovery, TQQQ has far outperformed QQQ. Sustained trends minimise decay effects.
Bear markets expose vulnerabilities. Declines triple, leading to rapid capital erosion. The 2022 downturn saw TQQQ drop over 80%, compared to QQQ’s roughly 30% loss.
According to PortfoliosLab, TQQQ’s performance excels in trending bull markets but suffers disproportionately in corrections.
Risk-Adjusted Return Comparisons
Raw returns favour TQQQ over extended bull periods. Over the past 10 years, TQQQ achieved an annualised return of approximately 42.59%, versus QQQ’s 21.01%.
Risk-adjusted metrics tell a different story. Higher volatility drags down measures like the Sharpe ratio.
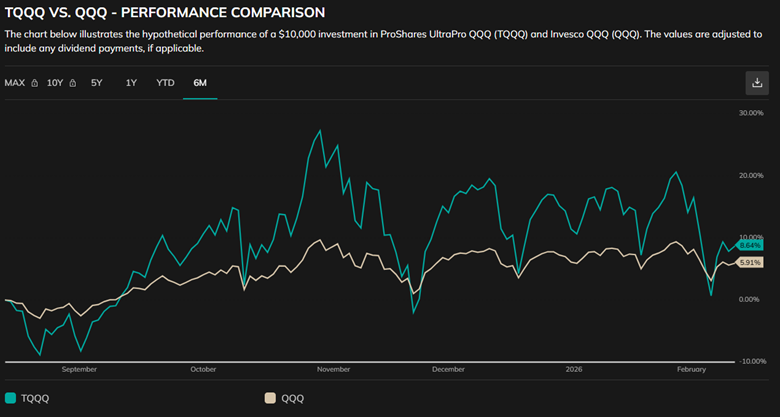
(Data as of February 2026; source: PortfoliosLab)
| Metric | TQQQ | QQQ |
|---|---|---|
| 10-Year Annualised Return | 42.59% | 21.01% |
| Maximum Drawdown | -81.66% | -82.97% |
| Sharpe Ratio | 0.32 | 0.72 |
| Volatility (Daily Std Dev) | 69.08% | 23.30% |
Long-Term Holding Survivability Analysis
Extended holding in TQQQ carries survivability challenges. Daily resets and compounding can erode value in non-trending markets.
Since its inception in 2010, TQQQ has delivered impressive cumulative gains in a generally bullish environment. Volatile or range-bound periods, however, amplify decay and extend recovery times.
ProShares warns that results over periods longer than one day may deviate significantly from the target multiple.
Q: Is TQQQ better than QQQ over the long term?
A: No single answer fits all. TQQQ has provided higher absolute returns in sustained bull markets since 2010. However, greater volatility, deeper drawdowns, and poorer risk-adjusted metrics make it less suitable for most long-term investors. QQQ offers more consistent, sustainable growth with a lower risk of permanent loss.
Key Insight:
Even in bull-dominated decades, TQQQ's path dependency means the sequence of returns heavily influences survivability.
Strategy Construction in the TQQQ Challenge
Building a structured plan is essential when using leveraged exposure. The difference between success and failure often lies in rules, not predictions. In the TQQQ Challenge, investors typically choose between systematic frameworks and discretionary market timing approaches. Both aim to manage volatility, but they handle risk very differently.
Market Timing vs Systematic Exposure
Market timing involves signals like moving averages or trend indicators to enter or exit TQQQ positions. Proponents argue it avoids major drawdowns and captures upside selectively.
Systematic exposure follows fixed rules, such as consistent holding or rebalancing schedules, without emotional overrides.
Historical simulations show timing can outperform in certain cycles but often underperforms simple systematic holds due to missed rallies.
According to Proactive Advisor Magazine, leveraged ETFs like TQQQ are sensitive to entry points, making pure market timing challenging over daily reset periods.
Key Insight:
In leveraged strategies, avoiding large drawdowns is often more important than capturing every rally.
Dollar Cost Averaging (DCA) in Leveraged ETFs
Dollar cost averaging (DCA) means investing a fixed amount at regular intervals. Many retail investors apply DCA to leveraged ETFs, assuming the method reduces timing risk.
However, leveraged products behave differently from traditional index funds. Daily resets and volatility decay can reduce the smoothing benefit of DCA during prolonged sideways markets.
According to The Wall Street Journal, leveraged ETFs are generally designed for short-term tactical use, not long-term accumulation strategies.
If markets trend upward strongly, DCA into a leveraged ETF may compound well. In volatile environments, repeated buying can increase exposure before major drawdowns.
The key difference lies in volatility structure, not just direction.
Pro Tip:
Smart DCA vs. Blind DCA Never Blind DCA into a falling knife with TQQQ.
Blind DCA: Buying every month regardless of price. (Dangerous in a bear market).
Smart DCA: Only buying when price is above the 200-Day Moving Average. If price is below, hold cash.
Scaling Frameworks in Volatile Markets
Scaling frameworks aim to adjust exposure gradually rather than entering fully at once. This reduces concentration risk during uncertain phases.
Common scaling rules include:
- Allocating capital in stages tied to volatility levels
- Increasing exposure after confirmed breakouts
- Reducing size during high volatility spikes
Risk-based scaling often works better than fixed percentage allocations. Many traders use tools such as a position size calculator to determine appropriate capital exposure per trade.
Q: Is dollar cost averaging a safe strategy for the TQQQ Challenge?
A: Dollar cost averaging (DCA) can spread risk and capture long-term growth in trending markets. However, in leveraged ETFs, it does not neutralise volatility decay or prevent deep drawdowns. Contributions during crashes amplify losses on a larger scale. Combine it with strict allocation rules and high risk tolerance only.
Execution Risk Management and Capital Protection
Leveraged strategies amplify losses as much as gains. Strong safeguards provide essential drawdown protection. Techniques include disciplined position sizing, automated exits, and hedging overlays to preserve capital during volatile periods.
Drawdown Protection Techniques
Drawdown protection limits the extent of losses from peak to trough. Common methods include trailing stops that lock in gains, periodic rebalancing to cash during high volatility, and diversification across uncorrelated assets.
These approaches help mitigate the impact of amplified declines in 3x products.
Monitoring volatility and reducing exposure in turbulent conditions reduces long-term erosion.
Position Sizing Models for Small Accounts
Small accounts require conservative allocation. Traders often risk only 0.5–1% of total capital per position to survive sequences of losses.
Tools such as a position size calculator determine share counts based on account size, stop distance, and risk tolerance.
This model prevents oversized bets that could lead to rapid depletion.
Key Insight:
Proper position sizing is the single most important factor in surviving leveraged trading.
Stop-Loss Structures vs Hedging Overlays
Stop-loss orders automatically exit positions at predefined levels, offering simple drawdown protection without ongoing costs. Trailing variants adjust upward in favourable moves.
Hedging overlays, such as holding inverse ETFs like SQQQ or buying put options, provide partial downside coverage but incur decay and premium expenses.
options overlays can cap losses while retaining upside, though they demand active management. Comprehensive risk management integrates both for balanced defence.
Q&A: How can I best protect a small account in the TQQQ Challenge?
Combine fixed percentage risk (e.g., 1% per entry), wide trailing stops, and occasional hedging with inverse positions. Prioritise sizing rules and avoid adding to losers. These steps enhance drawdown protection without eliminating leverage risks.
Cost Structure and Performance Friction
Costs in TQQQ include explicit fees and implicit drags. These compounds, over time, reduce net returns even in favourable markets. Understanding expense ratio vs swap rates and rebalancing effects informs realistic expectations.
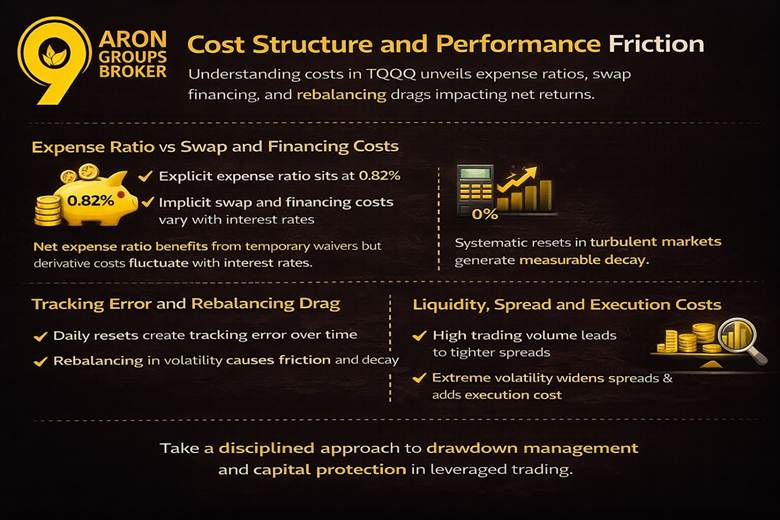
Expense Ratio vs Swap and Financing Costs
The explicit expense ratio stands at approximately 0.82%. Implicit financing costs arise from swap agreements used for leverage. In elevated interest rate environments, these can add several percentage points annually.
The net expense ratio benefits from temporary waivers, but underlying derivative costs vary with rates.
Tracking Error and Rebalancing Drag
Daily resets aim for precise 3x exposure but introduce tracking error over multiple periods. Rebalancing drag occurs when adjusting holdings in volatile conditions, creating friction.
This contributes to performance deviation from theoretical multiples. Systematic rebalancing in non-trending markets generates measurable decay beyond volatility effects.
Liquidity, Spread and Execution Costs
TQQQ benefits from high trading volume, resulting in tight bid-ask spreads under normal conditions. Execution costs remain low for most retail orders.
Extreme volatility can widen spreads temporarily, increasing slippage on large or rapid trades.
Important Note: Cumulative frictions make precise long-term projections challenging.
Market Environment Suitability
TQQQ’s 3x leverage creates varying outcomes across market regimes. Strong trends favour amplified returns, while volatility introduces volatility decay (beta slippage). Performance depends heavily on the prevailing environment.
Bull Market Convexity Advantages
Sustained upward trends provide convexity benefits. Leverage compounds gains exponentially as the base grows.
In prolonged bull markets, TQQQ significantly outperforms unleveraged equivalents. Consistent positive daily returns minimise decay effects.
According to Seeking Alpha, TQQQ excels in trending bull conditions but faces erosion even then if volatility rises.
Sideways Market Decay Risks
Range-bound or choppy markets accelerate volatility decay (beta slippage). Daily resets erode value as gains and losses fail to offset perfectly.
Without clear direction, rebalancing friction compounds negatively over time. Volatility drag causes leveraged ETFs to underperform their multiples in non-trending periods.
Bear Market Survival Probabilities
Declining markets prove challenging. Triple losses lead to rapid drawdowns and extended recovery periods.
Survival requires robust safeguards, as prolonged bears can cause near-total capital impairment.
Warning:
Sideways conditions often produce gradual but persistent erosion through volatility decay (beta slippage).
Psychological Pressures of Leveraged Growth
Leverage affects not only capital but also behaviour. Rapid equity swings create emotional pressure that can distort judgment. Managing psychological risk becomes as important as managing financial risk.
Emotional Volatility Under Equity Swings
Leveraged positions amplify daily account fluctuations. A 5% market move can translate into double-digit account changes.
This creates emotional stress, particularly during sudden reversals. Fear during drawdowns and overconfidence during rallies can lead to impulsive decisions.
Large swings increase the temptation to override preset rules.
Overtrading and Leverage Addiction Cycles
Fast gains can create reinforcement behaviour. Traders may increase size after success, believing momentum will persist.
Losses may trigger revenge trading, where positions are entered to recover quickly rather than follow a plan. This cycle often compounds risk rather than repairs damage.
Building Rule-Based Execution Discipline
Sustainable leveraged trading requires structured rules. Clear entry criteria, position caps, and exit triggers reduce emotional interference.
Developing consistent trading psychology helps separate short-term volatility from long-term planning. Written plans, predefined risk limits, and review routines reinforce discipline.
Key Insight:
The strongest edge in leveraged trading is not prediction — it is emotional control.
Q: How do I handle the stress of large swings in a TQQQ position?
A: Accept volatility as inherent. Use techniques like predefined risk limits, regular breaks from screens, breathing exercises, and journaling emotions. Focus on process adherence rather than daily P&L. Seek professional support if swings significantly affect well-being.
Backtesting the TQQQ Challenge
Backtesting helps investors understand how leveraged exposure behaves across different market regimes. Simulations highlight both the explosive upside during bull markets and the severe capital erosion during crashes.
The goal of reviewing historical data is not to predict the future, but to evaluate survivability under stress.
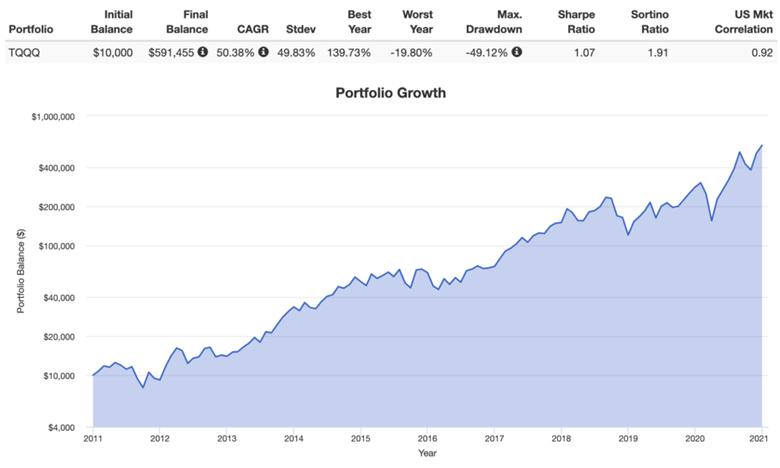
Historical Growth Simulations
During extended technology bull runs, leveraged exposure has historically compounded at a significantly faster rate than non-leveraged index funds. Multi-year uptrends with moderate volatility create favourable conditions for accelerated growth.
Simulations of monthly contributions show that dollar cost averaging (DCA) during persistent bull markets can amplify cumulative gains. However, the outcome depends heavily on entry timing and volatility conditions.
Strong momentum phases reward consistent exposure. Flat or unstable periods distort results due to volatility decay (beta slippage).
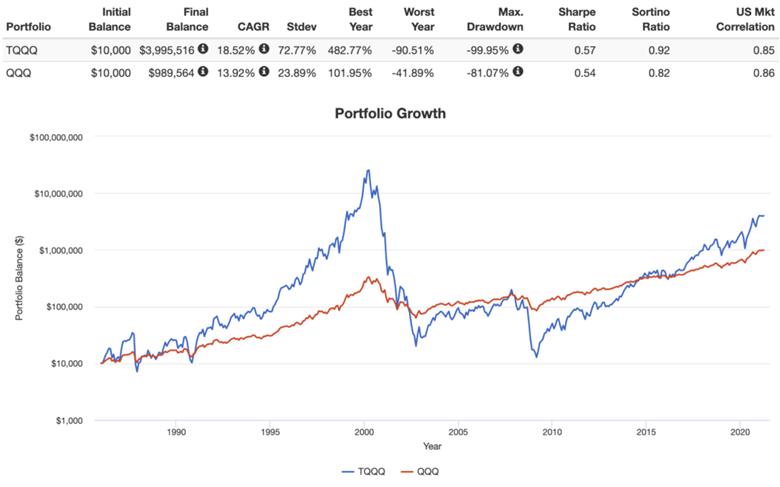
Crash Scenario Stress Testing
Crash simulations reveal the structural weakness of leverage. Sharp market corrections can reduce leveraged positions by 60%–80% in a short period.
Stress testing typically models:
- Sudden 30%–40% index drops
- Multi-month drawdowns
- High-volatility whipsaw periods
The key finding is recovery asymmetry. After large losses, the percentage gains required to break even increase exponentially. A 70% decline requires more than 230% recovery.
Important:
Backtests perform best during bull cycles and worst during crash simulations. Survivability matters more than peak return.
Benchmarking vs Non-Leveraged Strategies
Comparing leveraged exposure to standard Nasdaq tracking funds provides context. Over strong 10-year bull phases, leveraged returns can appear dramatically higher.
However, volatility-adjusted returns often narrow the performance gap. Maximum drawdown comparisons frequently show significantly deeper declines for leveraged structures.
Benchmarking clarifies the trade-off: higher peak return potential versus lower holding stability.
Backtests also show that combining leverage with strict allocation limits improves risk-adjusted outcomes compared to full capital deployment.
Q&A: Do backtests guarantee similar future results?
No. Backtests show how a strategy performed under specific historical conditions. They do not account for behavioural mistakes, execution errors, or structural changes in volatility regimes. Historical simulations are tools for understanding risk exposure, not promises of repeat performance.
Strategic Suitability: When Does the TQQQ Challenge Make Sense?
The TQQQ Challenge is not universally appropriate. Its structure makes it suitable only under specific conditions. Narrow filters help determine whether the strategy aligns with an investor’s capital, experience, and objectives.
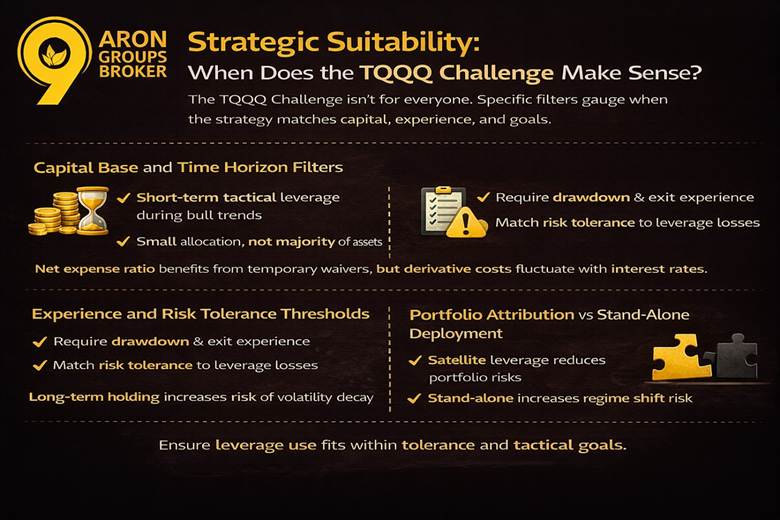
Capital Base and Time Horizon Filters
Leverage magnifies short-term movements. Investors with shorter tactical horizons may use it during strong bull trends.
Long-term, passive holding without adjustments increases exposure to volatility decay.
Small allocations relative to total capital reduce structural risk. Leveraged exposure should rarely represent the majority of investable assets.
Experience and Risk Tolerance Thresholds
Experience plays a central role. Traders familiar with drawdowns, volatility spikes, and disciplined exits are better positioned to manage leveraged exposure.
Risk tolerance must match historical drawdown ranges. If severe losses would trigger emotional liquidation, leverage is misaligned with the profile.
Understanding risk and return trade-offs helps align expectations with reality.
Portfolio Allocation vs Stand-Alone Deployment
Deploying leverage as a satellite allocation often reduces total portfolio volatility compared to full capital deployment.
A blended approach may combine core index exposure with a smaller tactical leveraged sleeve.
Stand-alone deployment increases sensitivity to regime shifts. Diversification reduces the probability that one volatility phase defines the entire outcome.
Key Insight:
The TQQQ Challenge makes sense only when allocation size, experience level, and market conditions align with disciplined execution.
Conclusion
The TQQQ Challenge highlights leverage’s potential for rapid growth in bull markets but underscores extreme risks from volatility decay, daily resets, and drawdowns of over 80%. Is TQQQ safe long-term? No—TQQQ vs QQQ long term comparisons favour unleveraged QQQ long term for steadier, sustainable returns.
Success demands education, disciplined risk management, realistic expected return goals, and strong trading psychology. Beginners benefit from foundational steps like learning how to become a professional trader. Diversified or unleveraged strategies remain more reliable for most.


