


In ICT, liquidity is treated as a market execution feature rather than an assumption about intent. It refers to areas where orders are likely to cluster and where execution is typically easier because more participants are active around the same visible price levels.
This shifts the trader’s focus away from reacting to sudden spikes and towards evaluating what price does after a known liquidity pool is accessed. The sweep is the event. A setup only becomes actionable when the market shows acceptance beyond the level or rejection back into the prior structure, supported by a clear location and timing context.
Risk note: This material is for educational purposes only and does not constitute investment advice. Trading leveraged products carries a high risk of loss.

- Liquidity is a destination. It is not an entry trigger by default.
- A sweep is a transaction event at a known pool. Confirmation is required before execution.
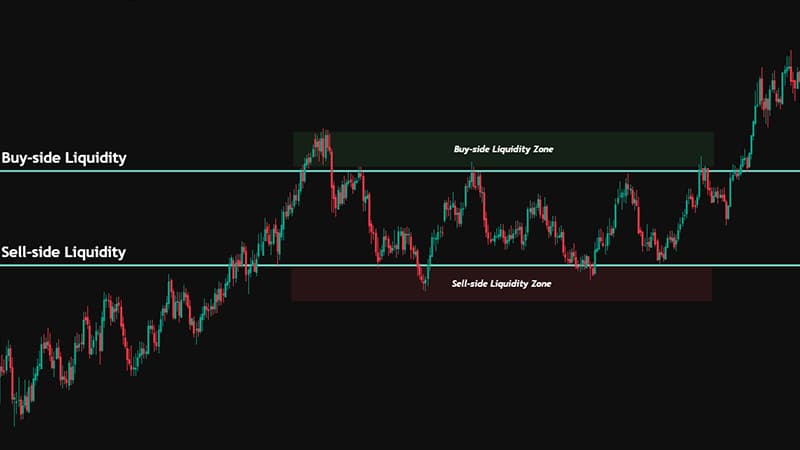
- Buy-side liquidity typically sits above obvious highs where short stops and breakout orders cluster.
- Sell-side liquidity typically sits below obvious lows where long stops and breakout orders cluster.
- Internal liquidity often acts as an intermediate objective. External liquidity is typically the higher-order target.
- Structure, dealing range location, PD arrays, and session timing are primary filters for quality control.
Understanding ICT Liquidity
Liquidity in ICT is defined as the concentration of executable orders around visible price levels.
In practice, this clustering is most apparent above obvious highs and below obvious lows, particularly at equal highs, equal lows, prior day highs and lows, and session extremes.
When price trades into these zones, stop losses and breakout orders are triggered in bulk. This generates a temporary surge in market orders that provides the necessary volume for larger participants to transact efficiently.
The event itself does not imply direction. It simply reflects that the market accessed a pocket of available liquidity.
The objective is not to predict the spike but to evaluate the response.
- If the price sustains acceptance beyond the raid level and continues to build structure, the liquidity event is likely to support continuation.
- If the price rapidly returns to the prior range with a displacement in the opposite direction, the event may signal a liquidity transfer preceding a reversal.
A disciplined approach requires separating the event from the decision. The sweep is observable. The trade is conditional.
Highly visible levels attract algorithmic and discretionary participation alike. Equal highs and equal lows often contain a dense concentration of stop orders because they are structurally clear and widely monitored.
What Is Liquidity in ICT?
In ICT, liquidity is where orders cluster, and execution becomes easier. On the chart, it usually sits above obvious highs and below obvious lows, especially around equal highs, equal lows, and prior session extremes. When the price reaches those areas, stops and breakout orders can trigger together, causing a quick burst of buying or selling. That burst gives larger participants the flow they need to enter or exit efficiently. Your job is not to guess who moved the market. Your job is to map the liquidity pools and read the reaction after they are taken.
Think of liquidity as a public meeting point. The more obvious the level, the more orders tend to build around it. Equal highs and lows attract stops, while prior day and session highs/lows attract traders, algos, and profit targets. As price approaches these zones, spreads can widen, and candles can spike as many orders fire at once. Your edge is not predicting the spike. It is planning the reaction: where acceptance shows strength, and where rejection signals a trap.
ICT Liquidity Concepts: Pools, Voids, and Internal Mechanics
A liquidity pool is a price zone where resting orders are concentrated. Buy-side liquidity forms above price, typically consisting of short stop losses and breakout buy stops. Sell-side liquidity forms below the price, typically driven by long stop losses and breakout sell stops.
A liquidity void refers to a thinly traded area created by strong displacement. In these zones, price may travel quickly due to limited opposing interest. Voids are not objectives in themselves. They are transitional areas between pools.
Price delivery often follows a structured sequence:
- Pool
- Displacement
- Void traversal
- Next pool
From a risk perspective, traders should avoid initiating positions inside voids, where volatility can be elevated, and reaction levels are unclear.
Higher-quality setups often occur after the price reaches a defined pool and demonstrates either acceptance or rejection of the structure.
Internal vs External Liquidity: How They Drive Price Delivery
Internal liquidity refers to near-term objectives within the current trading range. These include minor swing highs and lows, short-term equal highs, and local structure points.
Internal pools are frequently taken as part of normal price development and often serve as intermediate targets.
External liquidity lies beyond the defining boundaries of a range or trend. Examples include major swing highs and lows, prior week highs and lows, or clearly established range extremes.
External pools typically represent higher-order objectives and are more likely to produce meaningful reactions when reached.
A practical distinction can be made through distance and context:
- If external liquidity is relatively far, internal pools may function as incremental magnets.
- If the price is already near external liquidity, internal sweeps may carry limited informational value.
Failure to hold beyond external liquidity, followed by a rapid return inside the prior structure, can indicate that the objective was liquidity acquisition rather than continuation.

Best practice is to map both internal and external pools before execution. Trade selection improves when entries align with higher timeframe objectives rather than reacting to isolated intraday sweeps.
Buy-Side Liquidity in ICT
Buy-side liquidity is the cluster of buy orders above the price. These are typically stop losses on short positions or breakout buy stops.
When price trades above a prior high, those stops convert into market buy orders. This flow can either fuel continuation or provide liquidity for distribution.
Buy-side pools typically form above:
- Equal highs
- Previous day high
- Session highs
ICT Buy-Side Liquidity Explained
ICT buy-side liquidity is the cluster of buy orders above the price, most commonly the stop losses of short positions. When price trades above a prior high, those stops become market buys.
That flow can help a larger seller distribute into strong demand, or it can accelerate price when the market is genuinely moving higher.
Buy-side pools usually sit above the equal highs, the previous day’s high, and the session range high. Because these levels are visible, they attract both stop placement and breakout entries.
Drawing on Buy-Side Liquidity: Market Objectives and Targets
“Draw on liquidity” means price is attracted to the nearest meaningful pool under the right conditions.
To structure this:
- Identify the nearest buy-side pool.
- Identify the next higher timeframe external target.
Map the path between them using PD arrays or inefficiencies.
Location matters:
- A buy-side raid in premium often precedes a drop.
- A buy-side raid at a discount is more likely to continue.
Did You Know?
Sweeps during London or New York open often tend to carry more weight than slow drifts during inactive hours.
Liquidity Pools and Resting Orders Above Price
Resting orders above the price are not only stops. They can be used for take-profit orders on long positions, pending buy stops, and breakout entries. The more obvious the level, the more orders accumulate there.
Treat pools as zones. Spread, volatility, and stop placement variability mean the raid often overshoots slightly. Because of that, the sweep itself is not the entry.
The entry is based on how the price reacts after the pool is taken: acceptance and continuation, or rejection and reversal.
Example: Buy-Side Liquidity Sweep at Equal Highs
Price form equal highs during Asia. Many traders short the second high and place stops above it.
During the London open, price rallies aggressively, trades through the equal highs, triggers stops, and then immediately closes back below the level.
If price rejects and fails to hold above the swept high, it suggests the sweep was for liquidity rather than continuation.
Sell-Side Liquidity in ICT
Sell-side liquidity is when price triggers a wave of sell orders below obvious lows, often by taking out stops on long positions.
This section shows how to mark those pools, then separate a quick raid and reversal from genuine bearish acceptance.
ICT Sell-Side Liquidity Explained
ICT sell-side liquidity is the cluster of sell orders below the price, commonly the stop losses of long positions.
When price breaks a prior low, those stops convert into market sells. That flow can be used by larger buyers who need sell-side volume to buy into, or it can accelerate a bearish move if the market is genuinely repricing.
Sell-side pools form below the equal lows, the previous day’s low, and the session low. In bullish conditions, sell-side raids often appear as sharp dips that quickly reverse.
Identifying Sell-Side Liquidity Pools Below Price
To identify sell-side liquidity, look for any low that many traders will defend.
Equal lows are the clearest. The prior day’s low is another major magnet because it is watched by day traders and algorithmic models alike.
The approach matters. Compression into a pool often precedes a fast raid. If price breaks a low and then keeps closing below it with strong bodies, that looks less like a raid and more like acceptance.
Stop Hunts and Reversals from Sell-Side Liquidity
A sell-side order concentration is a sharp dip below an obvious low that triggers stops and then reverses higher. However, not every break is a reversal. Confirmation is required.
A structured confirmation often includes:
- Sweep of the low
- Strong close back above it
- Break of a minor internal high
- Retrace into a PD array.
Without these elements, what looks like a liquidity raid may simply be bearish acceptance.
Did You Know?
A genuine reversal usually shows displacement and structure shift. A weak bounce without structure often fails.
Example: Sell-Side Liquidity Sweep Below Equal Lows
Prices form equal lows during the New York morning. Later, it spikes below them, then quickly rejects and leaves a long lower wick. If price reclaims the equal lows and displaces above a nearby swing high, that supports a sell-side sweep and reversal scenario. The next objective can then be mapped as buy-side liquidity, such as the session high.
Liquidity Sweeps and Liquidity Grabs
A sweep is the event, not the trade. The trade depends on what price proves after the sweep. This section clarifies the terms so you stop treating every raid as a reversal and use confirmation instead.
Understanding Liquidity Sweeps in ICT
A liquidity sweep is price trading into a known liquidity pool and taking resting stops/orders. It may then continue or reverse. The sweep itself is only the raid. Its meaning depends on context, timing, and whether the price is accepted beyond the level or rejected back through it.
Liquidity Grab vs Liquidity Sweep: Key Differences
A sweep is an event at the level. A liquidity grab usually implies a sweep that leads to a reversal. So, every grab is a sweep, but not every sweep becomes a grab. The distinction matters because fading every sweep can put you against valid breakouts. Confirmation remains the filter: rejection, displacement, and structure shift.
Purge and Revert: The Logic Behind Liquidity Raids
A purge is a fast move through a liquidity pool that clears stops. A revert is the move back into the prior range after the purge. This often happens when price raids a clear high/low, fails to hold, and returns into an inefficiency, FVG, or another PD array. The purge accesses clustered orders; the revert reflects a failure to hold beyond the raided level and a repricing back into the prior range.
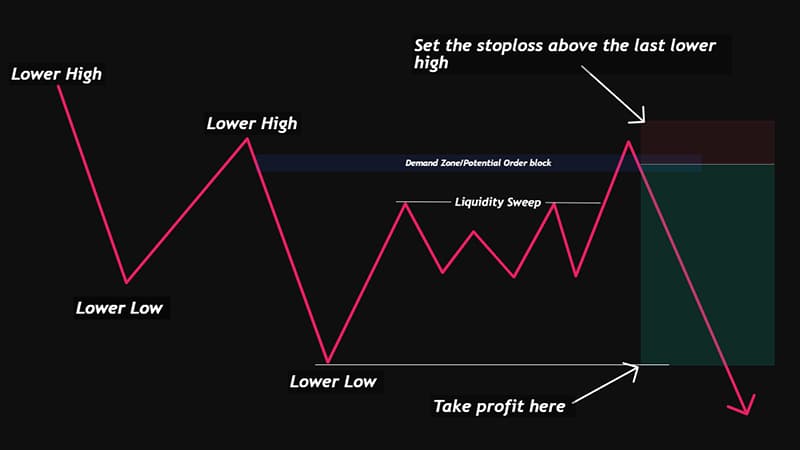
Example: Purge-and-Revert Liquidity Sweep Sequence
At the New York open, the price may rally above yesterday’s high, trigger stops and breakout buys, then fail and close back below the level. It can then drop through an inefficiency and continue towards sell-side liquidity, such as yesterday’s low. Key clues are timing, strong displacement, and failure to hold above the raided level.
ICT Liquidity within Market Structure
Liquidity only becomes tradable when it sits inside a clear market structure. Without structure, a sweep is just a spike. With structure, it can signal either objective completion or likely continuation. This section provides the location filters.
Liquidity Inside the ICT Dealing Range
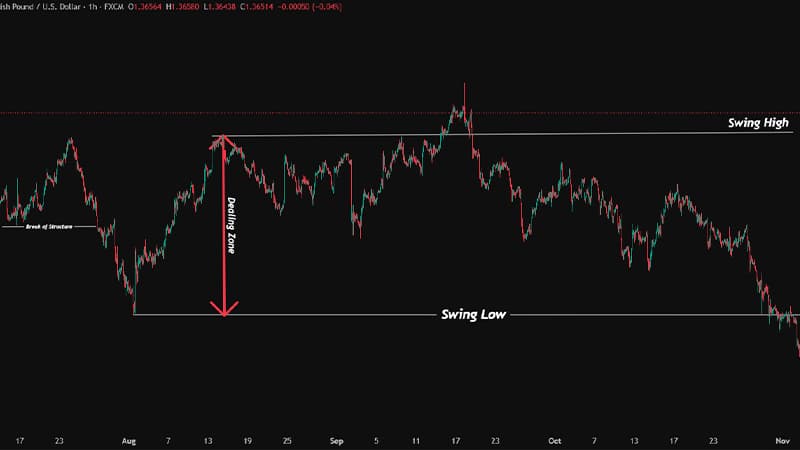
The ICT dealing range is the working range between a key swing low and swing high used to frame a premium and a discount.
Liquidity inside this range provides stepping stones for price delivery. When you mark the dealing range, you can map internal liquidity pools that are likely to be taken before the market reaches the external edge.
The dealing range gives you a location filter, which reduces the temptation to trade every sweep you see.
Premium vs Discount: Where Liquidity Raids Occur
Premium is above the midpoint of the range. The discount is below it.
- In bullish bias, sell-side raids in discount often provide buying opportunities.
- In a bearish bias, buy-side raids in premium often provide selling opportunities.
Keep in mind: This is a contextual filter, not a rigid rule.
Using PD Arrays to Confirm ICT Liquidity Zones
PD arrays are price-delivery tools that help you interpret where price may react: fair-value gaps, order blocks, liquidity voids, and balanced price ranges.
After the sweep has occurred, a PD array provides the entry framework. Instead of entering the raid, you wait for displacement away and then retrace into the PD array. This keeps your model repeatable.
PD arrays must be labelled before the sweep. Mark the fair value gap, an order block, or a balanced price range near the pool.
After displacement, you can trade the retrace with a logical stop in mind.
Time and Multi-Timeframe Liquidity Dynamics
Liquidity behaves differently across sessions and different forex market hours, because participation and volume change.
A sweep during a dead hour can be noisy. A sweep during a major session shift can be the start of the daily move.
This section gives a timing lens and a multi-timeframe workflow.
Liquidity and Session Timing: Asia, London, and New York
Time matters because liquidity is not constant.
- Asia often forms the initial range.
- London tends to provide the first major expansion.
- New York often provides either continuation or reversal, depending on the day.
Many sweeps happen around session transitions because volume increases and range expansion is most likely.
A raid during a quiet mid-session drift may be less meaningful. A raid at a known liquidity window can frame the daily move.
When Liquidity Sweeps Are Most Likely to Occur
Two simple cues help you anticipate sweeps without predicting them:
- Price compresses into a clear liquidity pool and volatility contracts.
- A sharp displacement candle raids the pool, and the price reacts quickly.
Multi-Timeframe Liquidity Analysis: Aligning HTF and LTF Targets
Multi-timeframe trading is when you set larger time-frame goals (like weekly or daily) and use smaller time-frame confirmations to get into a trade.
To find the first part of your multi-timeframe strategy on the larger time frame chart, look for external liquidity levels as follows:
- Prior week high
- Prior week low
- Major Swing Points
Next, once you have found your external liquidity level, switch to the smaller time frame chart and look for internal liquidity areas, such as:
- Equal highs
- Equal lows
- Session Highs/Lows
- Minor structure
Alignment is the edge. If higher-timeframe bias is bullish and price is in a discount, a sell-side raid into a higher-timeframe PD array may offer a strong long.
If higher timeframe bias is bearish and the price is in a premium, a buy-side raid may offer a strong short.
Liquidity vs Retail Order Concentration: Structural Differences
Some retail narratives overemphasise intent. An ICT liquidity read focuses on structure, location, and execution conditions.
ICT Liquidity Sweep Strategy Framework
A framework is a repeatable sequence, not a highlight reel.
The purpose of this section is to turn the ideas into a routine: map, wait, confirm, enter, and manage. It also forces you to define invalidation and targets before you click.
Step-by-Step Sweep Model
- Define higher timeframe bias.
- Mark down the dealing range.
- Identify external liquidity targets.
- Mark internal liquidity pools.
- Wait for the sweep during an active session.
- Demand displacement and structure shift.
- Enter the retrace into the PD array.
- Target next liquidity objective.
Trade Management and Risk Rules for Liquidity Setups
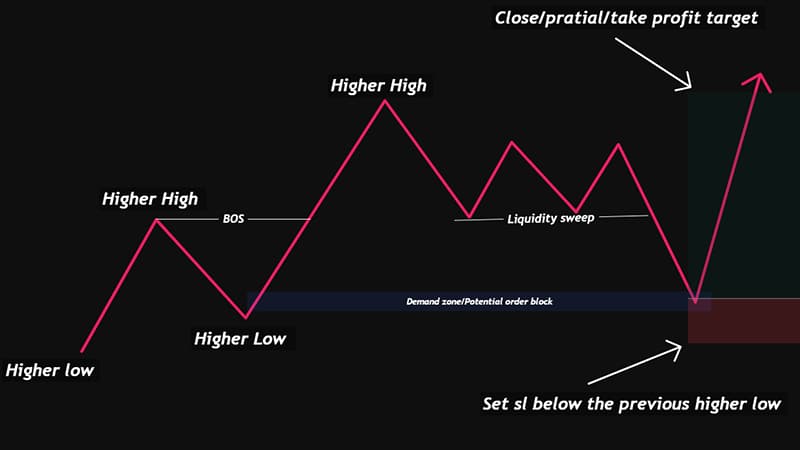
Risk management is what makes a liquidity model tradable in real conditions.
Your stop should sit where the setup is clearly invalidated, not where it merely feels uncomfortable. In most cases, that means beyond the swing that created the sweep or beyond the PD array used for the entry.
Position size should be small enough that a single loss does not affect your decision-making on the next trade. If one loss changes your behaviour, the size is too large.
Targets should be tied to liquidity objectives, not arbitrary numbers. A practical approach is to take partial profit at the nearest internal pool and leave a runner for the next external objective. This reduces pressure and keeps trade management aligned with the liquidity model.
Common Mistakes: Chasing Sweeps and Misreading Liquidity
Use this checklist before you commit to a liquidity setup:
- Is the sweep at a meaningful pool that aligns with the higher timeframe context?
- Did price show displacement and a structure shift after the raid?
- Am I entering a PD array with a clear invalidation point?
- Is my target a defined liquidity objective rather than a guess?
Conclusion
In ICT, liquidity is best treated as a map of likely targets, not an entry signal in and of itself. Buy-side and sell-side pools help you see where the price may go, and sweeps show when those levels have been taken. The real edge comes from the response that follows: continuation if price holds, or reversal if it rejects. When you combine liquidity with structure, timing, and risk control, trading becomes a repeatable process instead of chasing every spike.
FAQ
These questions recur because they expose the same core mistake: treating liquidity as a prediction rather than a location. Use the answers as a fast sanity check when you feel tempted to trade the sweep itself.
Why Does Price Target Liquidity Pools?
Price targets liquidity pools because that is where orders are concentrated, and execution becomes easier. Pools also sit at levels that many participants respond to, which creates repeatable behaviour around those zones.
Is Every Liquidity Sweep a Reversal Signal?
No. Some sweeps are continuations, especially in strong trends. A sweep becomes a higher-probability reversal only when it occurs at a meaningful location, during a relevant time window, and is followed by rejection, displacement, and a structure shift.
How Do You Identify ICT Liquidity on a Clean Chart?
Mark equal highs and equal lows. Mark the prior day’s high and the prior day’s low. Mark session highs and lows. Frame the dealing range and note the premium and discount. Then wait for the sweep and the reaction.
Liquidity Grab vs Stop Hunt vs Sweep: Quick Comparison
| Term | What you see on the chart | Typical meaning in ICT context | Common trader error |
|---|---|---|---|
| Liquidity sweep | Price trades through an obvious high or low | Liquidity is taken to facilitate the next move | Treating the sweep itself as the entry |
| Liquidity grab | A sweep followed by a fast rejection back inside the range | Often purge and revert, or trapping late entries | Fading every breakout without confirmation |
| liquidity raid | A brief raid that triggers clustered stops | Stops provide liquidity, not a guaranteed reversal | Assuming intent without structure and confirmation |


