


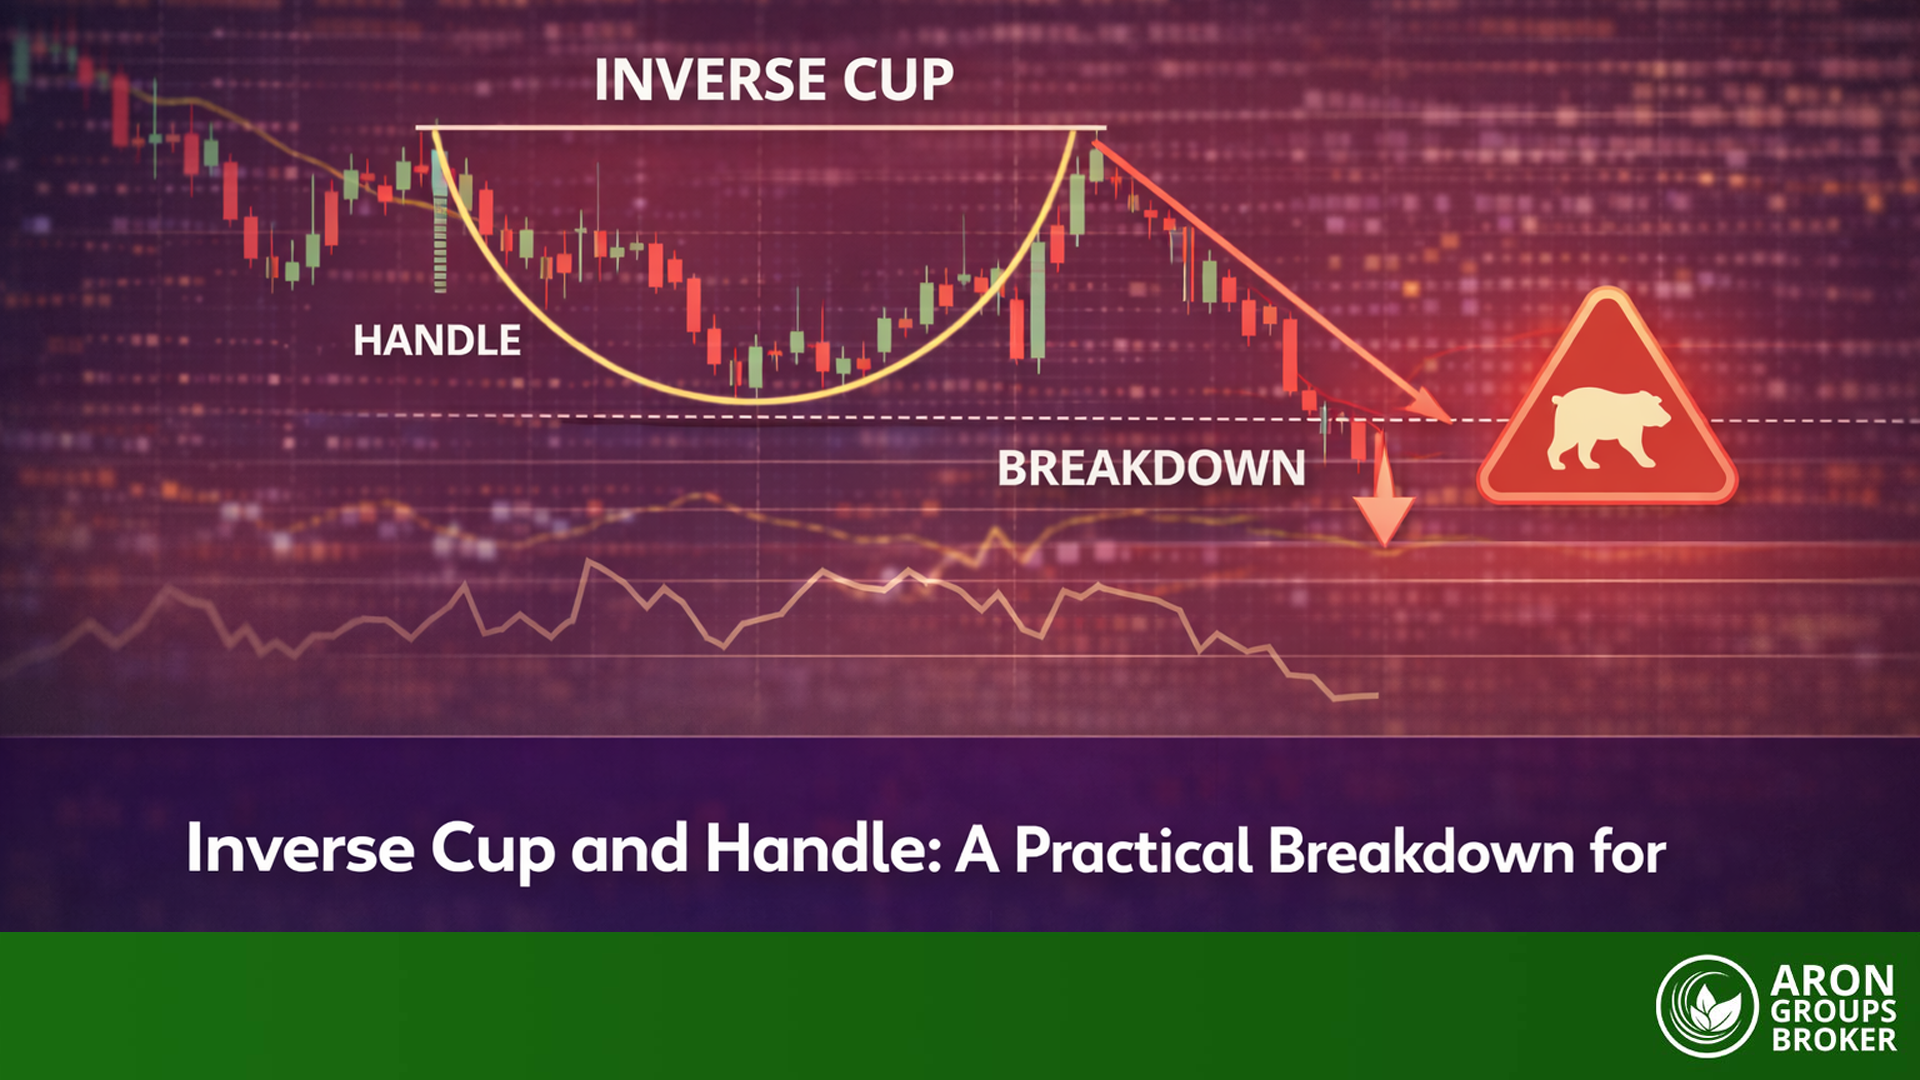


The Inverse cup and handle is a bearish chart pattern. It often signals a support breakdown after the price fails to recover. You usually see a rounded top, then a small pullback (the handle). If price breaks the neckline/support with rising volume, sellers often take control, and a strong drop can follow.
In this guide, you’ll learn how to spot real setups (and avoid a bull trap), where to enter, where to place a stop-loss, and how to estimate the inverse cup and handle pattern target.

- The inverse cup and handle is a bearish chart pattern that appears after an uptrend, signals that sellers are gaining control.
- A high-volume break below the neckline (support) is key to confirming inverse cup and handle pattern.
- Traders typically enter a short position when price decisively breaks below the support neckline of inverse cup and handle pattern.
- Inverse cup and handle pattern target can be estimated by the cup’s depth.
Overview of the Inverse Cup and Handle Pattern
The inverse cup and handle is a bearish continuation or reversal pattern that signals weakening demand and a potential breakdown of support. It reflects a shift from buyer control to growing bearish momentum, often leading to a sharp downside move when confirmed by volume.
What Is an Inverse Cup and Handle Pattern and Why It Matters for Traders
According to Howtotrade, the inverse cup and handle pattern is a bearish setup that often appears after an up-move loses strength. Price forms a rounded top, then drifts lower. After that, you experience a short retracement phase (the handle) that fails near a resistance level (the neckline). When price breaks the neckline/support, Traders watch for volume confirmation (increasing on breakdown) to confirm that the move is real, not a false breakout or a bull trap.
When the price breaks below the neckline/support level, low volume means weak participation. That often leads to a fake breakdown and a quick reversal.
But when volume expands sharply during the breakdown, it signals:
- Strong seller participation
- Institutional involvement
- Real bearish momentum
- Higher probability that the move will continue toward the pattern target.
Why does this matter?
Because it gives traders three clear advantages:
- Defined entry point on support breakdown
- Logical stop-loss placement above the handle high
- Measurable profit target calculation based on cup depth
Example: If gold forms a rounded top near $2,050, pulls back to $2,020 (the handle), and breaks below $2,000 with strong volume, sellers often push it toward $1,950 or lower. This structure turns market hesitation into opportunity.
Inverse Cup and Handle vs Standard Cup and Handle Patterns
A standard cup and handle is usually bullish and breaks above resistance. The inverse cup and handle flips that logic. It breaks below support. Traders who mix them up take the wrong side and become the liquidity.
| Feature | Standard Pattern | Inverse Pattern |
|---|---|---|
| Shape | U-shaped | Inverted U (rounded top) |
| Break Direction | Upward | Downward |
| Momentum | Bullish | Bearish |
Bearish Momentum as a Key Signal in Inverse Cup and Handle
Bearish momentum is characterised by lower highs, weak rebounds, and candles that close near their lows. Watch for a bull trap: the price dips under support, then snaps back and breaks again with greater force.
Q: Is every inverse cup and handle bullish?
A: No. The “Inverse cup and handle bullish” pattern is usually misunderstood. This pattern is typically bearish, unless you trade it as a fakeout, and that’s advanced and risky.
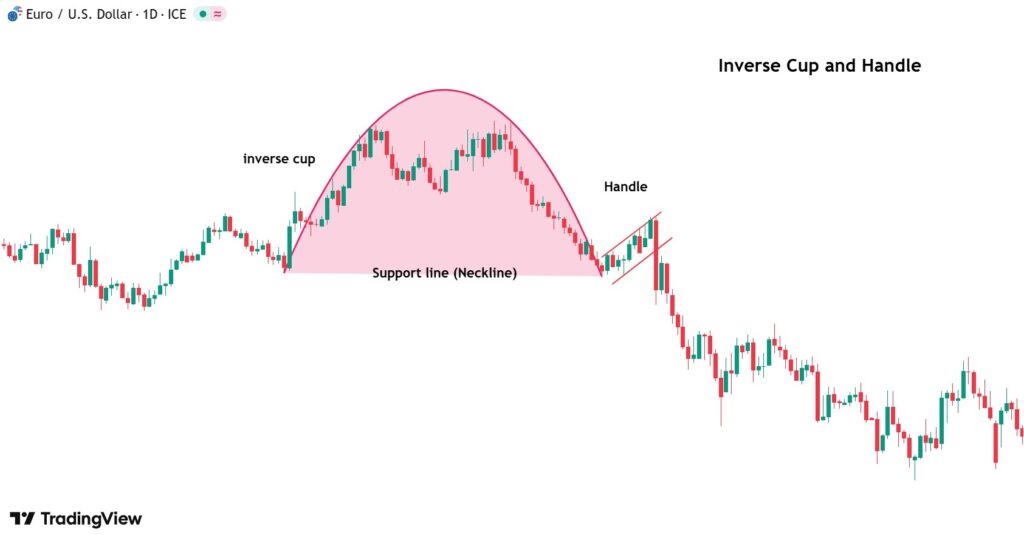
Anatomy of the Inverse Cup and Handle
The inverse cup-and-handle pattern is a bearish chart formation that resembles an upside-down cup with a small handle afterwards. It is essentially the bearish counterpart to the classic cup and handle (which is bullish).
This pattern consists of two main parts:
- a rounded, inverted “cup” where price climbs to a peak, then gradually curves downward,
- a short “handle,” a mild upward retracement following the cup’s decline.
Rounded Top Formation in Inverse Cup and Handle
A rounded top is the defining “cup” shape of the inverse cup and handle pattern. According to Quantvps, during this phase, an existing uptrend begins to lose steam – the price rises to a peak and then slowly curves downward in a smooth, inverted U-shape. Unlike a sudden collapse, this rounded top reflects a gradual shift in market psychology from bullish optimism to bearish caution.
Early on, buyers are still active, but each rally is weaker than the last as sellers quietly increase their presence. The result is a gently arching, rounded top (sometimes called a distribution phase), indicating that bullish momentum is fading.
Volume often tapers off during this topping process, as fewer traders are willing to buy at higher prices.

Key insight: If the top forms too quickly, it is not a valid structure. A proper, rounded top signals controlled distribution before a potential support breakdown.
Retracement Phase of the Handle in the Pattern
After the rounded top, the pattern enters a brief handle phase – a modest upward retracement or consolidation that follows the initial decline. According to FXopen, this occurs when some optimistic buyers step in, believing the down move was temporary. However, the handle’s rebound is typically weak and short-lived, often retracing only a portion of the cup’s decline (commonly about 38%–50% of the drop).
Q: How big should the handle be in an inverse cup and handle?
A: The handle is generally much smaller than the cup. Often it retraces roughly one-third to one-half of the cup’s decline. A shallow, weak handle (with low volume) is ideal, as it signals only a brief pause before the bearish momentum resumes.
Pro Tip:
If the handle’s bounce is very steep or exceeds about 50%–61.8% of the prior drop, the pattern’s reliability decreases.
Neckline Overview and Support Breakdown
The “neckline” in an inverse cup and handle refers to the key support level that forms at the base of the cup (often around the low point of the rounded top, where the handle begins). This is the line connecting the support that held the price up during the cup and handle formation. When the price decisively breaks below this support, it confirms the pattern’s breakdown. A strong support breakdown is the critical signal for traders to act, as it indicates that sellers have overpowered any remaining buyers. Ideally, the breakdown comes on a surge in volume, confirming that bearish force is taking control.
Key insight:
Once support is broken, the former support often becomes a new resistance level (a neckline) if the price attempts to retest it.
Identifying Valid Inverse Cup and Handle Setups
Before executing a trade on an inverse cup and handle breakdown, traders need to ensure the pattern is valid. Identifying valid setups involves confirming early bearish momentum, verifying the support breakdown with volume, being wary of bull traps, and using clear price action signals for confirmation.
Spotting Bearish Momentum Early in Inverse Cup and Handle Trades
Traders should look for early signs of bearish momentum when an inverse cup and handle is forming. According to LuxAlgo, this pattern often appears after a strong uptrend that begins to weaken, signalling a possible shift from bullish to bearish sentiment. A telltale sign is a rounded, gradual peak where each rally in price is weaker than the last – buyers gradually lose control as each bounce fades earlier, forming a rounded top while sellers start to dominate.
Traders can also monitor momentum indicators like the RSI for bearish divergence (lower highs on the indicator even as price makes a higher high), which is a clue that upward momentum is waning. Spotting these early warnings helps a trader anticipate the impending support breakdown instead of being caught in a fading uptrend.
Volume Confirmation on Breakdown Signals
Volume plays a critical role in validating the inverse cup and handle pattern breakdown. In a healthy setup, volume typically decreases during the cup and handle formation and then surges when the support level finally breaks. This spike in volume confirms that bears have taken control, reinforcing that the breakdown is legitimate and not just a minor dip.
Avoiding Bull Traps in Inverse Cup and Handle Patterns
Bull traps occur when a market’s bounce lures in buyers only to reverse lower, “trapping” those bullish traders. In an inverse cup and handle pattern, the brief rally that forms the handle often serves as a classic bull trap. Optimistic traders see the price ticking up and assume the downtrend is over, but the buying is weak, and sellers quickly regain control.
To avoid getting caught in this scenario, it’s important not to jump into long positions during the handle phase without additional proof of a trend reversal. The small handle bounce is usually just a pause before the next sell-off, rather than a true recovery.
Q: What’s the best way to avoid a bull trap when trading an inverse cup and handle?
A: Wait for confirmation that the downtrend has truly ended instead of trusting the temporary “handle” upswing. Focus on verifying the breakdown with volume and price action, and remain patient to avoid chasing false signals.
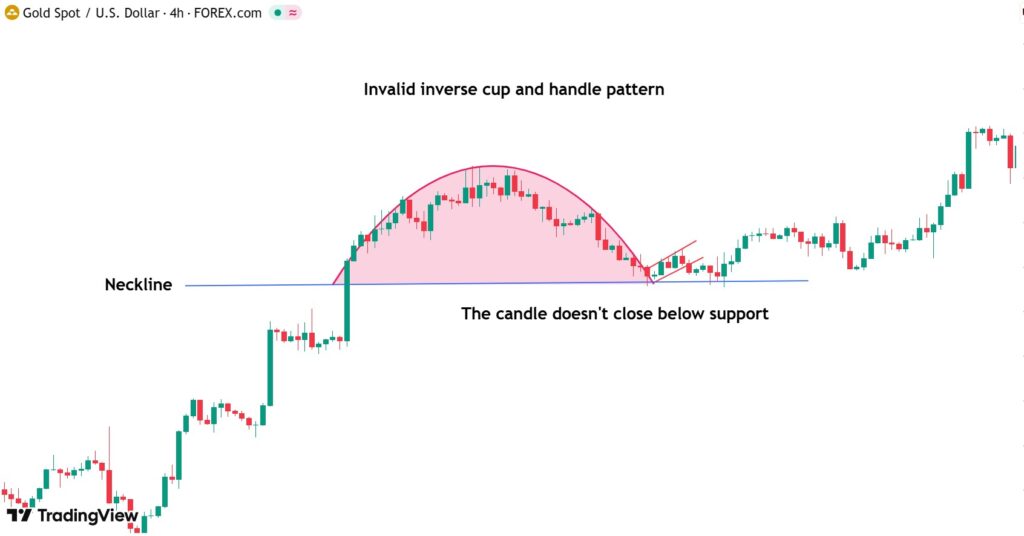
Confirming Breakdowns with Price Action in Inverse Cup and Handle
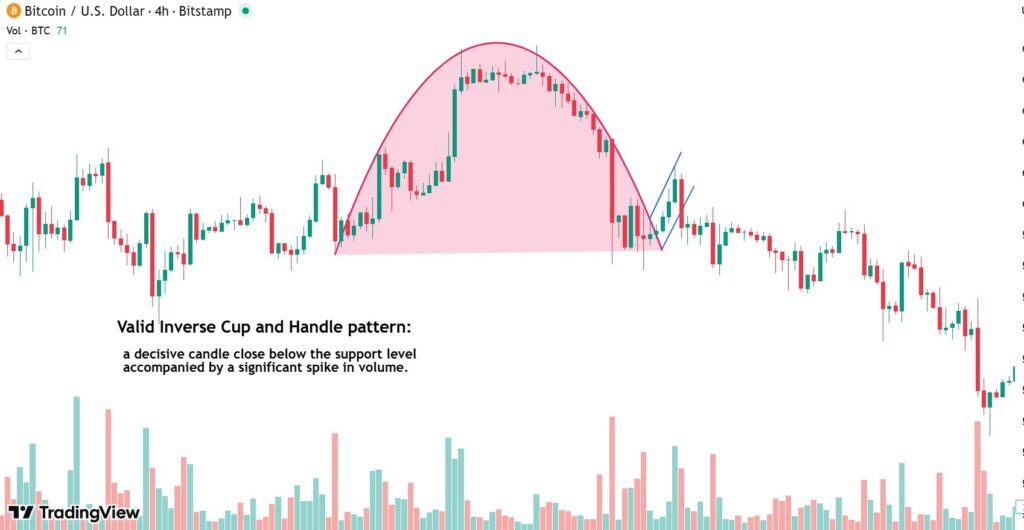
To confirm a breakdown in an inverse cup and handle, look for a decisive candle that closes well below the support level with minimal wick, indicating seller dominance.
Further validation occurs if the price retests the broken support (which now acts as resistance) and reverses downward.
Entry and Stop-Loss Strategies for Inverse Cup and Handle
To trade the inverse cup and handle pattern effectively, traders must establish precise entry points while managing risk.
Entry Points on Support Breakdown or Handle Low
When the price decisively breaks below the main support, traders typically look to enter a short position at this support breakdown, anticipating further downside as the pattern plays out.
- Aggressive traders may enter as soon as the price drops below the handle’s low (the handle’s support), seizing an early position but taking on more risk of a false break.
- Conservative traders prefer to wait for a clear break below the pattern’s main support on a closing basis, ideally confirmed by high volume, before entering short
Stop-Loss Placement Above Handle High in the Pattern
The common strategy is to position the stop-loss just above the handle’s high point in the pattern. The logic behind this placement is straightforward: if the price rises above the handle’s high, the inverse cup and handle pattern is likely failing.
Pro Tip:
When setting the stop, allow a small buffer above the exact handle high to avoid getting stopped out by minor volatility or wicks.
Managing Risk During Volatile Inverse Cup and Handle Breakdowns
Managing risk during a volatile inverse cup-and-handle breakdown is about preparation and quick adaptation:
- Always use stop losses and appropriate position sizes to protect yourself.
- Be on guard for false breakouts by waiting for strong confirmation.
- If a trade signals a false signal, accept the small loss and move on.
- When the trade does go in your favour, actively manage it: trail stops to lock in profits and consider taking partial gains at intervals.
Calculating Targets and Profits in Inverse Cup and Handle
In trading the inverse cup and handle pattern, it’s crucial to set clear profit targets based on the pattern’s geometry.
The following sections outline how to calculate the pattern’s price target, how to use the cup’s depth to plan profit-taking levels, and how to adjust these targets for market conditions and pattern reliability.
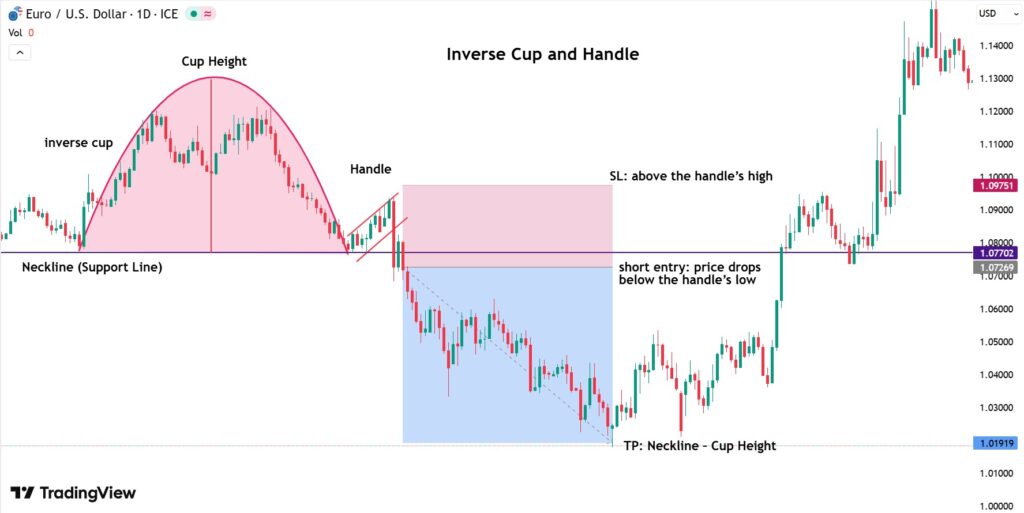
Inverse Cup and Handle Pattern Target Calculation
According to Mondfx, to set the price target, follow the steps below:
- First, determine the vertical distance between the cup’s peak (the highest point of the inverted cup) and its bottom. This height represents the pattern’s full depth.
- Then, take the measured cup depth and project that distance down from the handle’s breakdown point (the price level where the pattern breaks below support) to calculate the bearish profit target.
This gives an expected downside price level based on the pattern’s size.
Inverse cup and handle’s target Formula ≈ Neckline – Cup Height
For example, if the cup’s height is $2,050 and the neckline support is $2,000, the pattern’s depth is $50. The breakdown profit target would be approximately $1,950 (calculated as $2,000 – $50). This measured approach provides a clear, objective exit level and helps maintain a favourable risk-to-reward profile when executed with proper risk management
Using Cup Depth to Estimate Profit Levels
The cup depth defines a realistic maximum profit range for the trade. So, traders commonly set the final profit target at one full cup-depth below the breakdown.
However, rather than holding for the entire move in one go, many traders use multiple profit levels.
For example, one might take partial profits at an intermediate support or halfway to the full target, then let the remainder of the position run toward the full cup-depth target. This approach locks in some gains while still aiming to capture the full expected drop in the pattern.
Adjusting Targets Based on Market Conditions and Pattern Reliability
Traders should adjust profit targets for the inverse cup and handle pattern based on market conditions:
- In strongly bearish markets or when the handle’s retracement is shallow, traders may extend profit targets.
- Conversely, in choppy markets or near major support levels, it is safer to set conservative exit targets.
In addition, since the pattern has a roughly 64% success rate and a 15% failure rate, closely monitoring momentum and maintaining disciplined stop-losses above the pattern’s high is crucial for capital protection.
Common Mistakes in Inverse Cup and Handle Trades
Even with a clear setup, traders often slip up when trading the inverse cup and handle. Below, we discuss some frequent mistakes and how to avoid them.
False Breakdowns and Misleading Signals in the Pattern
A false breakdown, often called a bear trap, occurs when the price briefly drops below the pattern’s neckline but quickly reverses back upward, tricking traders into entering losing short positions. These misleading signals typically happen due to a lack of seller conviction, such as:
- When the breakout occurs on low trading volume,
- Or when traders enter prematurely before a candle closes below support.
Market noise in choppy conditions can also create momentary dips that mimic genuine breakdowns.
To avoid these traps, it is crucial to wait for confirmation: a real breakdown is characterised by a decisive candlestick close below the support level, accompanied by a significant spike in volume. In contrast, timid moves or those without volume support are often false alarms, making patience essential for verifying the signal.
Rounded vs V-Shaped Cup Errors in Inverse Cup and Handle
Not every dip or peak qualifies as a proper cup and handle. A common mistake is misidentifying the shape of the “cup.” The inverted cup portion should form a rounded top, indicating a gradual reversal of trend. If the price instead makes a sharp inverted V-shaped top, the pattern is likely invalid. A V-shape means the price shot up and then dropped abruptly, without the steady curve that characterises a true cup.
Comparison of Rounded Top vs V-Shaped Top
| Feature | Rounded Top (Proper Cup) | V-Shaped Top (Invalid Pattern) |
|---|---|---|
| Shape & Speed | Develops slowly into an upside-down "U" shape, forming a smooth curve. | Forms abruptly; price spikes up and then crashes down quickly (a sharp V-turn). |
| Market Sentiment | Reflects a gradual shift from bullish to bearish sentiment as buying momentum fades. | Indicates a sudden reversal, often driven by a single panic sell-off or news shock (no gradual transition). |
| Visual Appearance | Shows a dome-like, rounded peak on the chart. | Displays a pointed, jagged peak with virtually no rounding at the top. |
| Underlying Behavior | Implies an orderly transfer of control: buyers are gradually losing strength while sellers slowly gain dominance. | Lacks any true rounding or consolidation period – it’s a swift reversal without the distribution phase. |
| Pattern Validity | Considered a valid and reliable “cup” component of an inverse cup-and-handle formation. | Unreliable as a pattern; a handle following a V-top does not form a valid inverse cup and handle (the setup is essentially invalid). |
Ignoring Volume Confirmation in the Handle Phase
A big mistake traders make is ignoring volume during the handle and breakdown phases. In a healthy pattern, volume typically dips during the handle formation (the market is catching its breath) and then rises sharply on the breakdown below support. If you overlook these volume cues, you risk trading on a weak signal.
Conclusion
The inverse cup and handle pattern offers traders a clear bearish setup when momentum shifts from buyers to sellers. It represents a failed uptrend (a rounded top) followed by a weak bounce (the handle), culminating in a breakdown of support. When confirmed by strong volume, this pattern provides a defined entry point at the support break, a logical stop-loss placement above the handle’s high, and an objective profit target based on the cup’s depth. By trading this setup with discipline, traders can avoid bull traps and potentially capitalise on significant downward moves.


