 EN
EN


Technical
-
ICT PD Arrays: Concepts Every Trader Should Know
 15 February 2026
,
Abe Cofnas
15 February 2026
,
Abe Cofnas
Mastering institutional price delivery requires a deep understanding of ICT PD Arrays, the primary framework for mapping how smart money moves through the market. Rather than using static retail levels, these arrays identify dynamic zones where professional orders are gathered and delivered with high precision. This guide breaks down the classification of ICT PD Arrays […]
- Read more

-
Volatility Prediction in Trading: Models, Indicators, and Machine Learning
12 February 2026
,
Abe Cofnas
Volatility Prediction tells you how “wild” the market may get next. It does not try to guess up or down. It estimates the potential magnitude of the moves. This matters in Forex, gold, and crypto, where prices can jump fast.Volatility prediction helps you make smarter choices, set realistic stop losses, size positions safely, and pick […]
- Read more
-
How to Trade with Keltner Bands in MT5: Signals, Setups, and Risk Tips
8 February 2026
,
Abe Cofnas
Keltner Bands are often misunderstood as simple entry signals, but they are better used as a decision framework. This guide focuses on how to think with the channel, identify conditions, select the right tactic, and manage risk realistically in MT5. The goal is not prediction, but consistency across changing market behaviour. Key Points: Treat Keltner […]
- Read more
-
Can You Swing Trade Futures Safely? A Practical Guide for Traders
5 February 2026
,
Abe Cofnas
Swing trading futures can be a lucrative strategy for many traders, but it’s not without its unique challenges. While some market participants thrive on long-term positions, others may wonder, “Can you swing trade futures?” The answer is yes, but there are specific considerations and risks to understand before diving in. In this post, we’ll break […]
- Read more
-
Inducement in Trading: Meaning, Examples, and Smart Money Concepts Context
4 February 2026
,
Abe Cofnas
Many traders lose not because their analysis is weak, but because their timing becomes predictable to other participants. Markets tend to reward liquidity over opinions, so predictable behaviour can create avoidable costs and poorer entries. If you want cleaner entries and fewer traps, keep reading to learn inducement in trading and how to filter them. […]
- Read more
-
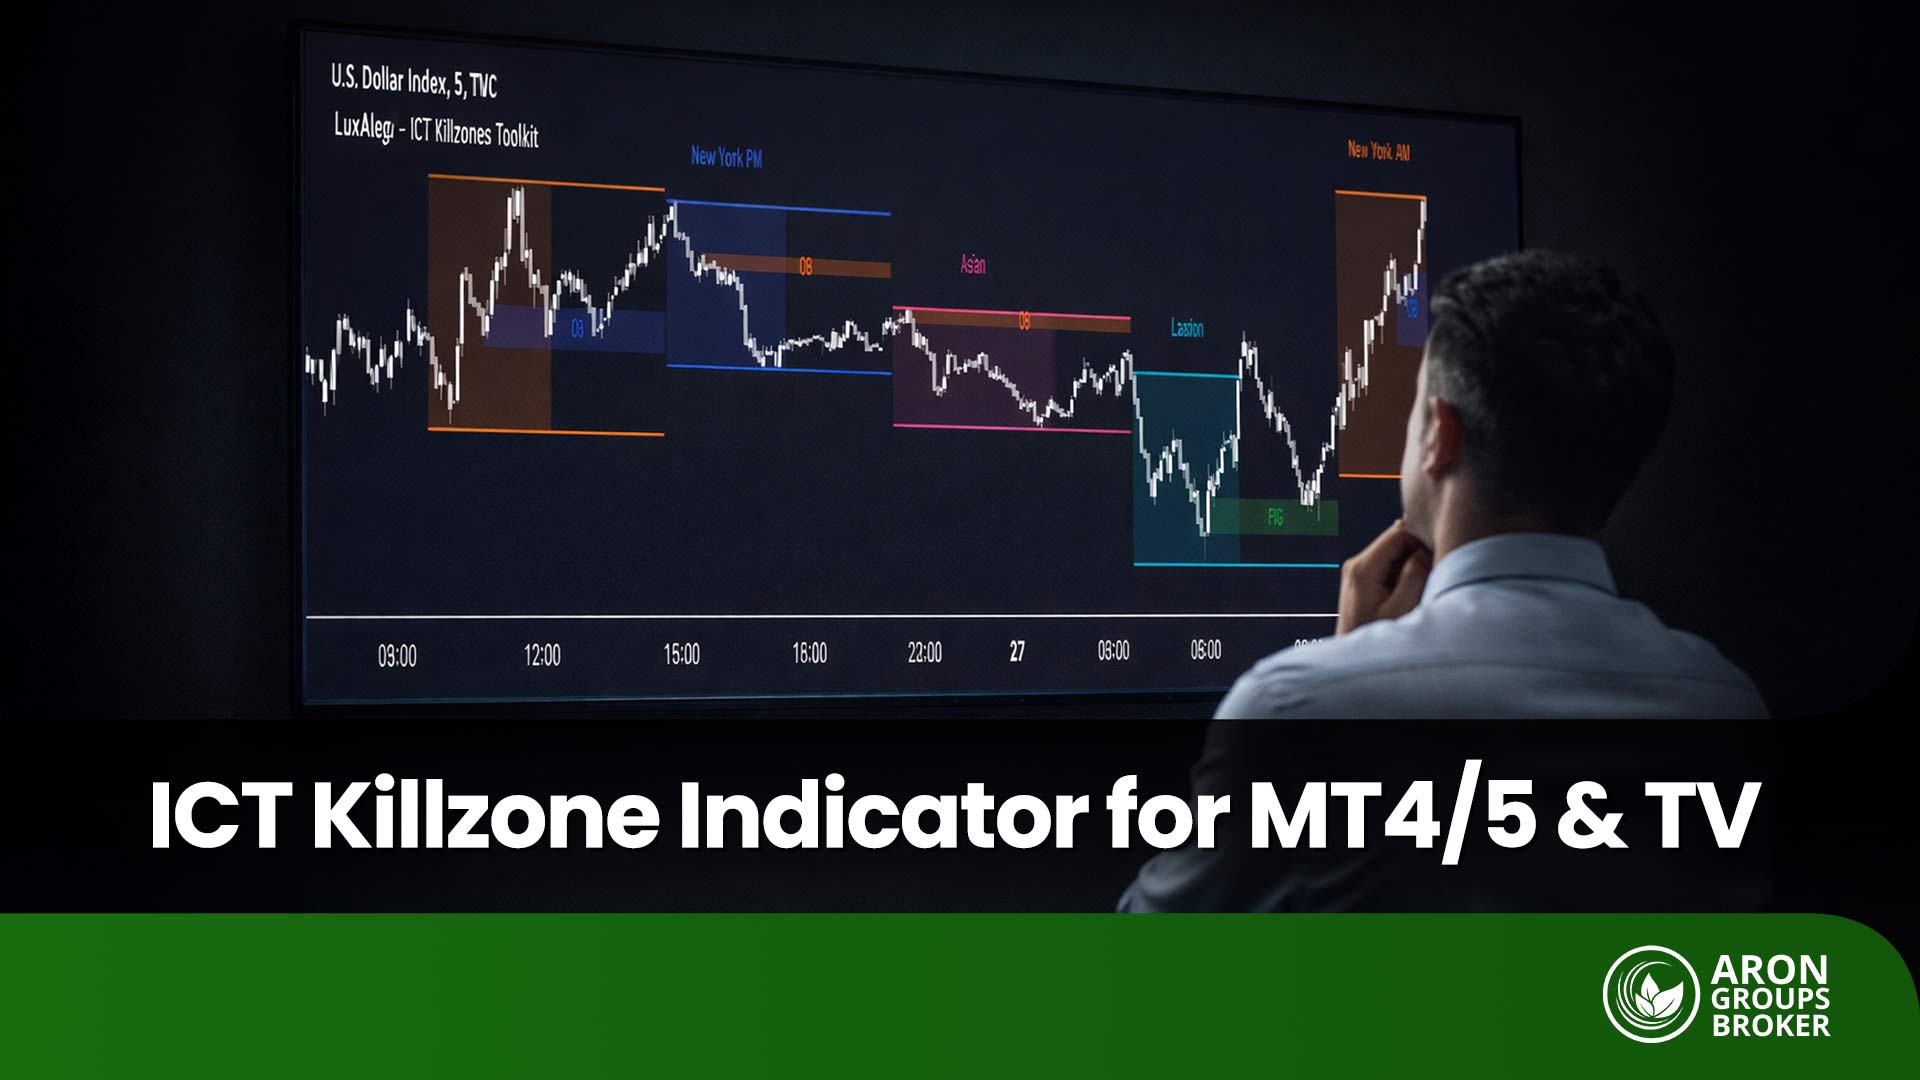
Understanding the ICT Killzone Indicator and Its Role in High-Liquidity Trading Hours
31 January 2026
,
Abe Cofnas
The ICT Killzone Indicator is widely used to highlight periods of elevated market participation, yet many traders misapply it due to inconsistent session timing across platforms and brokers. This guide explains how to align Asian, London, and New York kill zones correctly on MT4, MT5, and TradingView using reliable time references. It also outlines a […]
- Read more
-
How to Trade SPY Options for Consistent Daily Income
29 January 2026
,
Abe Cofnas
The S&P 500 ETF (SPY) is the most liquid trading instrument in the world. Traders often use SPY options to capture daily moves with small capital outlays. However, without a formal process, these fast-moving contracts can quickly deplete a retail account. Effective trading requires more than just a directional bias or a gut feeling. You […]
- Read more
-
Risk-Adjusted Return: How Traders Measure Performance After Risk
28 January 2026
,
Abe Cofnas
Performance represents more than just total earnings; it reflects how reliably you generated those profits and the risk involved. While two equity curves may reach the same profit, they often imply vastly different levels of account control. Risk-adjusted return transforms these qualitative differences into a measurable comparison for better decision-making. This metric ensures you evaluate […]
- Read more

-
Understanding ICT Vacuum Blocks and How Traders Use Price Inefficiencies
28 January 2026
,
Abe Cofnas
Imagine predicting explosive price movements in the Forex market and entering trades with more confidence. The vacuum block is a key concept in ICT trading. It helps identify price gaps caused by stop hunting and spot profitable market opportunities. These areas, formed by market maker actions and liquidity voids, can be crucial for your trading […]
- Read more
-
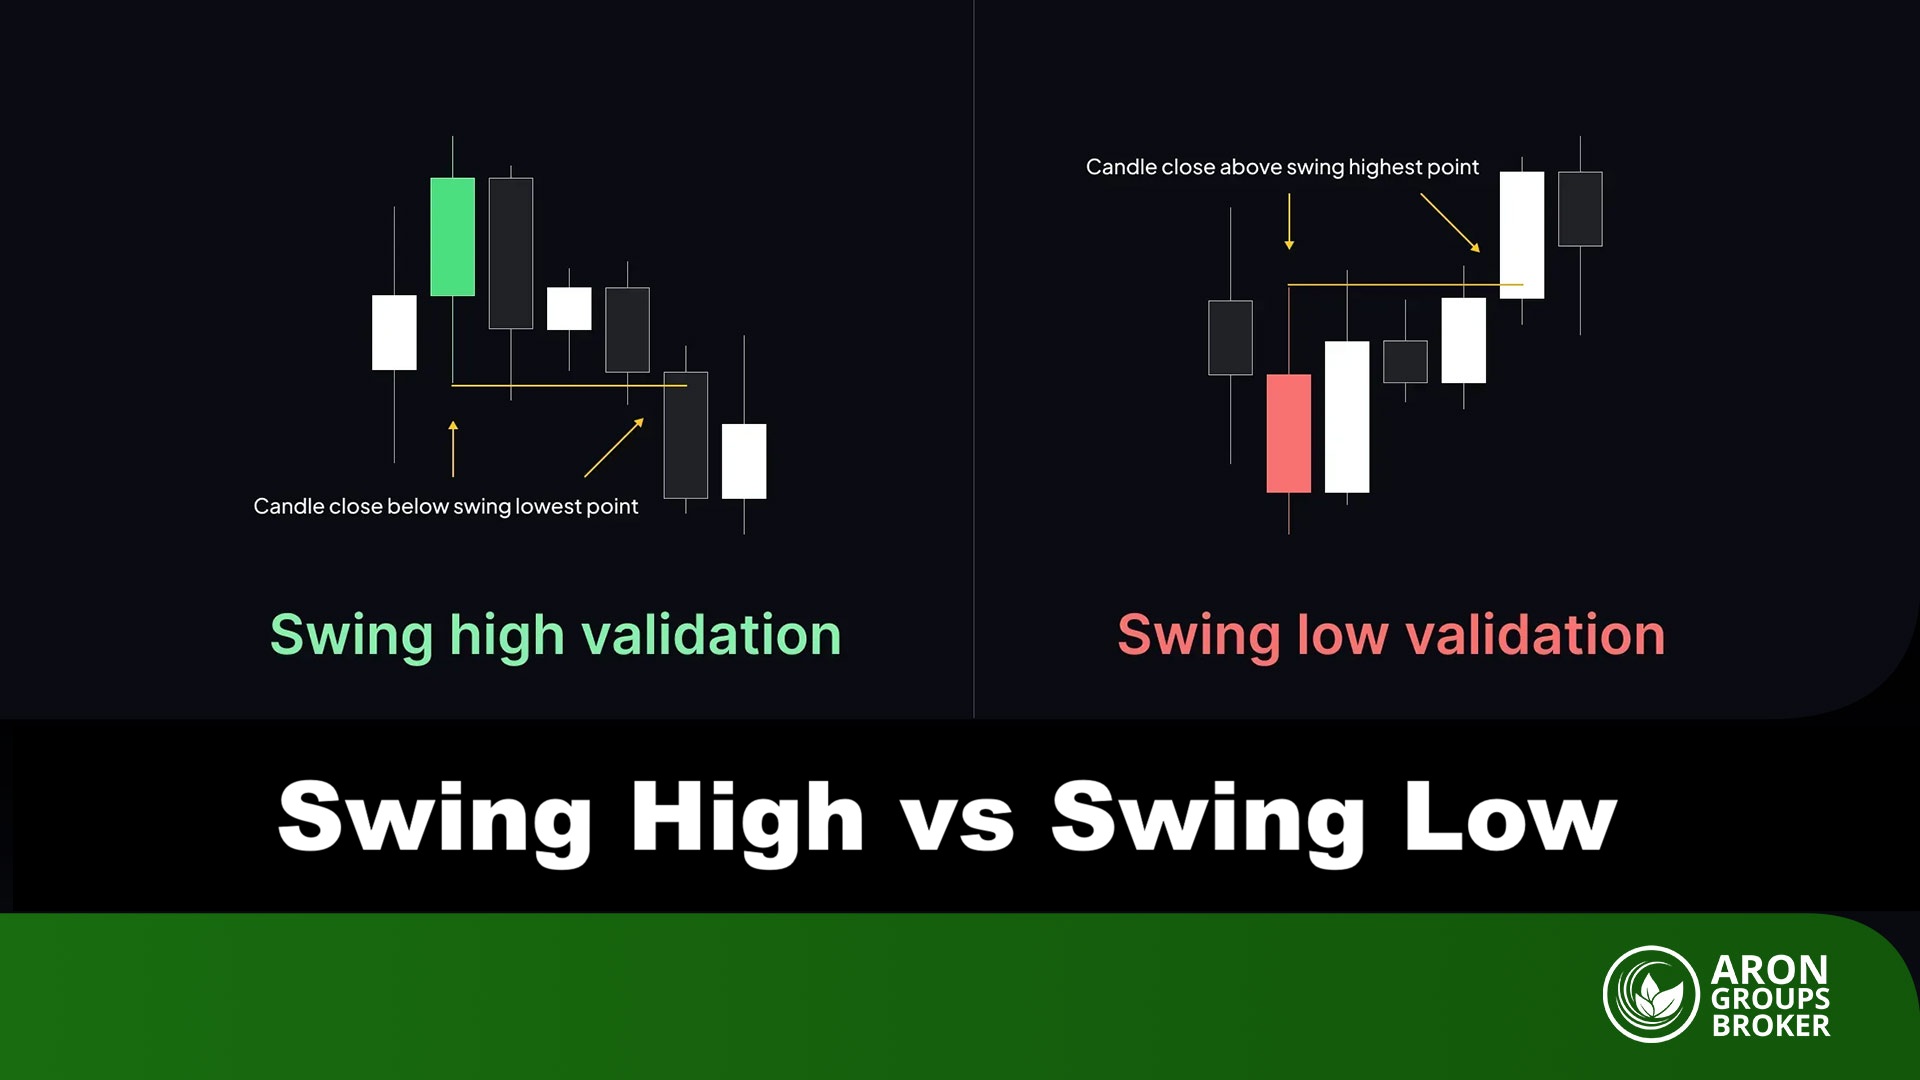
How to Analyse Market Trends Using Swing Highs and Swing Lows
7 January 2026
,
Abe Cofnas
Within every price chart, there are hidden points that shape the market’s future direction and influence upcoming moves. Swing highs and swing lows are exactly these key points, peaks and troughs that help you spot trend changes earlier. Traders seeking a more precise read of market structure will see only an incomplete picture without understanding […]
- Read more
Load more