 EN
EN


Technical
-
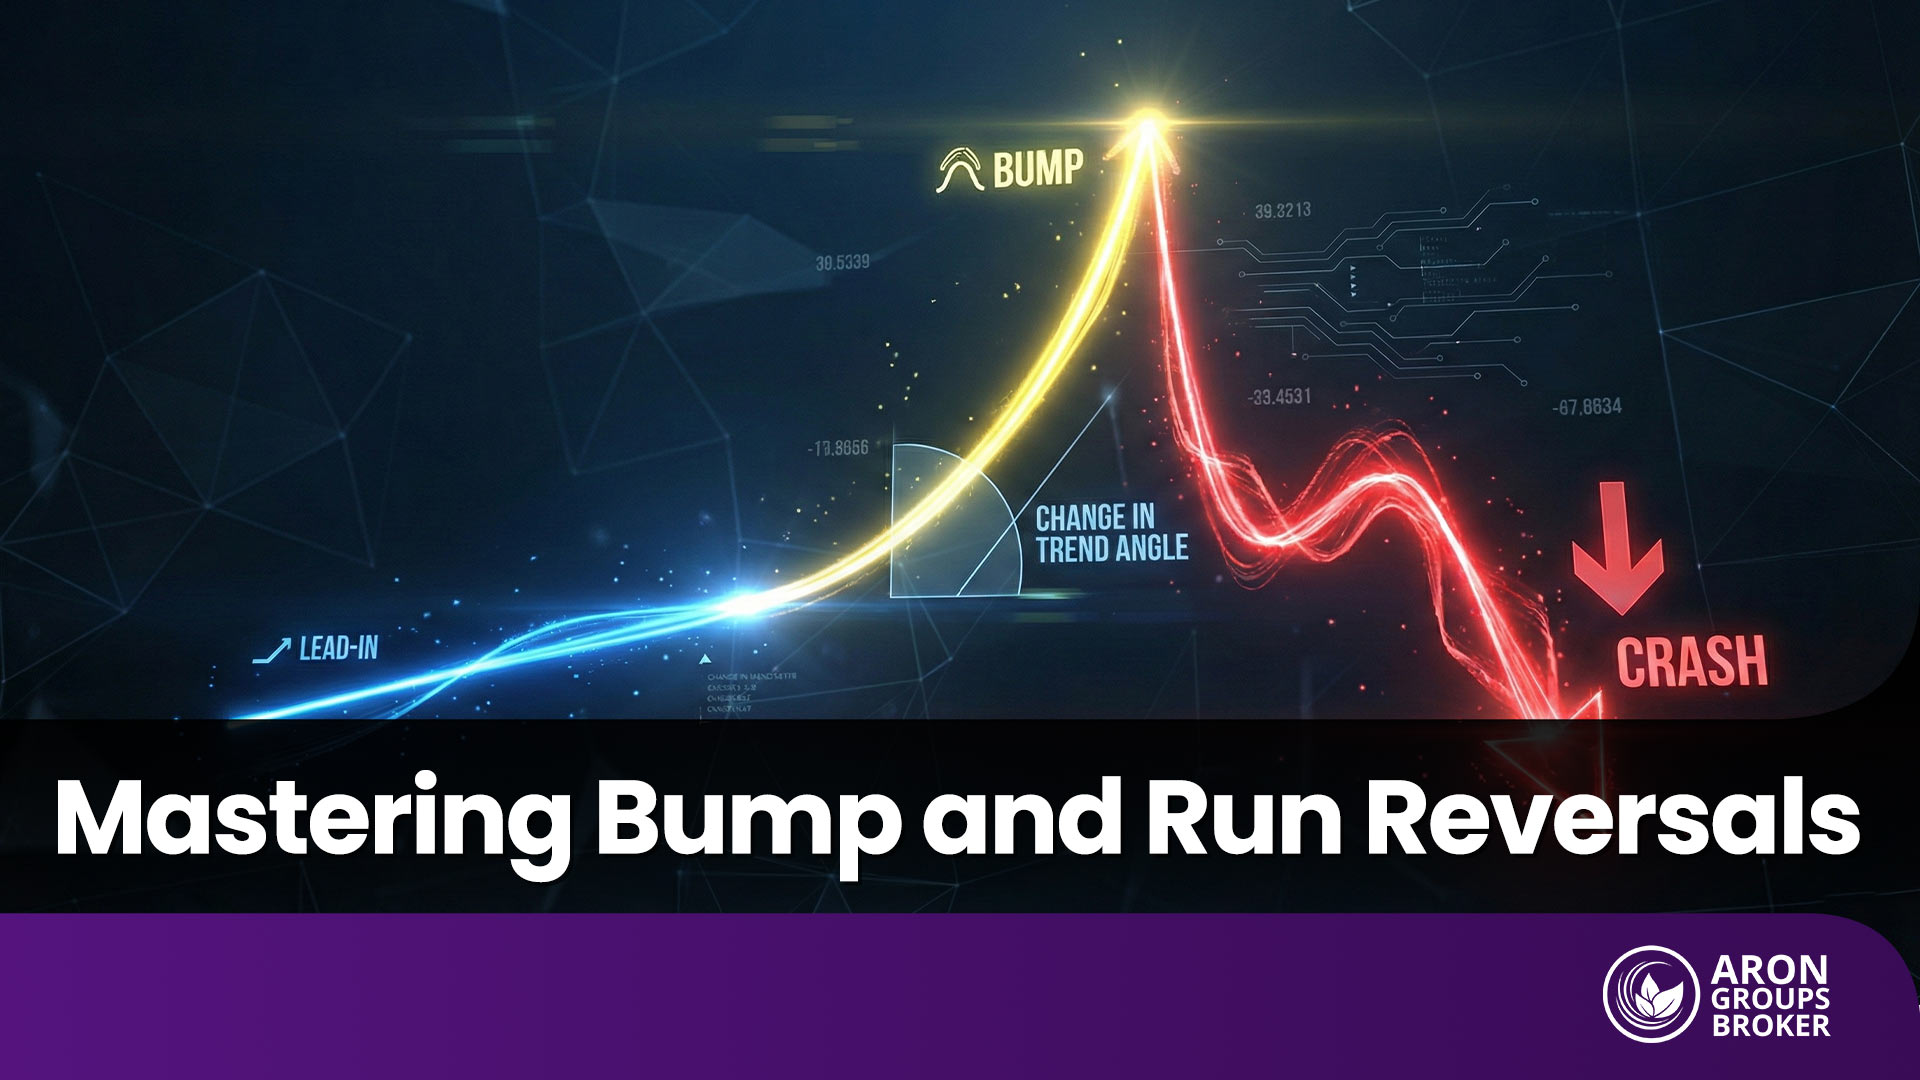
Understanding the Bump and Run Pattern and Its Use in Technical Analysis
 3 December 2025
,
Abe Cofnas
3 December 2025
,
Abe Cofnas
When markets become emotional or overheated, price action does not always follow typical, orderly patterns. In these situations, a structure known as the Bump and Run pattern can provide important clues about where the current move may be running out of steam. This pattern shows when sharp price spikes are likely to lead to a […]
- Read more
-
Discover the Power of Smart Money with the Money Flow Index (MFI) Indicator
3 December 2025
,
Abe Cofnas
The price fluctuations we see in financial markets are only the tip of the iceberg. What happens behind these movements is the flow of liquidity, also known as smart money. The MFI indicator is exactly the tool that helps you identify these hidden yet powerful flows and trade alongside the major market players instead of […]
- Read more

-
Mitigation Blocks in Smart Money Price Action: Concept, Tutorial, and Strategies
3 December 2025
,
Abe Cofnas
In trading based on order flow and Smart Money price action, understanding the behind-the-scenes behavior of financial institutions is key to success in the market. Concepts such as imbalance, the filling of hidden orders (mitigation), and liquidity manipulation are the foundation of strategies that multiply a trader’s precision in entry and exit. Among these, one […]
- Read more
-
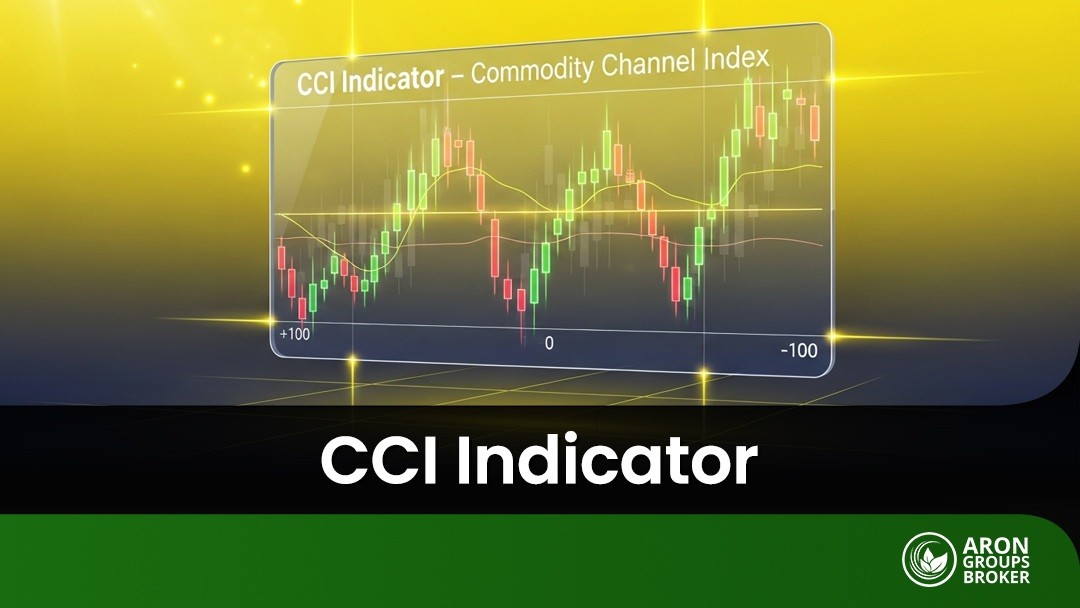
How to Identify Market Trends Using the CCI Indicator
3 December 2025
,
Abe Cofnas
Spotting the beginning or end of a trend at the right time can be the ace up your sleeve that transforms your trading results. To do that, you need tools that go beyond simple price analysis. One of these tools is the CCI indicator, which helps you view market behavior with greater precision and identify […]
- Read more
-
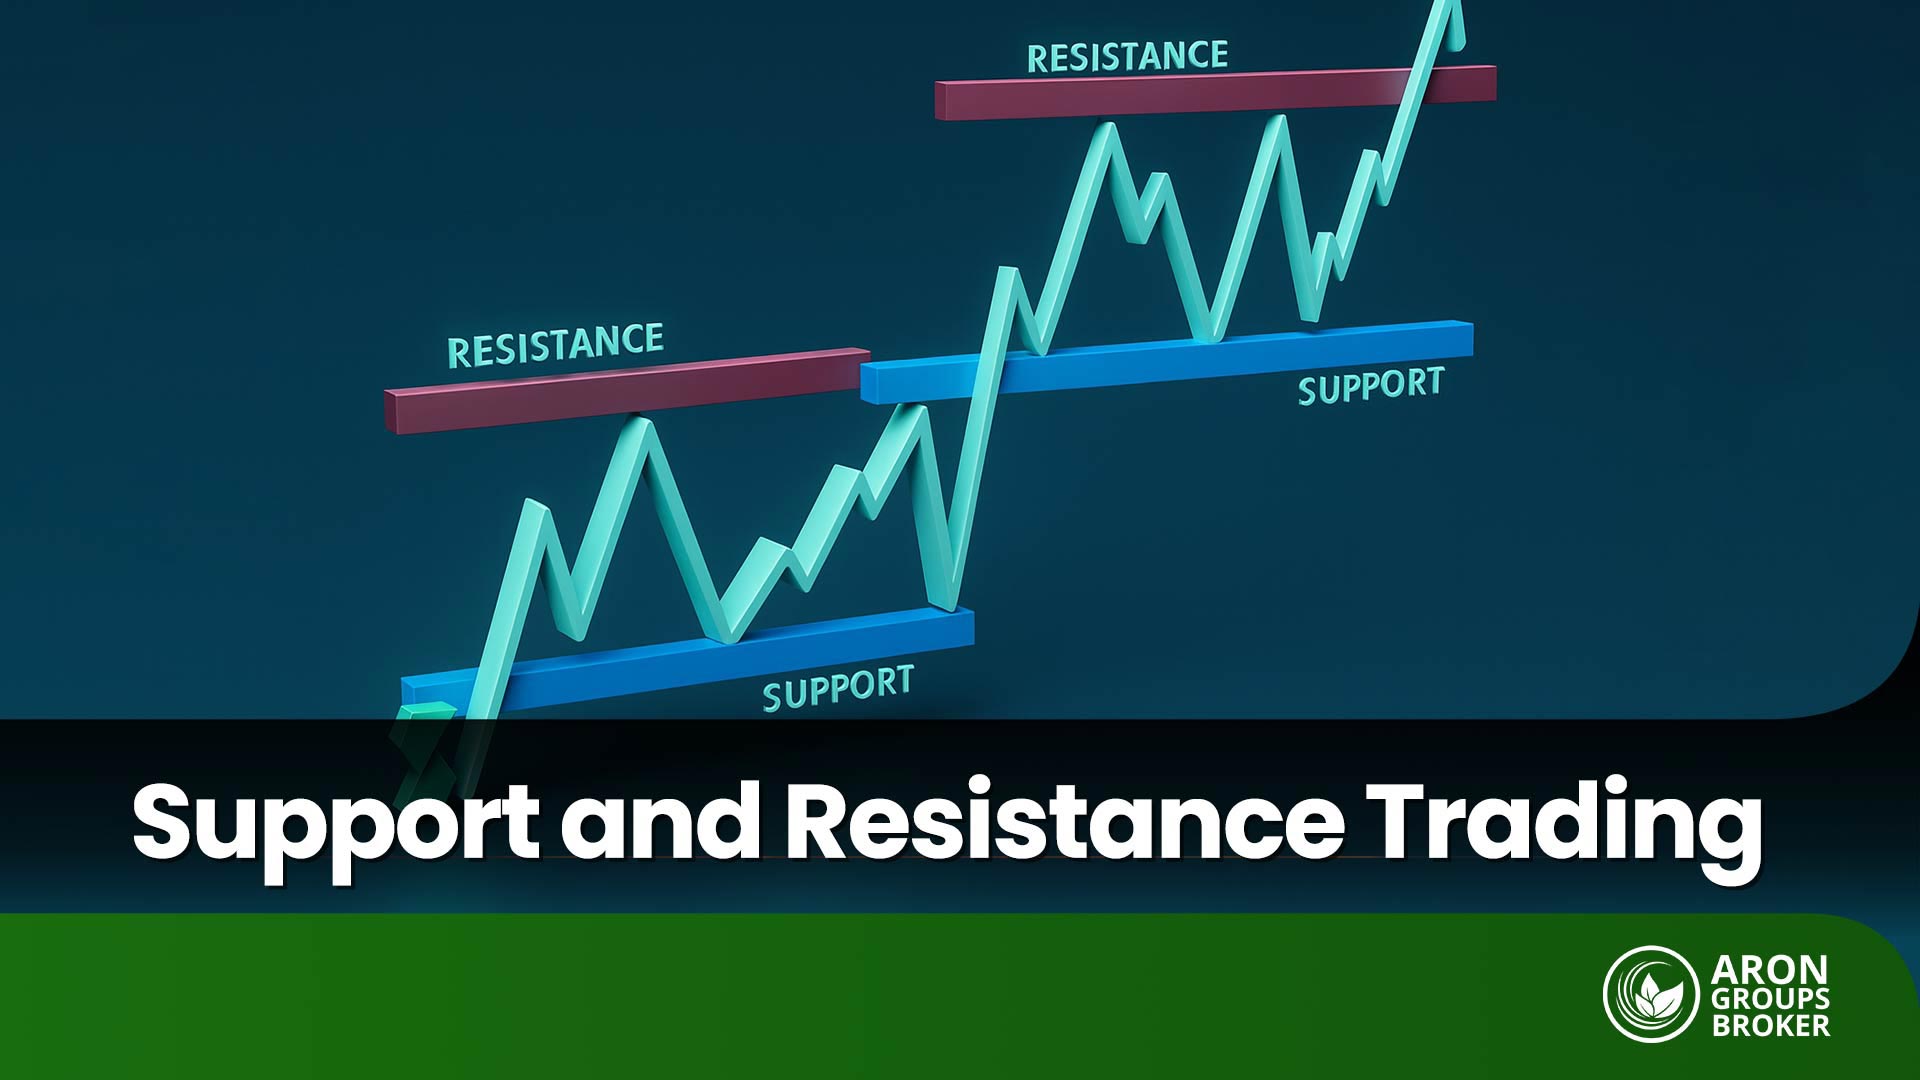
Support and Resistance Trading: Techniques Every Trader Should Know
2 December 2025
,
Abe Cofnas
A trading strategy built on support and resistance lines focuses on identifying optimal entry and exit points using support and resistance levels (zones where the price is likely to reverse when it touches them). In this article, we will define support and resistance, explain how to identify support and resistance levels on the chart, review […]
- Read more
-
What Is the CHoCH Strategy in Smart Money and How Do You Identify It?
28 November 2025
,
Abe Cofnas
In the highly volatile and complex world of Forex, traders are constantly seeking methods and strategies to accurately identify entry and exit points and capitalize on market swings. One of the key concepts used in the Smart Money strategy is Change of Character (CHoCH). In this article, we will provide a clear, practical explanation of […]
- Read more
-
Practical Guide to Value at Risk (VaR)
27 November 2025
,
Abe Cofnas
In the dynamic world of financial markets, awareness of risk is not just a wise choice but an undeniable necessity. One of the most well-known and practical tools for measuring and managing this risk is Value at Risk (VaR). This metric, which transforms the complexity of market fluctuations into a straightforward, understandable number, helps investors […]
- Read more

-
Understanding Hidden Inflation and Its Impact on Daily Life
26 November 2025
,
Abe Cofnas
Inflation is one of the most influential concepts in macroeconomics. It affects purchasing power, household welfare, and long-term financial planning. Yet not all inflation is visible. Some forms of inflation remain concealed, which raises an important question: What is hidden inflation? Hidden inflation occurs when the price of a good or service remains the same, […]
- Read more
-
Trade With Logic and Data: A Comprehensive Guide to Quantitative Trading
26 November 2025
,
Abe Cofnas
Modern financial markets depend more than ever on precision, speed, and data. The enormous volume of information and the growing complexity of price behaviour mean that decisions based only on intuition or experience are no longer sufficient. Quantitative investing emerged as a modern response to this environment. It is a method that combines data science, […]
- Read more
-
Comprehensive Guide to the Fisher Transform Indicator in Technical Analysis
25 November 2025
,
Abe Cofnas
The Fisher Transform Indicator, developed by John F. Ehlers, is one of the key analytical tools used in financial markets. This indicator transforms price data into a Gaussian normal distribution (a bell-shaped curve), helping traders identify market turning points more easily. Simply put, the Ehlers Fisher Transform amplifies price movements, making overbought and oversold zones […]
- Read more
Load more