


For a significant portion of the time, the market is neither trending upward nor downward — instead, it fluctuates within a balance zone where buyers and sellers are in relative equilibrium. This phase, known as a trading range, represents the point at which the battle between buyers and sellers reaches its peak. Many traders make mistakes during this phase because price action often appears random and directionless.
However, in price action trading, particularly as taught by Al Brooks, a trading range is not a sign of uncertainty but rather a decision-making stage for the market. Understanding this phase in depth can make the difference between emotional trading and analytical, structured decision-making.
In this article, focusing on trading ranges in Al Brooks’ price action methodology, you’ll discover how this seemingly simple structure can serve as a source of valuable price signals and completely transform your perspective on market behavior.

- Over 80% of breakouts in trading ranges are false moves—essentially traps designed to trigger retail traders’ stop-loss orders.
- In a range-bound market, instead of using a trailing stop, focus on a fixed profit target and allow the market to reach its natural objective.
- For effective risk management in trading ranges, always place the stop-loss on the opposite side of the range boundary.
Al Brooks’ Perspective on Range Markets
Al Brooks, one of the leading experts in price action trading, has developed his own distinctive approach to market analysis. One of the key concepts he emphasizes is understanding and analyzing the range market, a market condition in which price lacks a clear trend and moves within a defined zone between a resistance and a support level.
From Al Brooks’ point of view, a range market represents nothing more than a temporary balance between buyers and sellers, a state in which neither side has enough strength to break out of the range. Buyers fail to push prices above resistance, while sellers can’t drive them below support.
In Al Brooks’ trading range methodology, candlestick patterns and price movements play a critical role. In other words, traders should closely observe price action within the range and look for smaller trends that may emerge even inside a sideways market.
The Difference Between Al Brooks’ Analysis and Classical Technical Analysis in Trading Ranges
In this section, we’ll explore some of the key differences between Al Brooks’ approach and classical technical analysis when it comes to interpreting trading ranges.
- While traditional technical analysis seeks buy and sell signals from indicators such as RSI or MACD, Al Brooks condenses all the necessary tools into the price chart itself, relying solely on candlesticks and price action. He views indicators as lagging and often misleading, obscuring the market’s true story.
- Classical analysts typically treat support and resistance levels as precise lines, whereas Brooks interprets them as zones — areas where price may slightly exceed these boundaries before reversing.
- The classical approach is often mechanical — for instance, suggesting that if the RSI enters the overbought zone, a trader can open a buy position. In contrast, Brooks approaches trading probabilistically, always seeking to understand the reason behind price movement: are buyers gaining control, or are sellers losing strength?
- In classical analysis, a breakout from a channel or a level is usually considered a strong signal. Brooks, however, remains skeptical of breakouts, recognizing that in range-bound markets, many of them are false moves designed to trap traders.
To better understand the difference between these two analytical approaches, consider the following example:
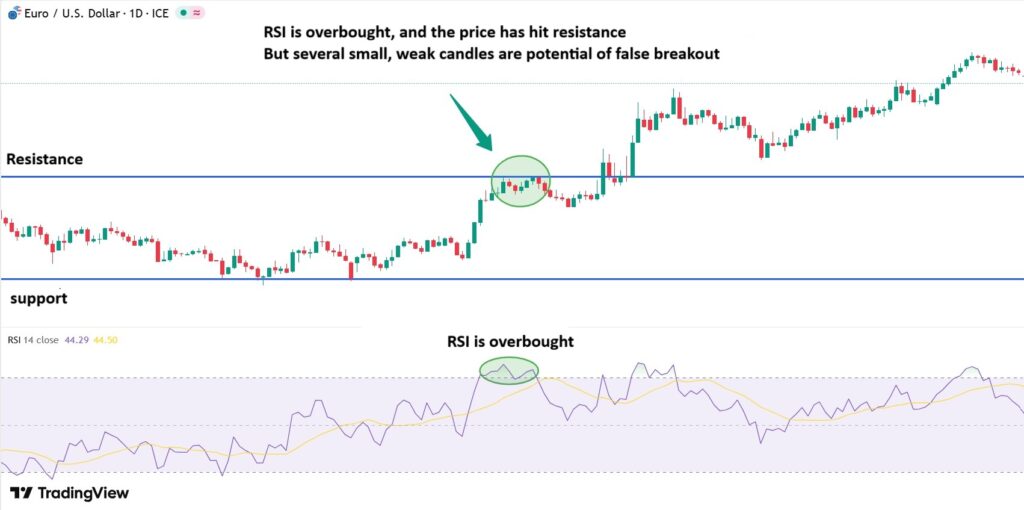
Suppose the price reaches the top of a trading range channel while the RSI indicator also enters the overbought zone.
- A classical technical analyst might conclude:
“RSI is overbought, and the price has hit resistance: this is a sell signal.” - However, Al Brooks interprets the market through the story told by the candles. In such a scenario, if a strong bearish candle with a large body and high volume forms, he considers it a valid sell signal.
But if several small, weak candles form near the top of the range without showing real progress, Brooks interprets this as a sign of seller exhaustion and a potential false breakout.
In that case, he waits for a buy signal, anticipating an upward continuation instead.
Candle Behavior and Key Patterns in Al Brooks’ Trading Range Strategy
In Al Brooks’ approach to trading ranges, the bar-by-bar reading of candlesticks is the primary analytical tool. Brooks believes that every candle tells a story — a story of the ongoing battle between buyers and sellers at a specific moment in time.
The shape, size, and closing position of each candle provide valuable clues about the balance of power in the market. In a range-bound environment, these clues become even more critical, as they help traders distinguish potential reversal points from genuine breakouts.
In the following section, we’ll explore how candlestick behavior and key price patterns play a vital role in identifying high-probability setups within Al Brooks’ trading range methodology.

Al Brooks’ core philosophy for trading in range-bound markets is both simple and remarkably effective: “Buy at the bottom of the range and sell at the top.”
Characteristics of Central, Boundary, and Breakout Candles in a Trading Range
Al Brooks divides a trading range into three key zones, each with distinct candlestick behaviors that carry different meanings:
- Central Candles:
These candles usually form near the middle of the range and are characterized by small bodies and long wicks (such as Doji candles). They indicate market indecision and a temporary balance between buyers and sellers, suggesting that neither side has control at the moment. - Boundary Candles:
Candles forming near the edges of the range are highly significant, as they often signal the next directional move. When a candle with clear momentum appears in these zones, for example, a bullish hammer near the range bottom or a bearish shooting star near the top, the probability of a price reversal increases.
Conversely, weak or neutral boundary candles with indistinct bodies suggest market hesitation and a higher chance of a range breakout. However, Brooks emphasizes that the interpretation of these candles should always be made in the context of the broader trend and market structure, not in isolation.
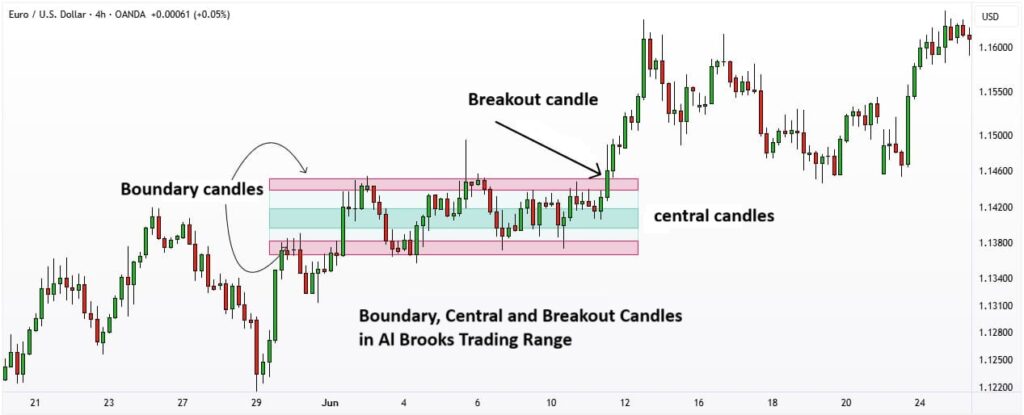
Breakout Candles
Breakout candles are characterized by large, strong bodies that push decisively through one of the range boundaries. A valid breakout is typically confirmed by a powerful candle that closes well beyond the edge of the channel.
In contrast, weak breakouts, where only the wick extends beyond the boundary while the body closes near it, are often signs of a false breakout (fakeout), a common trap in range-bound markets.
In Al Brooks’ trading range strategy, the signal bar is the candle that appears right before the entry bar, serving as the final confirmation to execute a trade setup.
Key Patterns at Range Boundaries in Al Brooks’ Method
At the edges of a trading range, success depends on identifying weakness in one side of the market—either buyers or sellers. Classic price action patterns serve as the most effective confirmation tools for identifying these weaknesses and finding high-probability entry signals.
At the top of the range, traders should watch for signs of buyer exhaustion. The following patterns often provide reliable sell signals:
- Double Top: Indicates that buyers have failed twice to break above a resistance level.
- Head and Shoulders Top: A three-push pattern upward that signals fading buyer strength.
- Bear Flag: Represents the final effort of buyers before a sharp downside move begins.
At the lower edge of a trading range, traders should look for signs of seller exhaustion. The following patterns often signal strong buying opportunities:
- Double Bottom: Indicates that sellers are losing strength and failing to break below the support level.
- Inverse Head and Shoulders: A three-push pattern downward that shifts control to buyers.
- Bull Flag: Represents sellers’ final attempt before a powerful bullish move begins.
The Concept of Breakout Test and Market Behavior During Failed Breakouts
As described in Al Brooks’ Trading Range book, a breakout test refers to a situation where, after breaking a support or resistance level, the price pulls back to retest that level. This retest often aims to trigger the stop-losses of traders, and it can occur one, two, or even twenty bars after the initial breakout.
A breakout test essentially acts as a market test of conviction; the market revisits the breakout area to determine whether traders truly believe in the new directional move.
If the price fails to continue in the direction of the breakout and quickly returns inside the range, it’s called a failed breakout (or fake breakout). Such failures often flush out weak traders or those who’ve left their positions unattended.
A failed breakout signals strength from the opposing side of the market and often serves as a high-probability trade setup in the opposite direction; for example, a sell signal following a failed breakout to the upside.
In a breakout test, the price may not return precisely to the breakout level; it can move a few pips above or below it. Therefore, it’s best to place your stop-loss about 2 to 3 pips beyond the entry price to protect your position against minor price fluctuations.
The Role of Candle Body and Wick Size in Interpreting Market Balance
At the core of Al Brooks’ trading range methodology lies the candlestick — the most direct reflection of market psychology. Each candle’s two key components, the body and the shadow (wick), reveal critical clues about the balance of power between buyers and sellers:
- Large Body: Indicates strength and dominance from one side of the market (either buyers or sellers).
- Small Body: Indicates indecision and a temporary equilibrium between the two sides.
- Long Wick: Shows an unsuccessful attempt by one side to push beyond a key level of support or resistance, helping define the valid boundaries of the trading range.
- Short or No Wick: Represents strong, decisive price action in one clear direction.
A small-bodied candle with long wicks shows indecision, while a large-bodied one near resistance signals growing seller strength.
The Psychology of Buyers and Sellers in a Trading Range
A trading range reflects a near-perfect balance of power between buyers and sellers. This balance doesn’t mean the market is inactive. Instead, it represents a strategic battle where both sides continuously compete for control.
Trader Decision Logic at the Range Highs and Lows
Each time the price reaches the top of the range, sellers step in aggressively, believing the asset is overvalued and ripe for selling. Meanwhile, buyers who entered at lower prices tend to take profits, reinforcing the downward push.
Conversely, when the price approaches the bottom of the range, buyers perceive value and look for buying opportunities. At the same time, short sellers begin to cover their positions and secure profits. The combined pressure from buyers and short-covering sellers drives prices upward again.
This cycle continues until one side gains enough strength to break the balance and initiate a decisive breakout from the range.
Why Most Breakouts in Trading Ranges Fail
According to Al Brooks, more than 80% of breakouts from a trading range turn out to be false breakouts. The failure of most price breakouts often stems from collective market psychology and the hidden strategies employed by large institutional players.
These breakouts often act as liquidity traps, designed to trigger retail traders’ stop losses or lure them into poor entries. Big players intentionally create a sharp, deceptive move beyond the range to manipulate liquidity, forcing smaller traders to buy at highs or sell at lows.
From an institutional perspective, the trading range represents a fair value zone, meaning they have little incentive to buy above it or sell below it. As a result, once liquidity is captured and no broad market consensus supports the move, the price quickly snaps back into the range, exposing the false nature of the breakout.
The Behavior of Institutions and Smart Money in Prolonged Trading Ranges
To truly understand a trading range, it’s essential to view it from the perspective of large institutions and smart money. A long-lasting range provides the perfect environment for their two primary strategies:
- Accumulation Phase: Institutions buy gradually near the bottom of the range, often creating bear traps to suppress prices and accumulate assets at the lowest possible cost.
- Distribution Phase: In contrast, they sell incrementally near the top of the range, using bull traps to keep prices elevated while offloading positions to eager retail buyers.
In essence, extended trading ranges are profit factories for institutions. They set the stage, write the rules, and exploit the impatience and lack of understanding among retail traders to their advantage.
How to Trade a Range Market the Al Brooks Way
The philosophy behind Al Brooks’ range trading is simple yet deeply logical: “Buy at the bottom and sell at the top, but not on hope, on evidence.”
In other words, you shouldn’t predict that the price will bounce from the bottom or fail to reach the top. Instead, wait for the market to confirm the setup before taking action.
In this approach, it’s often wiser to focus on scalping trades, aiming for small but high-probability profits, rather than chasing large, uncertain moves.
Al Brooks suggests that if the market has printed several bullish candles in a row, you should start looking for selling opportunities, and if the price has been declining for a while, it’s likely a good time to look for a buy setup.
When Not to Trade in a Range Market
Before learning how to trade a range, you must first know when to stay out. Avoiding trades is one of the most underrated yet vital skills of a professional trader.
- Don’t trade in the middle of the range:
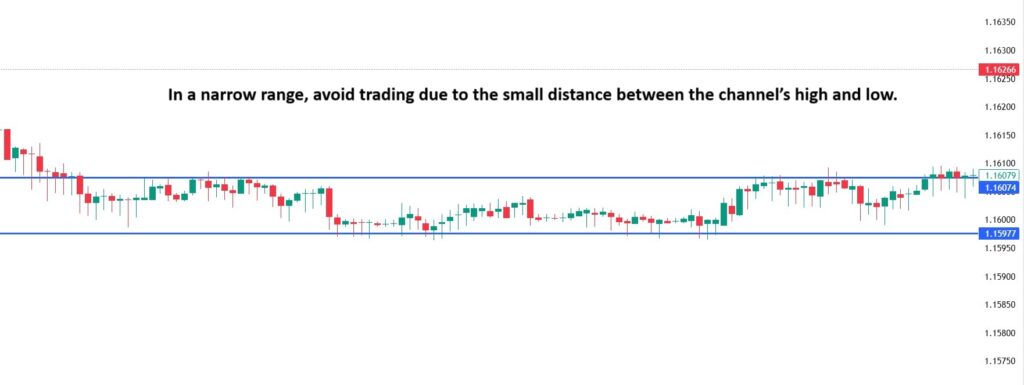
When the price hovers around the midpoint of a range, there’s no clear directional edge; buyers and sellers are in equilibrium. Entering here is nothing more than gambling. - Avoid extremely narrow ranges:
If the upper and lower boundaries are too close, your risk-to-reward ratio will be poor. The potential profit is so small that the risk isn’t worth it. In such cases, it’s better to wait for a breakout from the tight range before taking any position. - Don’t trade during choppy, structureless moves:
Sometimes, instead of oscillating smoothly, price action becomes erratic and disorganized. In this condition, no reliable pattern forms, and the best course of action is to close the chart and look for another currency pair or asset with cleaner price behavior. - Avoid trading around major economic news releases:
High-impact news can easily break a trading range, triggering sharp, unpredictable moves. Always check the economic calendar, and stay out of the market 15–30 minutes before and after major announcements.
Price Action Entry Strategies in Range-Bound Markets
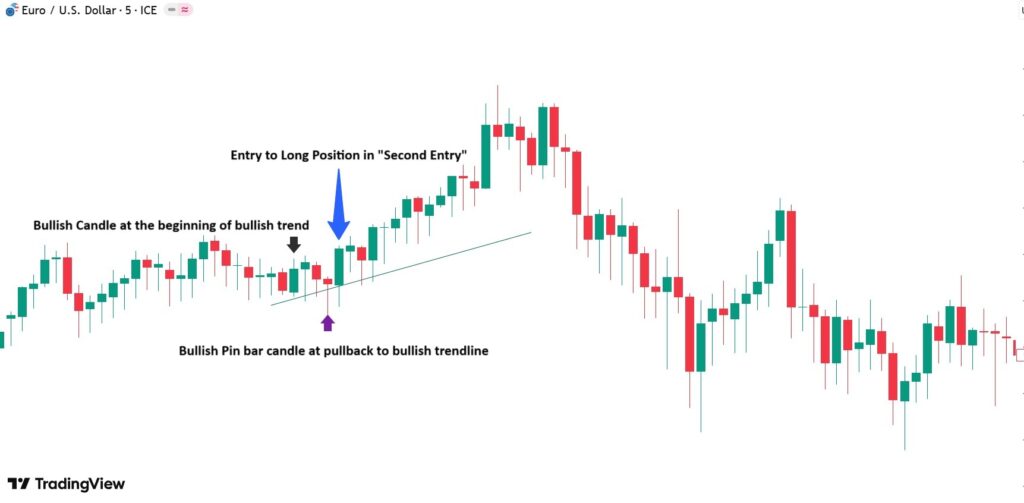
In Al Brooks’ range trading methodology, a Second Entry refers to the second opportunity to enter a trade that occurs a few candles after the initial entry signal, following the same underlying logic as the first setup.
In this approach, the trader first identifies the potential start of a new trend, then waits for a pullback. If a recognizable price action pattern forms during that pullback — confirming the continuation of the new trend, it is considered a Second Entry, which strengthens the validity of the signal.
As mentioned on EliteTrader, when an uptrend line breaks, many traders interpret it as a sign of weakness. However, if the market immediately forms a valid buy signal after that break, this constitutes a Second Entry Long, a high-probability opportunity to go long. This behavior indicates that buyers remain in control, and the uptrend is likely to resume.
Similarly, in a downtrend, if the bearish trendline is broken, but instead of continuing higher, the market forms a strong sell signal, that signal represents a Second Entry Short, confirming that sellers remain in control. This pattern confirms that the downtrend remains healthy and firmly intact.
In Al Brooks’ range trading, entries shouldn’t rely on a single signal. A Second Entry acts as the key confirmation signal, strengthening the trade’s validity.
Al Brooks’ Second Entry Indicator on TradingView
To identify Second Entry points more accurately on TradingView, open the Indicators tab from the top toolbar and search for “Al Brooks Second Entry.”
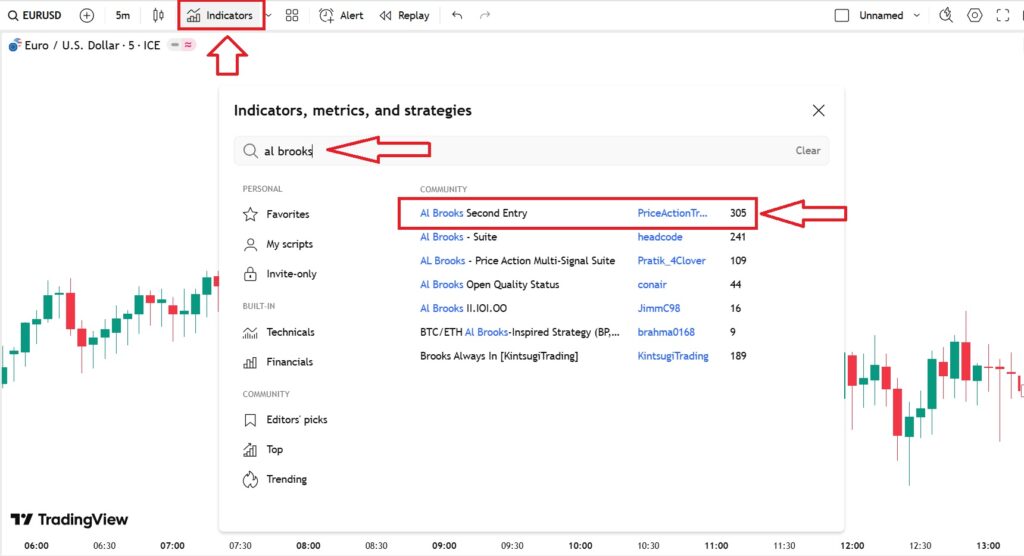
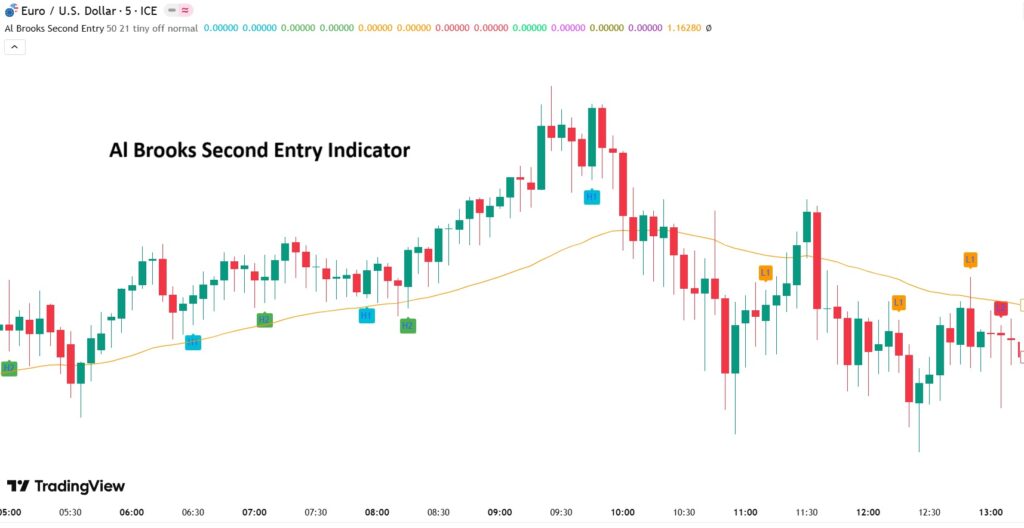
Then, double-click on the indicator’s name to add it to your price chart. This indicator automatically marks the points L1, H1, L2, and H2 on the chart, which represent:
- L1: the first bearish signal;
- L2: the second-entry signal for a short trade;
- H1: the first bullish signal;
H2: the second-entry signal for a long trade.
Exiting Trades, Trailing Stops, and Stop Loss Placement in Range-Bound Markets
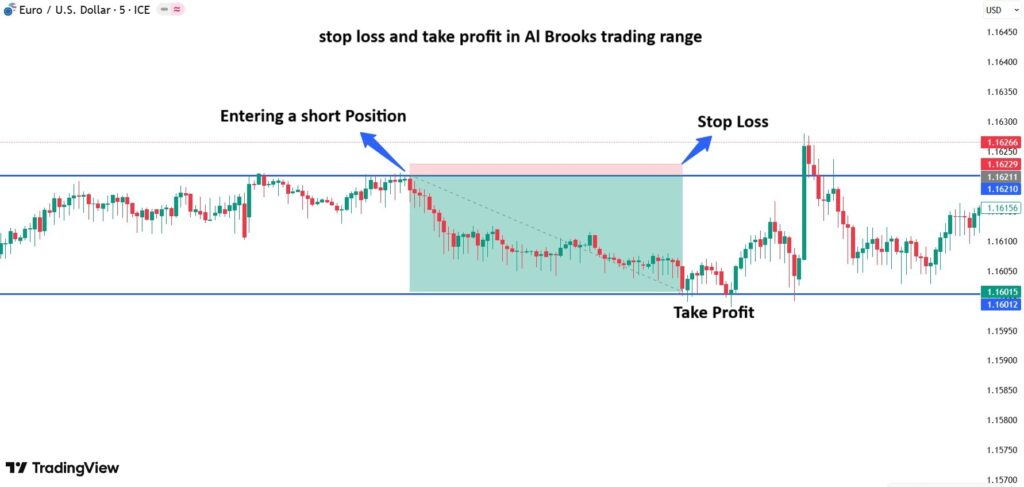
The position management philosophy in Al Brooks’ range trading is built on one key principle: “The market gives you a clear target — respect it.” Accordingly, the best approach for exit points, trailing stops, and stop-loss placement in range-bound conditions is as follows:Stop Loss Placement:
In a trading range, the optimal stop loss is set very close to the entry point, since trades are taken near extreme levels where the price is expected to move immediately in the trade’s direction. If it doesn’t and instead returns toward the entry, the initial analysis was likely wrong. Therefore:- For short trades (at the range high): place the stop loss a few pips above the high of the bearish signal candle.
- For long trades (at the range low): place the stop loss a few pips below the low of the bullish signal candle.
- If you’ve sold at the top, set your take profit at the bottom of the range.
- If you’ve bought at the bottom, your take profit should be set at the top of the range.
Should You Use a Trailing Stop?
Using a trailing stop in range-bound markets is one of the most common mistakes traders make. The reason is simple: prices naturally oscillate back and forth within a range. A trailing stop will most likely be triggered prematurely, taking you out of the trade with a small profit — or even a loss — before the price reaches your intended target.
In range trading, instead of using a trailing stop, it’s better to set a fixed profit target and let the market hit it.
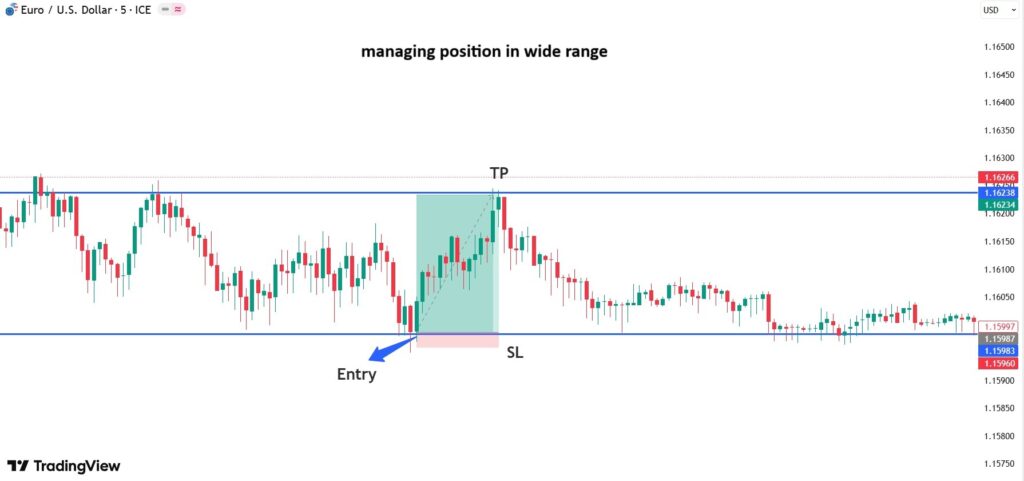
The Difference Between Managing Positions in Wide and Narrow Ranges
A wide range is a market zone where there’s a significant distance between the high and low levels, offering some of the best trading opportunities. In contrast, a narrow range forms when the highs and lows are close together; these setups may look appealing but are extremely risky.
The danger of narrow ranges lies in their low profit potential, which often can’t even cover trading costs such as spreads and commissions. Moreover, minor price fluctuations can easily trigger nearby stop-loss orders.
Therefore, when trading wide ranges, place your stop loss close to the entry point but beyond the extreme, and set your profit target at the opposite boundary of the range.
In contrast, instead of trading within a narrow range, wait for the breakout to occur and then enter a position in the direction of the breakout.
The Role of Timeframe in Interpreting Range Trading in Al Brooks’ Method
The concept of a range-bound market is relative and heavily depends on the timeframe you’re analyzing. A range on a lower timeframe (for example, the 15-minute chart) might actually be part of a strong bullish or bearish channel on a higher timeframe (such as the 1-hour chart). Therefore, in Al Brooks’ range trading approach, no analysis is complete without considering the higher timeframe context.
How a Lower-Timeframe Range Can Be Part of a Higher-Timeframe Channel
In Al Brooks’ methodology, a range on a lower timeframe can often represent a trend move on a higher one; a scenario that frequently misleads traders.
For instance, imagine you’re analyzing the EUR/USD 15-minute chart. Price appears to be oscillating between two horizontal levels, forming a clear trading range. As a range trader, you might prepare to open a short position at the top of this range, unaware that on the 1-hour chart, this same movement could simply be a pullback within a larger bullish trend.
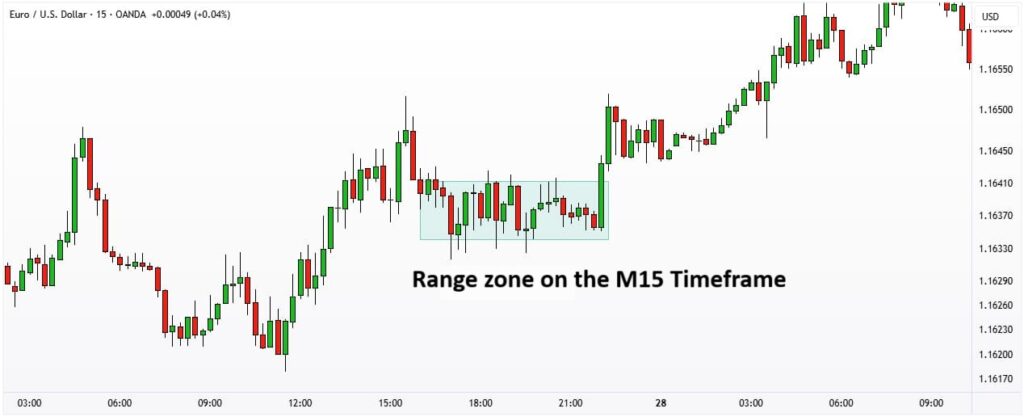
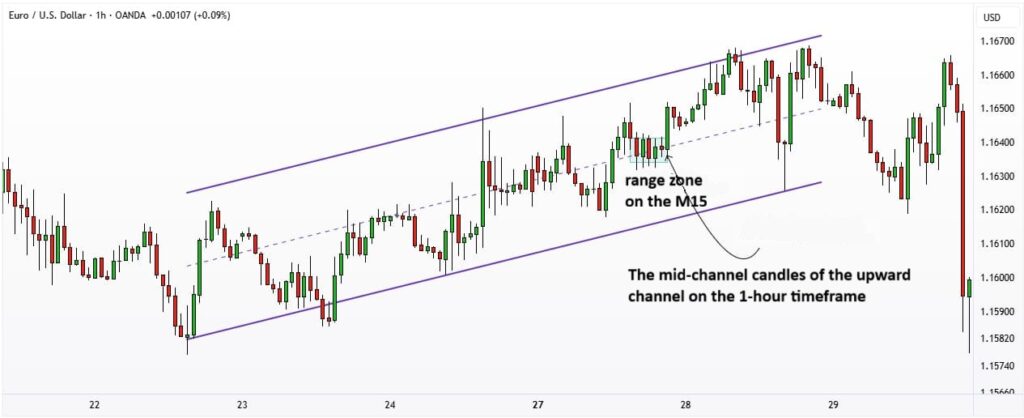
However, before entering the trade, you take a step back and look at the 1-hour chart. There, you realize that the range on the 15-minute timeframe is actually part of the mid-section candles of an upward channel on the higher timeframe, where price is forming higher highs and higher lows.
Given this bullish channel pattern, selling at the top of the 15-minute range means trading against the main trend, which carries a high level of risk.
The smarter strategy is to wait for the price to reach the lower boundary of the channel (or the bottom of the 15-minute range) and look for buy setups, aligning your trade with the dominant trend on the higher timeframe.
Al Brooks’ Method for Timeframe Alignment in Range Analysis
Timeframe alignment refers to the full synchronization between a trading signal on a lower timeframe and the overall market structure on a higher one.
Although Al Brooks believes that by carefully observing lower timeframes (such as the 15-minute or 5-minute chart), a trader can gather all the necessary information to enter a trade, the higher timeframe still plays a crucial role in identifying key support and resistance levels.
Recognizing these levels is important because, as price approaches them, it often signals a potential reversal toward the opposite boundary of the range, forming reversal patterns along the way.
In the timeframe alignment approach, also known in Al Brooks’ range trading method as multi-timeframe analysis, the higher timeframe (such as the daily or 4-hour chart) defines the overall range structure, while the lower timeframe is used to find confirmation signals for precise trade entries.
For example, look at the chart below:
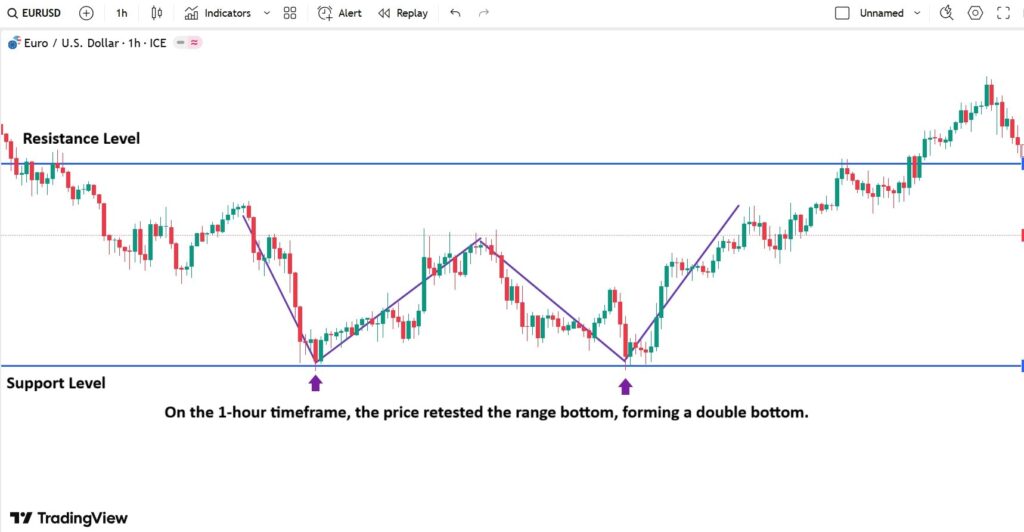
In the first image, price is oscillating between two horizontal support and resistance levels on the 1-hour timeframe, having already touched the bottom of the channel twice and formed a double-bottom pattern.
In the second image, we zoom in on the 15-minute timeframe to confirm the bullish signal observed on the higher chart. This confirmation is indicated by the formation of a bullish pin bar pattern. Once this pin bar appears on the lower timeframe, it provides a reliable entry point for a long trade aligned with the higher-timeframe signal.
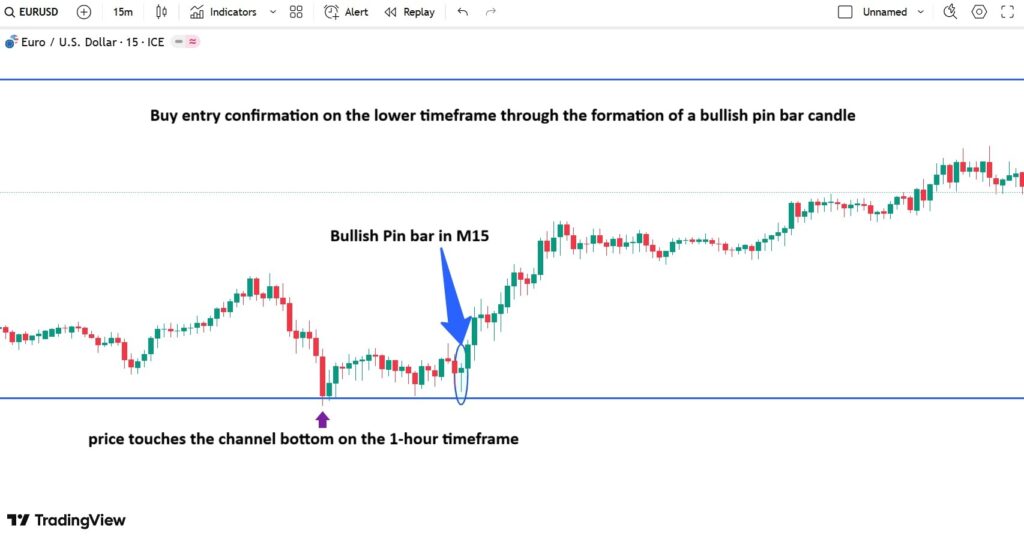
Al Brooks advises against entering a trade on a higher timeframe reversal signal unless it’s confirmed on a lower timeframe.
Range Phase Start and End Signals in Al Brooks’ Approach
According to Al Brooks, markets are constantly rotating between three primary phases:
- Trend;
- Transition;
- Range.
Accurately identifying these phases and the transition points between them is the key to trading success.
Signals Indicating the Start of a Range Phase
- Loss of Momentum in the Trend
The first sign that the market is entering a range phase is a decline in trend strength.
In an uptrend, this appears as smaller-bodied candles with long upper wicks near the highs.
In a downtrend, bearish candles weaken, and long lower shadows start to form, signaling a fading of selling pressure. - Formation of Double Top or Double Bottom Patterns
Al Brooks places strong emphasis on Double Tops during uptrends and Double Bottoms during downtrends as clear signs of trend exhaustion and the potential beginning of a range phase. - Failed Breakouts Beyond Previous Highs or Lows
When the market fails to break above resistance or below support, it reflects a balance between buyers and sellers, often leading to the creation of a sideways trading range. - Increase in Small-Bodied Candles
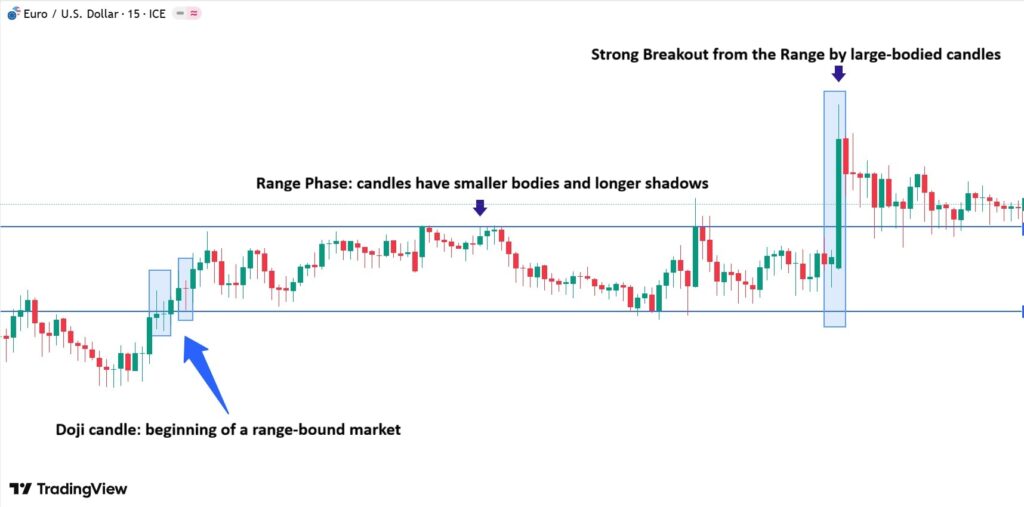
As the market transitions into a range, candles tend to have smaller bodies and longer shadows, representing indecision and uncertainty among market participants.
Signals Indicating the End of a Range Phase
According to Al Brooks, several technical signs suggest that the market is transitioning out of a range and preparing for a new trend phase.
- Strong Breakout from the Range
The clearest signal that the range phase is ending is a decisive breakout beyond one of the range boundaries. This breakout should be supported by rising trading volume and large-bodied candles, confirming strong participation and momentum in the breakout direction. - Formation of Micro Trend Patterns
Near the edges of a range, Brooks looks for a series of consecutive candles moving in one direction, indicating the emergence of a micro trend and an increased likelihood of a range breakout. - Price Compression on One Side of the Range
When price remains compressed near one boundary for an extended period, it often signals energy buildup and momentum accumulation, typically leading to a breakout in the opposite direction. - Change in Wave Structure
During a range phase, price swings are usually irregular and uneven in proportion. As a new trend emerges, this structure becomes more organized, exhibiting consistent directional waves that align with it.
Common Mistakes in Understanding Range Trading: Al Brooks Style
Success in Al Brooks’ range trading doesn’t come from using complex strategies — it comes from avoiding simple mistakes. Here are some of the most common ones:
- Trading in the Middle of the Range
This is the biggest trap. The best trade setups with the most favorable risk-to-reward ratios occur only near support and resistance boundaries — not in the middle of the range. - Ignoring the Higher Timeframe
Getting lost in a lower timeframe blinds your perspective. Always start by viewing the bigger picture on a higher timeframe to understand your position in the overall market structure. - Neglecting Risk Management
A sudden breakout from the range can wipe out your account. Your stop-loss should always be placed on the opposite side of the range. This is a rule, not a suggestion. - Overanalyzing and Fighting the Breakout
Don’t wait for the “perfect” signal or fight the market. When the range breaks decisively, accept it’s over and quickly adapt to the new market phase.
Conclusion
Al Brooks’ range trading approach allows traders to identify profitable opportunities even in sideways, non-trending markets. By relying on candlestick patterns and price action, you gain a deeper understanding of market behavior. You can spot the shifts in strength between buyers and sellers that signal high-probability trade setups.
Brooks emphasizes that patience is the cornerstone of successful range trading; you must wait for clear, price-based evidence before entering a trade, rather than acting on speculation or unrealistic forecasts.


