icon icon Home
icon icon Accounts
icon icon Quick start
icon icon Symbols

Measuring Selling Pressure with Alexander Elder’s Bears Power Oscillator on MetaTrader 4

Author
Abe Cofnas
Abe Cofnas
calendar Last update: 13 April 2026
watch Reading time: 11 min

Every candlestick records a battle. Buyers push for the high; sellers drive toward the low. The closing price shows who won the session, but it does not reveal how much power the losing side still holds. Alexander Elder designed the Bears Power indicator to answer precisely that question for the sell side: how far were sellers able to push price below the consensus level represented by the exponential moving average?

Built into MetaTrader 4 as a standard oscillator, Bears Power calculates the difference between each bar’s low and a 13-period EMA. When the histogram is below zero, sellers are pulling price beneath the average, demonstrating active bearish pressure. When it rises toward zero, that pressure is fading. Combined with a trend filter and its counterpart, Bulls Power, the indicator forms the core of Elder’s Elder-Ray trading system.

This guide explains the formula behind Bears Power, how to set it up on MT4, the specific buy and sell signals Elder prescribed, divergence analysis, and practical strategies for integrating the indicator into a forex trading workflow.

bookmark
Key Takeaways
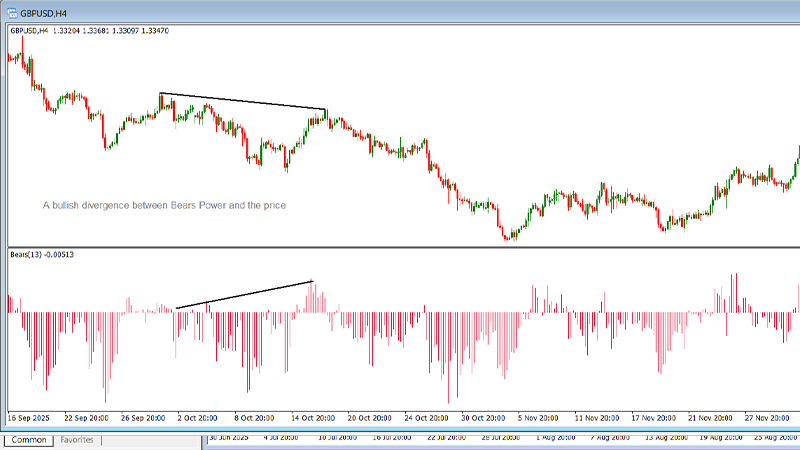
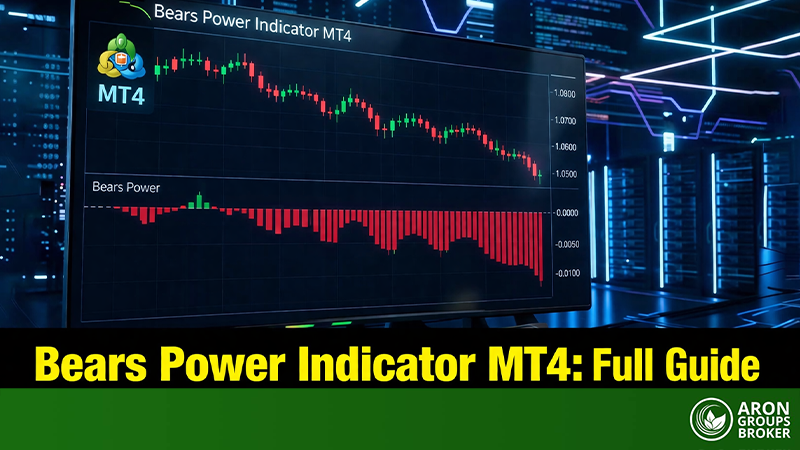
  • Bears Power measures selling pressure by calculating the difference between the bar's low price and the 13-period EMA.

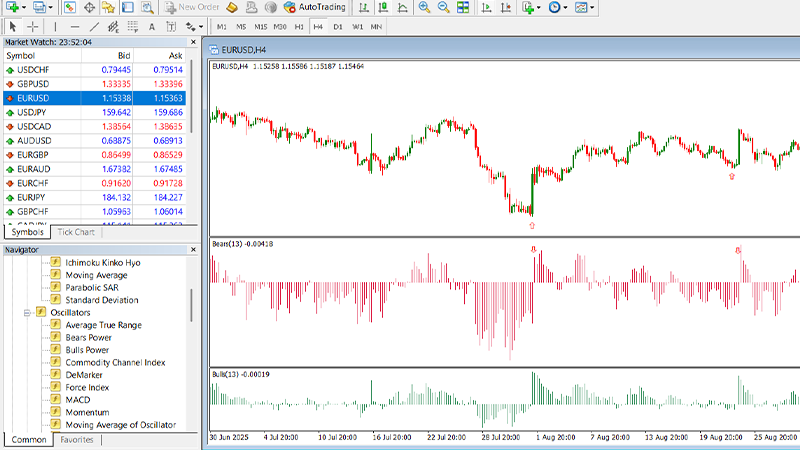
  • The indicator is built into MT4 under Insert, Indicators, Oscillators, Bears Power. No custom installation is required.

  • A rising Bears Power histogram (moving from deeply negative toward zero) whilst the EMA slopes upward is Elder's primary buy signal.

  • Bearish divergence between Bears Power and price warns that selling pressure is building beneath an apparently healthy uptrend.

  • Bears Power is designed to work alongside Bulls Power and a 13-period EMA, not as a standalone tool.

  • The indicator performs best on M30 to H4 timeframes. Lower timeframes produce excessive noise; daily charts produce infrequent signals.

What Is the Bears Power Indicator?

Bears Power is an oscillator developed by Dr Alexander Elder and introduced in his book Trading for a Living. It belongs to the Elder-Ray system, a framework that uses two oscillators, Bears Power and Bulls Power, alongside an exponential moving average to assess the balance of buying and selling forces in a market.

sms-star

Risk Disclosure

CFDs are complex instruments and come with a high risk of losing money rapidly due to leverage. You should consider whether you understand how CFDs work and whether you can afford to take the high risk of losing your money. Past performance is not indicative of future results. This content is provided for educational purposes only and does not constitute investment advice.

The Logic Behind the Calculation

Elder reasoned that the moving average represents the consensus price between buyers and sellers over a given period. The lowest price of each bar represents the maximum effort sellers were able to exert during that period. By subtracting the EMA from the bar’s low, the indicator isolates how far sellers managed to push price below the consensus. The formula is straightforward:

Bears Power = Low minus EMA (13)

When the low of the bar is below the EMA, the result is negative, indicating that sellers pulled price beneath the average. When the low is above the EMA, the result is positive, meaning sellers could not even reach the consensus level, a sign of strong bullish control.

How the Histogram Behaves

In a healthy downtrend, Bears Power readings are consistently negative, with the histogram bars extending below the zero line. As the downtrend weakens, the bars become shorter (less negative), reflecting diminishing selling pressure. In a strong uptrend, Bears Power typically hovers near or above zero because sellers lack the force to push the low beneath the rising EMA.

What Is the Bears Power Indicator?

Setting Up Bears Power on MetaTrader 4

Bears Power is included in the default indicator library on MT4. No download or custom installation is required.

Step-by-Step Setup

  • Open a chart for the instrument and timeframe you wish to analyse.
  • Click Insert in the top menu, then Indicators, then Oscillators, then Bears Power.
  • In the settings dialogue, leave the period at 13 (Elder’s recommended default) and set Apply to Low.
  • Optionally change the histogram colour to red for visual clarity.
  • Click OK. The Bears Power histogram will appear in a sub-window beneath the price chart.

To complete the Elder-Ray setup, add a 13-period EMA to the price chart (Insert, Indicators, Trend, Moving Average; set Method to Exponential, Period to 13, Apply to Close). Then repeat the oscillator process for Bulls Power, choosing a green colour to differentiate it from Bears Power.

sms-star

Trading Tip

Displaying Bears Power and Bulls Power in the same sub-window is possible but cluttered. Most traders use two separate sub-windows so that the histogram bars for each indicator remain visually distinct and easy to read at a glance.

Elder's Buy and Sell Rules Using Bears Power

Alexander Elder designed a specific set of conditions for entering trades using the Bears Power and Bulls Power indicators together with the 13-period EMA. These rules are not discretionary; they are structured conditions that must be met before a trade is considered.

Buy Signal Conditions

Elder’s buy setup requires two mandatory conditions and two optional strengthening filters:

Mandatory 1: The 13-period EMA is rising, confirming an uptrend.

Mandatory 2: Bears Power is below zero but moving upward toward the zero line. This indicates that selling pressure exists but is weakening.

Optional 1: The most recent peak in Bulls Power is higher than the previous peak, confirming strengthening demand.

Optional 2: A bullish divergence is forming between Bears Power and price, where price makes a lower low but Bears Power makes a higher low.

When both mandatory conditions are met, the trader looks for a long entry. The stop-loss is placed below the most recent swing low. The trade is exited when the EMA flattens or turns down, or when Bears Power begins making new lows.

Sell Signal Conditions

The sell setup mirrors the buy rules:

Mandatory 1: The 13-period EMA is falling, confirming a downtrend.

Mandatory 2: Bulls Power is above zero but declining toward the zero line. Buying pressure exists but is fading.

Optional 1: The most recent trough in Bears Power is lower than the previous trough, confirming increasing supply.

Optional 2: A bearish divergence is forming between Bulls Power and price, where price makes a higher high but Bulls Power makes a lower high.

Q: Can Bears Power be used as a standalone indicator?

A: Elder explicitly designed Bears Power to function within the Elder-Ray system alongside Bulls Power and the 13-period EMA. Using it in isolation removes the trend filter (the EMA) and the demand-side context (Bulls Power), which significantly reduces signal quality. As a standalone oscillator, Bears Power can still identify weakening selling pressure, but without the EMA confirming the trend direction, the risk of counter-trend entries increases.

Divergence Analysis with Bears Power

Divergence between the Bears Power histogram and price is one of the earliest warning signals that the balance of power is shifting. It often appears before the trend change is visible on the price chart itself.

Bullish Divergence

Bullish divergence occurs when price prints a lower low whilst Bears Power prints a higher low (a less negative reading). This indicates that although price is still declining, sellers are exerting less force with each push. When this divergence appears whilst the EMA is rising or flattening, it suggests that the downside move is a pullback within a larger uptrend and that a buying opportunity may be forming.

Bearish Divergence

Bearish divergence occurs when price prints a higher high whilst Bears Power also prints a higher reading that is closer to zero or positive but flattening. Viewed in isolation, this is less intuitive, which is why Elder recommends monitoring Bulls Power for the clearer bearish divergence: price makes a higher high, but Bulls Power makes a lower high. The combination of weakening Bulls Power and Bears Power remaining near its extreme negative readings confirms that the trend’s momentum is eroding.

Measuring Selling Pressure with Alexander Elder's Bears Power Oscillator on MetaTrader 4

Bears Power vs Bulls Power: How the Two Indicators Work Together

The Elder-Ray system derives its analytical power from reading both indicators simultaneously. Each measures one side of the market; together they provide a complete picture of the supply-and-demand balance.

Bears PowerBulls Power
Formula: Low minus EMA(13)Formula: High minus EMA(13)
Measures maximum selling pressure per barMeasures maximum buying pressure per bar
Negative = sellers pushing below consensusPositive = buyers pushing above consensus
Rising toward zero = weakening sellersFalling toward zero = weakening buyers
Buy signal: below zero but rising, EMA upSell signal: above zero but falling, EMA down
Bullish divergence: lower price low, higher indicator lowBearish divergence: higher price high, lower indicator high

In a strong uptrend, Bulls Power stays well above zero whilst Bears Power remains near zero or only briefly dips below it. In a strong downtrend, Bears Power stays deeply negative whilst Bulls Power struggles to reach or stay above zero. The transition between these states, when Bears Power begins rising from extreme lows and Bulls Power begins climbing, marks the early stage of a potential trend reversal.

Practical Strategies for Trading with Bears Power

Beyond Elder’s original rules, several practical approaches have emerged among forex traders who incorporate Bears Power into their analysis.

Pullback Entry in an Uptrend

When the 13-EMA is rising and price pulls back, Bears Power dips below zero temporarily. The trader waits for Bears Power to begin rising back toward zero and enters long when the histogram bar is less negative than the previous bar. The stop sits below the pullback low, and the target is the most recent swing high or beyond. This approach uses Bears Power as a timing tool within an already confirmed trend.

Combining Bears Power with RSI

Adding a 14-period Relative Strength Index provides a momentum filter. When Bears Power is negative but rising and RSI is simultaneously climbing out of oversold territory (below 30), the confluence of fading selling pressure and recovering momentum strengthens the buy signal. This combination reduces the frequency of false signals during choppy, range-bound conditions where Bears Power alone may produce premature entries.

Mini Example: XAUUSD H4 Pullback Entry

  1. The 13-EMA on the H4 gold chart is sloping upward, confirming a bullish trend.
  2. Price pulls back from 2 350 to 2 320 over three sessions. Bears Power dips to minus 8.5.
  3. On the fourth session, Bears Power rises to minus 5.2, and the RSI crosses above 35.
  4. A buy order is placed at 2 325 (above the pullback candle’s high). Stop-loss at 2 312 (below the swing low). Target at 2 360 (previous high).
  5. Price resumes the uptrend and reaches the target in two sessions, delivering a 1:2.8 risk-to-reward ratio.


Q: What timeframes work best for Bears Power?

A: Alexander Elder originally designed the indicator for daily charts. In modern forex trading, the M30, H1, and H4 timeframes strike the best balance between signal frequency and reliability. Timeframes below M15 produce excessive noise because the low-to-EMA calculation becomes erratic on very short bars. Weekly charts produce valid signals but with long waiting periods between setups.

Read More: Candlestick Analysis and Trading with Candlestick Patterns

Limitations of the Bears Power Indicator

Understanding what the indicator cannot do is as important as knowing what it can.

Lagging Nature

Bears Power is calculated from the EMA, which is itself a lagging average. This means the indicator confirms a shift in selling pressure after it has already begun, not before. Traders who require leading signals should pair Bears Power with price action analysis or candlestick pattern recognition for earlier entries.

Unreliable in Ranging Markets

When price moves sideways, the EMA flattens and the low oscillates around it, causing Bears Power to flicker between small positive and negative values. These readings carry little informational value and frequently generate false signals. The indicator’s effectiveness is tied to trending conditions, which is why the EMA direction serves as a mandatory filter in Elder’s system.

Does Not Measure Volume

Bears Power measures price spread (how far the low is from the EMA) but not volume. A bar with a low that stretches far below the EMA on thin volume may produce a strong Bears Power reading that exaggerates the actual selling conviction. On MT4, pairing the indicator with tick volume analysis provides a more complete assessment of whether the selling pressure is backed by genuine participation.

Read More: How to Make Better Decisions Through Volume Analysis

Conclusion

Bears Power strips the price chart down to a single question: how much force are sellers exerting relative to the market’s consensus? By measuring the distance between each bar’s low and the 13-period EMA, the indicator provides a clean, continuous reading of selling pressure that traders can use to time entries during pullbacks, spot divergence before reversals, and confirm the health of an existing trend.

The indicator is most effective when used as Elder intended: alongside Bulls Power and a 13-period EMA, within a trending market, and on timeframes from M30 to H4. Add volume or RSI confirmation for additional filtering, respect the EMA’s direction as a non-negotiable trend filter, and the Bears Power oscillator becomes a disciplined component of a broader analytical framework.

Continue Reading
not-found
calendar 13 April 2026
Rate this article
Plugin not installed

Leave a Reply

Your email address will not be published. Required fields are marked *

No thanks