icon icon Home
icon icon Accounts
icon icon Quick start
icon icon Symbols

Balanced Price Range in ICT: From Imbalance to Equilibrium

Author
Abe Cofnas
Abe Cofnas
calendar Last update: 21 February 2026
watch Reading time: 19 min

A balanced price range (BPR) is an ICT idea that describes a “middle zone” on a chart where price often pauses and evens out after a strong move. Think of it as the market trying to restore balance after a brief stretch of disorder.

Even if you are new and wondering what is balanced price range, you can learn to spot these areas with a few simple visual rules. Keep reading to the end and you will see how a balanced price range ICT zones can help you make calmer, more structured decisions on a chart.

bookmark
Key Points:
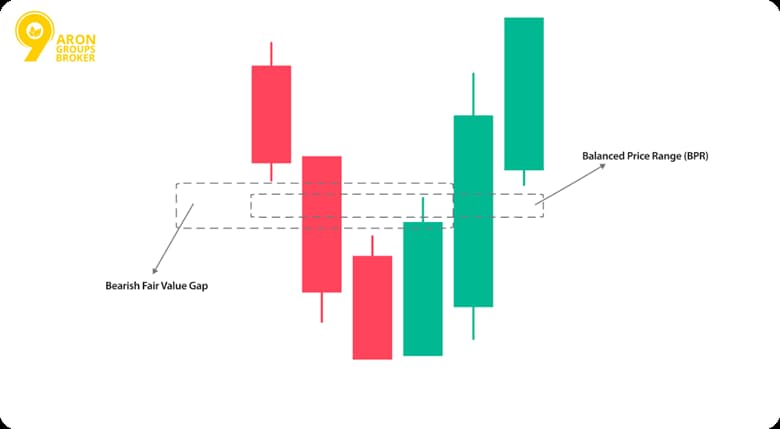
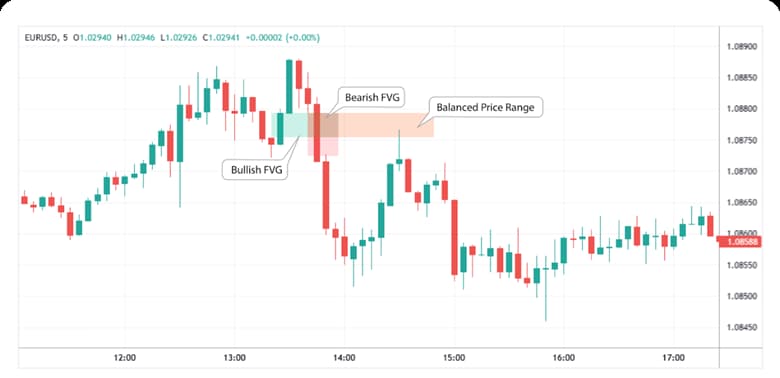
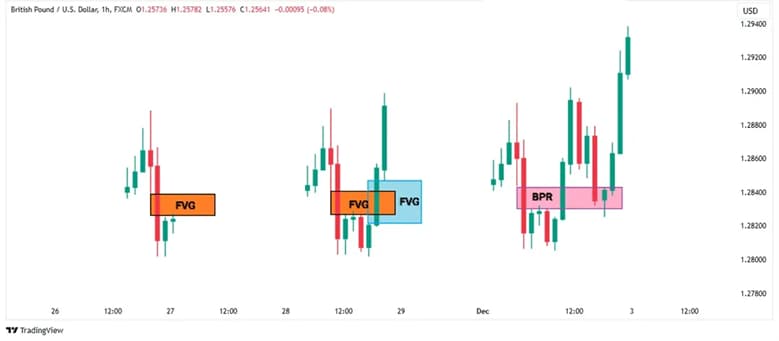
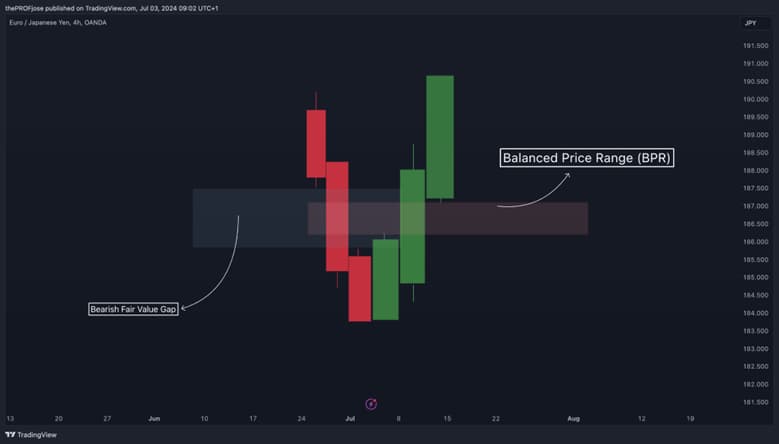
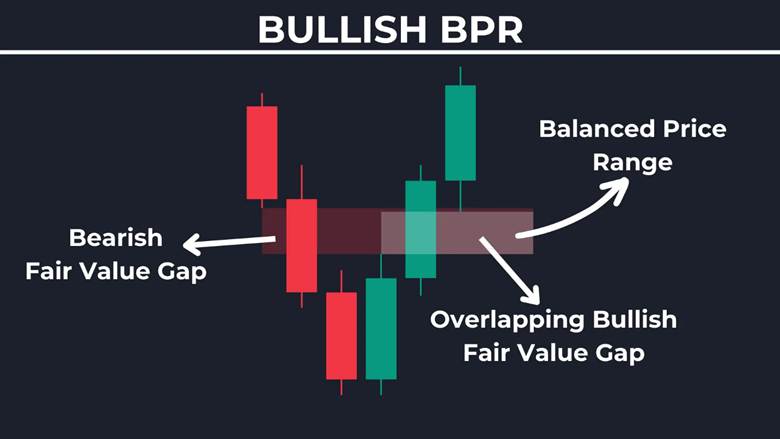
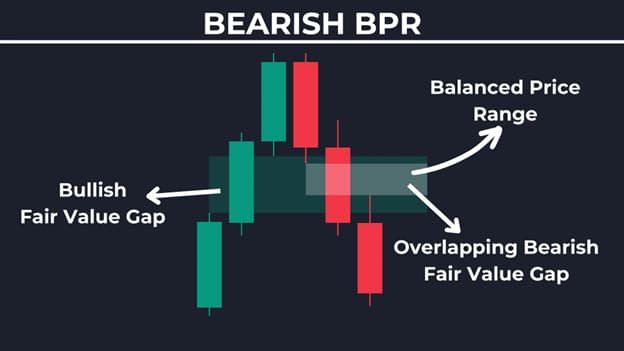
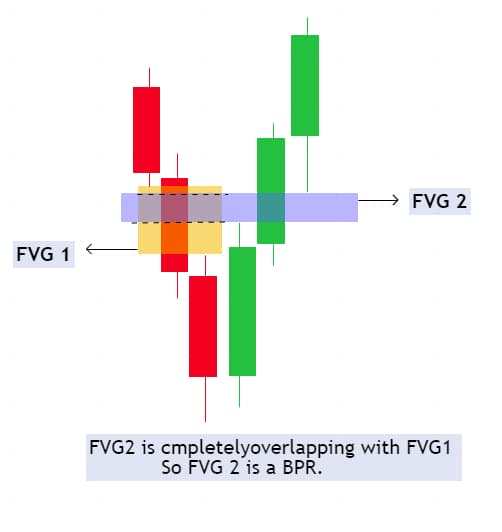
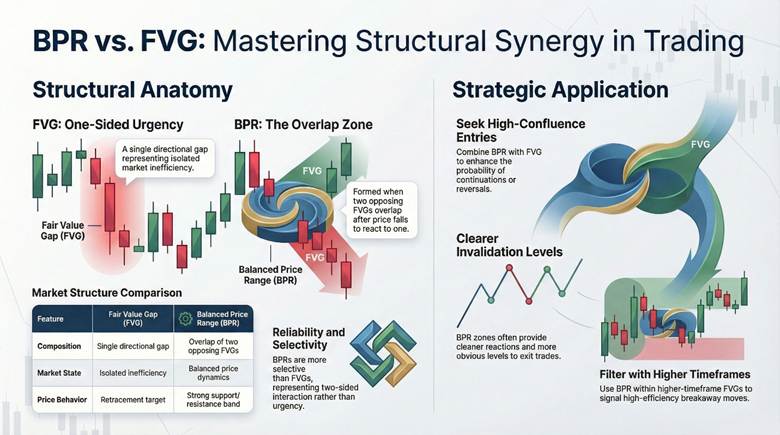
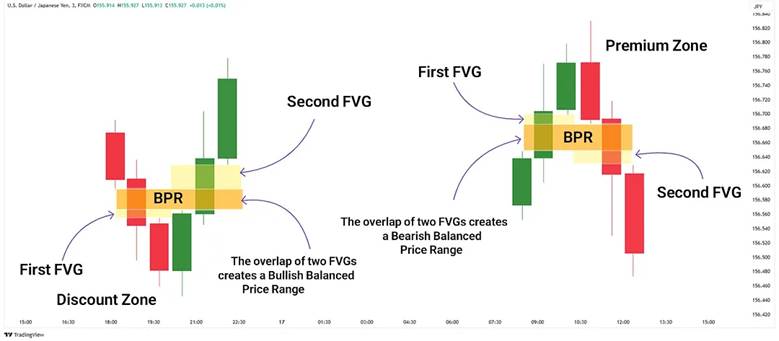
  • Balanced Price Range forms from overlapping opposite Fair Value Gaps, creating temporary equilibrium zones where buyers and sellers balance out.
  • These zones act as high-probability magnets, drawing price back for pullbacks, reversals, or continuations before major moves resume.
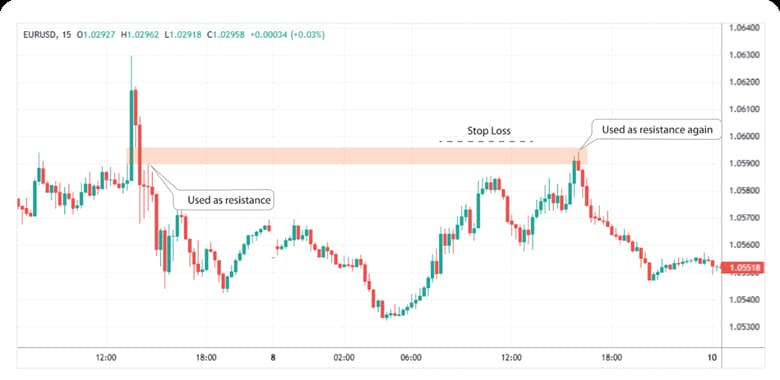
  • BPR edges serve as dynamic support/resistance levels, offering clearer entry points when confirmed across multiple timeframes.
  • Integrating BPR with tools like order blocks and liquidity analysis boosts confluence, but always combine with strict risk controls due to inherent market uncertainty.

Introduction to Balanced Price Range (BPR) in ICT

The balanced price range is a core element of ICT trading. It marks zones where price finds a temporary equilibrium after periods of volatility.

Traders use these areas to spot potential pullbacks and make informed decisions.

BPR forms from overlapping fair value gaps. This creates a balance between market forces. Beginners can leverage it for entry points in volatile assets like forex.

Balanced Price Range

What Is a Balanced Price Range in ICT Trading?

A balanced price range in ICT trading forms when two opposing FVG structures overlap horizontally. In practical terms, this overlap creates a temporary balance between buyers and sellers, producing a structured equilibrium rather than random consolidation.

According to InnerCircleTrader.net, it occurs where fair value gaps align horizontally. Mark a sell-side gap and a buy-side gap opposite each other. The shared area becomes the BPR in ICT.

Traders spot this on charts after rapid moves. It offers defined risk levels for entries. Always consider that trading involves the risk of capital loss.

sms-star

Key Insight:
BPR zones often precede strong moves, offering entry points with defined risk levels in volatile markets like forex.

Q: How does BPR differ from basic ranges?

A: BPR specifically involves FVG overlaps in ICT, unlike general ranges which lack institutional context; it signals rebalancing for potential reversals or continuations, always with risk disclaimers.

ICT Definition of Price Balance

Price balance in ICT describes an equilibrium where buy and sell pressures equalise. This state emerges after market imbalances. It leads to temporary stability visible on charts.

It reflects neutral zones created by overlapping gaps. These create a price returning to balance. Boundaries act as dynamic support or resistance.

Such a balance reduces inefficiency in price action. It attracts further activity from market participants. Note the price balance after the imbalance as a key signal.

Balanced Price Range
sms-star

Did you know:
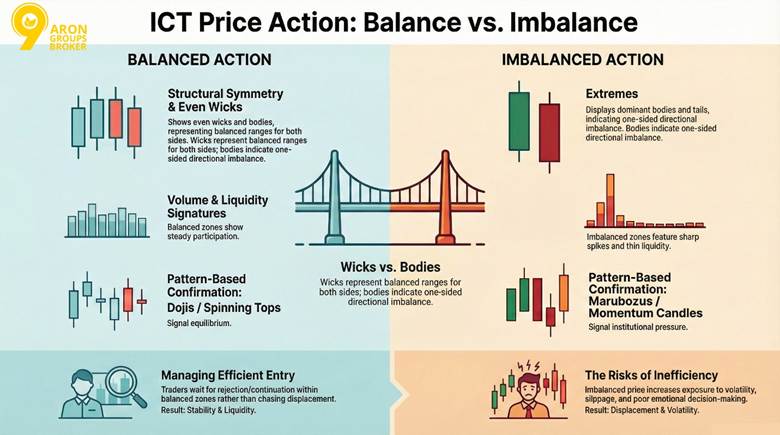
In ICT, price balance reduces inefficiency, attracting institutional orders for efficient execution.

BPR in the Context of Smart Money Concepts

BPR ties directly to smart money concepts in trading. Institutions often target these balanced zones for strategic positioning. It highlights areas of high interest amid market shifts.

Rapid up and down moves create overlaps. This forms the balanced price range that ICT traders use. It represents rebalancing price action effectively.

In balanced price range trading, align with institutional flows. This enhances predictability without hype. Focus on balanced vs imbalanced prices for better outcomes.

Why Institutional Order Flow Targets Equilibrium Zones

Institutions pursue equilibrium zones in BPR for optimal order execution. These areas ensure efficient matching of buys and sells. It minimises costs in dynamic markets.

According to TrendSpider, strong reactions occur at BPR edges. Price efficiency ICT improves here due to balanced forces. This draws significant volume and activity.

New balance price range zones act as magnets. They support mean reversion strategies. Always apply disclaimers on trading risks.

Formation of Balanced Price Range After Market Imbalance

Markets often shift from imbalance to equilibrium. This process creates a balanced price range. It occurs as price corrects inefficiencies left by rapid movements.

Visual examples on charts show how gaps overlap to form these zones. Traders spot them post-volatility for potential entries.

Balanced Price Range

Price Imbalance and Delivery Inefficiency Explained

Price imbalance happens when one-sided pressure dominates. This creates gaps in the chart. Buyers or sellers overwhelm the market temporarily.

According to The ICT Trader, inefficiency stems from quick rallies or sell-offs. These leave unfilled areas. Price then seeks to balance them.

Compare balanced vs imbalanced price action. Balanced delivery shows even participation. Imbalanced ones signal opportunities for reversal.

sms-star

Key Point:
Imbalance often stems from news events, creating opportunities for BPR formation post-volatility.

How Price Naturally Returns to Balance

Mean reversion drives the price back to equilibrium. Deviations from the average pull it toward stability. This restores balance after extremes.

price returns to inefficient zones. It fills gaps created by imbalances. Supply and demand shifts facilitate this.

New balance price range emerges here. It marks the area of rebalancing price action. Use tools like Fibonacci retracement to measure potential returns.

Q: What triggers price return?

A: Supply/demand shifts; in forex, economic data can initiate this, but always apply stop losses as markets may not revert immediately. Consider factors like interest rates influencing these shifts, and test with a forex demo account to avoid capital risks in live trading.

Algorithmic Repricing and Equilibrium in ICT

Algorithms drive repricing toward equilibrium. They scan for imbalances and adjust orders. This ensures efficient market flow.

According to LuxAlgo, algos target zones without gaps. This promotes balanced price range trading. It enhances price efficiency ICT.

In high-frequency settings, this process speeds up. Traders align entries with these dynamics. Risk disclaimers apply to all setups.

FactorRole in Repricing
AlgorithmsDetect overlaps
EquilibriumBalances orders

 Time vs Price: Key Drivers of Market Rebalancing

Rebalancing price action can occur through time or price adjustment. Time-based correction happens when markets consolidate sideways until efficiency improves. Price-based correction involves a sharp retracement into imbalance zones.

Traders frequently measure retracement depth using tools such as Fibonacci retracement, helping identify potential equilibrium levels inside a developing balanced market structure.

sms-star

Warning:
A balanced price range increases probability, not certainty. Volatility events may invalidate equilibrium expectations. Always assess higher-timeframe bias and protect capital when trading imbalance reactions.

Balanced vs Imbalanced Price Action in ICT

Price action in ICT reveals key differences between balanced and imbalanced states. These contrasts help traders spot stability or momentum. Focus on chart structures without revisiting earlier definitions.

Structural Differences in Price Delivery

Balanced price action features even wicks and bodies on candles. This shows equal buyer and seller participation. Imbalanced action displays extremes with dominant bodies or long tails.

wicks represent balanced ranges offering both sides. Bodies indicate imbalance by favouring one direction. Compare balanced vs imbalanced prices for clearer setups.

Balanced Price Range
sms-star

Key Insight:
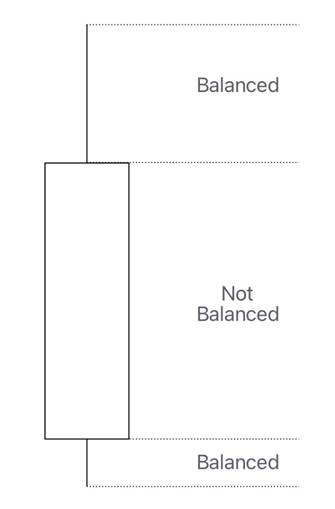
Balanced action shows equal wicks, signalling stability, unlike imbalanced spikes.

Candlestick Patterns Signalling Balanced vs Imbalanced Price

Candlestick behaviour provides visual confirmation of structural intent. In an ict balanced price range analysis, specific patterns help traders identify price balance after an imbalance.

Common examples include:

  • Doji: Balance signal.
  • Spinning Top: Temporary equilibrium.
  • Marubozu: Imbalance and strong displacement.
  • Long-bodied Momentum Candle: Institutional pressure.

Q: Which patterns indicate imbalance?

A: Long-tailed or large-bodied candles reflect one-sided dominance. These contrast with balanced dojis that show indecision. However, confirm with volume analysis to avoid false signals in volatile markets.

Volume and Liquidity Signatures of Imbalance

Volume behaviour further distinguishes balanced vs imbalanced price conditions. Imbalanced delivery often occurs with sharp volume spikes, yet thin liquidity between levels can create inefficient price movement.

In price efficiency ICT terms, balanced zones typically show steadier participation, suggesting improved liquidity conditions.

Trading Implications of Efficient vs Inefficient Price

Efficient delivery inside a balanced zone often provides structured entry opportunities with defined risk. In balanced price range trading, traders wait for confirmation of rejection or continuation within equilibrium rather than chasing displacement.

Inefficient price, by contrast, may signal strong trend conditions but increases exposure to volatility and slippage.

Successful interpretation requires disciplined risk control and strong trading psychology, as emotional reactions to imbalanced spikes frequently lead to poor decision-making.

Balanced Price Range

Identifying BPR on Charts

Spotting a balanced price range on a chart is mainly a visual skill. You are looking for a specific overlap pattern, not just “sideways movement”.

In ICT terms, BPR marks a structured equilibrium where price can rebalance after volatility. Use clean charts first, then add tools only if they improve clarity.

Key Visual Characteristics of a Balanced Price Range

A BPR is easiest to recognise when two opposing fair value gaps overlap on the same price levels.

The overlap is the “balanced” portion, because it sits between competing pressure zones. Many traders start by marking FVGs first, then checking where they intersect.

Balanced Price Range
CharacteristicDescription
OverlapFVG intersection
WidthNarrow equilibrium
sms-star

Tip:
If the overlap is very wide, treat it as a zone. Avoid single-price precision in volatile forex pairs.

Recognising Bullish vs Bearish Balanced Zones

Direction distinguishes bullish from bearish zones. Bullish BPR emerges after pullbacks with upward gap overlaps. Bearish forms post-rallies with downward alignments.

Balanced Price Range

Bullish zones show buy pressure in overlaps. Bearish highlights sell dominance. Balance price range ict aids differentiation. Ict balanced price range varies by context in BPR in ICT.

Balanced Price Range

Q: How to spot bullish BPR?

A: Look for an upward overlap after a dip, then a clean retest into the zone. For bearish, reverse the logic. Use multi-timeframes for confirmation, and manage risk with invalidation levels.

Distinguishing BPR From Consolidation

Consolidation is a general pause where the price oscillates between a high and a low. A BPR is more specific because it is built from overlapping inefficiencies.

That makes it more actionable for ICT-based mapping, especially when the price is returning to balance after an imbalance.

BPR is identified by marking the overlapping area between opposing FVGs, rather than treating any range as meaningful.

Balanced Price Range
sms-star

Key Point:
Consolidation lacks FVG overlap, making BPR more precise for ICT setups.

Multi-Timeframe Confirmation of Balanced Price Range

Higher timeframes validate BPR signals. Align hourly zones with daily charts. This ensures robustness against noise.

According to Flux Charts, cross-frame confirmation strengthens entries. Spot consistent overlaps across scales.

New balance price range gains credibility this way. Price balance after the imbalance appears clearer on larger views.

Balanced Price Range vs Fair Value Gap (FVG)

BPR and FVG serve distinct purposes in ICT despite their relation. BPR delivers greater reliability through overlap. This strengthens zones compared to single gaps in balanced vs imbalanced price dynamics.

Balanced Price Range

Structural Differences Between BPR and FVG

BPR forms from the overlap of two opposing FVGs. A single FVG represents one directional gap. This creates a balanced zone versus isolated inefficiency.

BPR requires one FVG to break without reaction. The opposing gap then forms within the same area. This overlap defines the balanced price range pdf structure clearly.

Note: A BPR is not “better” than an FVG in every situation. It is simply more selective because it requires two opposing moves to overlap and show balance after volatility.

How Price Respects Balanced Price Range Over FVG

When price returns, BPR can behave like a stronger support or resistance band because it represents a two-sided interaction rather than one-sided urgency.

This often aligns with improved price efficiency ICT behaviour, where reactions are cleaner and invalidation levels are clearer.

To make these zones more tradable, some traders confirm them with a support and resistance indicator tradingview overlay, but only as a visual aid.

Applications of BPR and FVG in Entry Setups

Combine BPR with FVG for high-confluence entries. Enter at the edges when alignments appear. Stress-test thoroughly in demo accounts first.

According to TradeZella, FVGs provide retracement targets. BPR enhances these for continuation or reversal. Balanced price range trading benefits from this pairing.

sms-star

More Info:
Pair BPR with FVG for confluence, enhancing probability but not guaranteeing profits. Use multi-timeframe confirmation and strict position sizing to manage exposure effectively in volatile conditions.

Avoiding False Signals With Overlapping FVGs

Filter signals using volume and timeframes. Require confirmation before acting. This prevents traps in overlapping areas.

balanced ranges inside FVGs signal efficiency. Unfilled halves indicate breakaway moves. BPR in ICT demands higher-timeframe bias. Price returning to balance confirms validity.

Balanced Price Range

Price Efficiency and Market Structure Within BPR

Internal dynamics in BPR reveal how price achieves balance. These zones show efficient order flow. Traders use them for precise entries.

Understanding Price Efficiency in ICT

Price efficiency in ICT means optimal filling of orders without gaps. It occurs when the buy and sell sides match evenly. This creates stable zones for trading.

efficiency emerges from overlapping gaps. Ict balanced price range zones minimise slippage. Price efficiency ICT supports smooth execution.

sms-star

Key Insight:
Efficiency in BPR minimises slippage, ideal for scalpers in forex. Focus on volume confirmation to ensure stable entries while maintaining strict risk management protocols in volatile sessions.

Balanced Market Structure Formation

Market structure builds through layered highs and lows in BPR. Price consolidates as forces equalise. This forms reliable patterns for analysis.

Overlaps create entry points. Balanced market structure develops post-pullback. Rebalancing price action strengthens the zone.

Order Matching Inside Equilibrium Zones

When a BPR holds, buyers and sellers are often matching more actively near the same prices. That can support price balance after an imbalance, because fewer levels are skipped during trading.

BPRs develop after quick moves in both directions create overlapping FVGs, producing a structured equilibrium zone.

  • Matches can reduce short-term volatility.
  • Improved matching often attracts more volume.
sms-star

Tip:
If you are asking “what is a balanced price range” in practical terms, treat it as a mapped zone for reaction, then wait for confirmation. Entering too early inside the equilibrium often leads to unnecessary drawdowns.

Continuation and Reversal Patterns From BPR

Patterns like flags signal continuation from BPR. Reversals occur on breaks with volume. Always apply risk disclaimers.

Balanced price range often precedes flags in trends. Compare balanced vs imbalanced prices for signals. Test patterns in demo accounts.

Q: When does reversal occur?

A: Reversal risk rises when the BPR breaks with strong participation and follow-through. If price holds and reacts cleanly, continuation is more likely. Trading CFDs involves risk of loss of capital, so always use defined stops.

Liquidity Dynamics Around Balanced Price Range

Liquidity flows shape BPR behaviour. These zones pool orders strategically. Institutions target them for execution.

Liquidity Distribution Within BPR Zones

Liquidity spreads evenly across BPR zones. This creates balanced participation. It supports stable price action.

overlaps form liquidity magnets. Balanced price range ict draws volume. New balance price range enhances BPR in ICT.

Internal vs External Liquidity Around Balanced Price Range

Internal liquidity consists of resting orders within BPR. External builds beyond edges. This dynamic influences breaks.

According to TrendSpider, internal pools stabilise zones. Price efficiency ICT relies on this. A balanced market structure maintains the balance.

sms-star

Did You Know:
External liquidity builds outside BPR, often triggering expansions. Monitor liquidity risk by using multi-timeframe analysis to avoid false breaks in high-volatility periods like news releases.

Resting Liquidity Pools Inside BPR

Resting pools inside BPR attract institutions. These hold unfilled orders. They provide execution opportunities.

External range liquidity is commonly framed around highs and lows, while internal liquidity is analysed within the dealing range.

Institutional Accumulation and Distribution Patterns

Within a BPR, accumulation can appear as repeated support defended within the zone.

Distribution can appear as repeated failure to hold bids, followed by sharp expansion away. These behaviours often align with price returning to balance before the next move.

To handle liquidity-driven whipsaws, apply strict risk management rules, including predefined invalidation and position sizing.

BPR as a PD Array in ICT

BPR integrates with premium and discount arrays in ICT. These zones classify price relative to equilibrium. Traders use them for optimal entries.

Balanced Price Range

Classifying BPR Within Premium and Discount Arrays

BPR fits into PD contexts by aligning with premium or discount zones. Bullish BPR resides in discount areas below the equilibrium. Bearish BPR occupies premium zones above it.

BPR forms from overlapping FVGs in these arrays. Balance price range ict enhances classification for directional bias.

How BPR Acts as Support or Resistance

In an uptrend, an ict balanced price range may behave like support when price revisits it during a pullback.

In a downtrend, the same type of zone may act like resistance. The key is whether price delivery looks balanced vs imbalanced at the retest.

Balanced Price Range
sms-star

Key Point:
BPR resistance can hold in downtrends, and BPR support can hold in uptrends. Test it historically on your instrument, because volatility regimes can change how reliably price respects equilibrium zones.

Confluence Between BPR and PD Array Levels

Confluence means two independent ideas point to the same area. When BPR in ICT aligns with premium/discount positioning, traders often gain clearer invalidation and better-defined risk.

This can improve price efficiency in ICT execution because the entry logic becomes less ambiguous.

Mean Reversion Strategies Using PD Array Alignment

Mean reversion approaches often assume the price will revisit an average or “fair” area after an extreme move.

When a BPR sits near equilibrium, traders may use it as the target zone for rebalancing price action, then refine entries at the edges of the zone.

To control losses when a reversion does not happen, use structured position size calculator rules and pre-defined stop placement.

sms-star

TIP:
PD alignment improves structure, not certainty. Trading CFDs involves the risk of loss of capital. If the BPR fails with strong momentum, exit quickly and reassess, rather than widening stops or averaging down.

Balanced Price Range Within the ICT Dealing Range

BPR integrates seamlessly with dealing ranges in ICT. These ranges span between recent swing highs and lows. They serve as zones for institutional accumulation and distribution.

Internal Rebalancing Inside the Dealing Range

Rebalancing occurs within dealing ranges through price adjustments. Institutions target premium and discount zones. This restores equilibrium after deviations.

Dealing ranges form between swing highs and lows that capture liquidity. What is balanced price range involves filling gaps internally. Price balance after an imbalance draws activity back.

Traders use this for entries in forex trading setups. Always apply risk management to protect capital.

Equilibrium Zones at Dealing Range Extremes

When equilibrium forms near the dealing range edges, it can carry more directional risk and reward.

Extremes may align with stop clusters and “draw on liquidity”. If a BPR overlaps those zones, reactions can become sharper.

sms-star

More Info:
Dealing with range extremes sometimes overlaps BPR zones, signalling possible breaks. If price re-enters the range quickly, it may be a liquidity probe. If it holds outside, the expansion risk increases.

Expansion and Contraction From Balanced Delivery

Markets often alternate between contraction (compression) and expansion (displacement). A balanced zone can represent contraction, where delivery becomes more even. After that, the price may expand away once liquidity is resolved.

Inside-bar compression reflects volatility contraction, while “outside” behaviour often signals volatility expansion. These phases help explain balanced vs imbalanced prices around equilibrium areas.

Shifts From Balanced to Imbalanced Market Structure

A shift happens when the price stops rotating evenly and starts displacing with urgency. Common triggers include liquidity sweeps at range edges, session opens, and macro releases.

When a BPR fails with follow-through, the market can flip from balanced delivery to an imbalanced structure quickly.

Q: What confirms a shift from balance to imbalance?

A: Look for displacement that closes away from the BPR, then holds on a retest. If the move lacks follow-through, treat it as noise. Trading CFDs involves risk of loss of capital, so use predefined invalidation and stops.

Trading Strategies Using Balanced Price Range

Practical strategies leverage BPR for entries in trends. Emphasise risks like capital loss in CFD trading. Test setups in demo accounts first.

High-Probability Entry Setups Within BPR

Entries target BPR edges during pullbacks. In bullish trends, buy at the lower edges. In bearish, sell at the upper edges. Balanced price range ict zones offer confluence. Ict balanced price range aligns with the BPR in ICT for precision.

  • Buy at the lower edge.
  • Sell at the upper.

Combining BPR With Order Blocks and Liquidity

Seek confluence by aligning BPR with order blocks. Liquidity grabs enhance entries. Price efficiency of ICT improves in these zones. Balanced market structure supports reliable signals.

sms-star

Did You Know:
Order blocks near BPR enhance setups, but overtrading risks capital. Use position sizing and stop-losses to protect against volatility in forex or CFD markets.
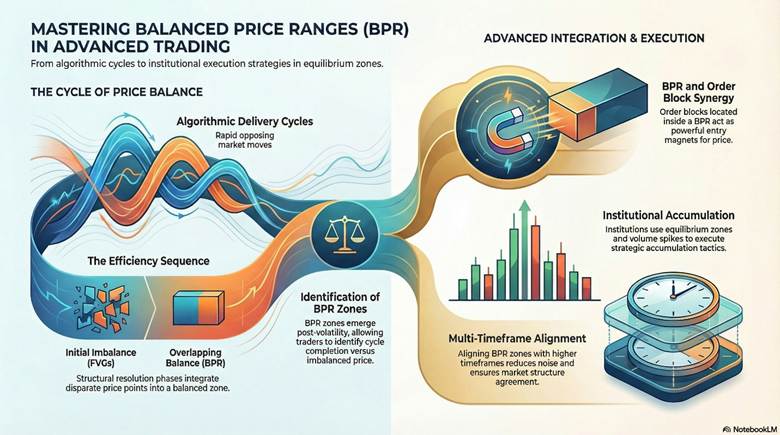
Q: How to combine?

A: Align BPR with blocks for entries; use liquidity grabs, always with position sizing. Incorporate volume confirmation to avoid false breaks, as markets remain unpredictable.

Continuation and Reversal Trade Models

Continuation models see price fill BPR then resume trend. Reversal models trigger on BPR breaks with volume. Balanced price range trading uses these for direction. Price balance after an imbalance often precedes shifts.

Risk Management Techniques for BPR Trades

Place stops beyond BPR edges. Use proper sizing based on account risk. Balanced price range demands disclaimers on losses. Rebalancing price action requires discipline. Apply risk management consistently.

Advanced ICT Models Incorporating BPR

Deeper models integrate BPR with algos and institutions. These enhance analysis beyond the basics.

Balanced Price Range

Algorithmic Delivery Cycles and Price Balance

Algo cycles create BPR through rapid opposing moves. These form overlaps for balance. Balance price range ict zones emerge post-volatility. Compare balanced vs imbalanced prices for cycle identification.

Interaction Between BPR and Order Blocks

BPR interacts with order blocks as entry magnets. Blocks inside BPR signal key levels. Price returning to balance fills these. BPR in ICT strengthens block reactions.

sms-star

Key Insight:
Blocks within BPR signal accumulation, guiding advanced entries. Confirm with higher timeframes to reduce noise, ensuring alignment with the overall market structure.

Sequencing Balance and Imbalance in Price Action

The sequence starts with an imbalance creating FVGs. Overlaps form balance in BPR. New balance price range follows resolutions. Price efficiency ICT tracks these phases.

Institutional Execution Strategies Inside Equilibrium

Institutions accumulate in equilibrium zones. Watch volume spikes for activity. Balanced market structure attracts orders. Rebalancing price action reveals tactics.

Conclusion

A balanced price range helps you frame equilibrium in ICT as a decision zone, not a prediction tool. It can improve timing by highlighting where a price balance after an imbalance may attract a reaction. Keep testing balanced price range ICT ideas on a demo, because what is balanced price range in theory can behave differently in live volatility. Risk control always comes first.

Continue Reading
not-found
calendar 21 February 2026
Rate this article
Plugin not installed

Leave a Reply

Your email address will not be published. Required fields are marked *

No thanks