icon icon Home
icon icon Accounts
icon icon Quick start
icon icon Symbols

Getting to Know the Best Indicators for Professional Swing Trading on Short Time Frames

Author
Abe Cofnas
Abe Cofnas
calendar Last update: 23 December 2025
watch Reading time: 8 min

Swing trading is one of the most popular trading styles. In this approach, traders aim to profit from short-term price swings across smaller time windows. To make this strategy work consistently, you need indicators that fit short time frames and reduce guesswork.

Many traders ask a simple question: which indicators are actually useful for swing trading? More specifically, which tools can identify high-quality entry and exit timing on short time frames?

In this article, you will explore several of the best swing trading indicators for daily and hourly charts.

bookmark
Key Points:
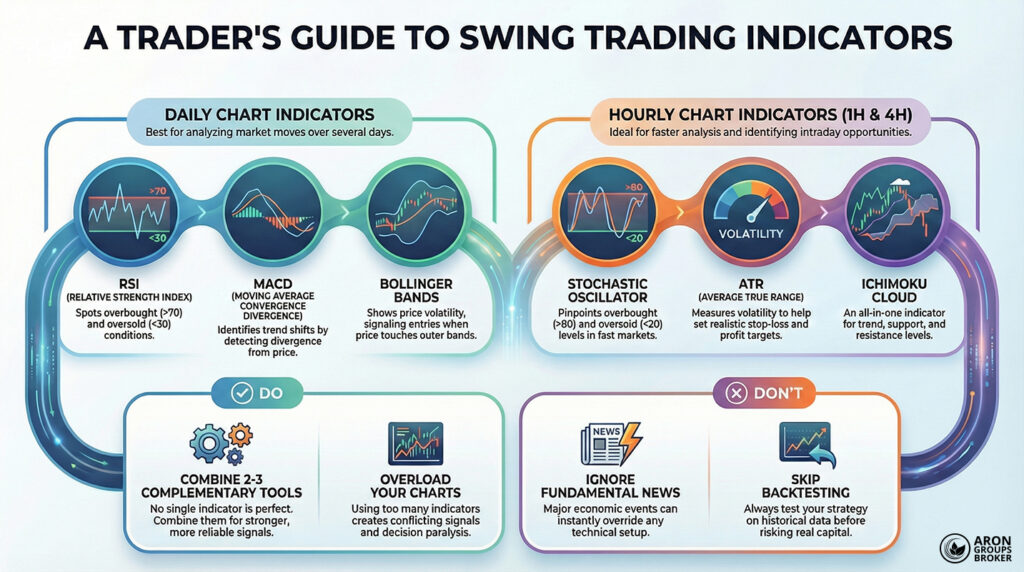
  • Swing trading without precise tools, like indicators, often turns into guessing rather than disciplined, professional analysis.
    Content Guidelines
  • No single indicator is complete, so combine two or three complementary tools, including support and resistance, for stronger signals.
    Content Guidelines
  • Overloading charts with indicators, ignoring fundamentals, and skipping backtesting are common mistakes that can cause heavy swing-trading losses.
    Content Guidelines

What is swing trading, and why does it need indicators?

According to ForexTester, Swing trading is a popular method in financial markets such as forex, equities, and crypto. 

In this style, the main goal is to profit from short-term price fluctuations over a few hours to days. Traders enter positions, target a defined move, and then exit once that move plays out.

Because decisions must be fast and price changes can be sharp, traders need tools that improve directional judgment. That is why using indicators matters in swing trading, especially on hourly and daily time frames.

Technical indicators such as Moving Average Convergence Divergence (MACD), Relative Strength Index (RSI), moving averages, and Bollinger Bands help with timing entries and exits. 

They also reduce the risk of short-term trades by adding structure to what could otherwise be emotional decisions. Without these tools, decisions often rely on instinct, and that can compound losses quickly.

best indicators for swing trading

Features of a good swing trading indicator

Choosing the right indicator can make or break swing trading performance. Below are three key features of a professional swing trading indicator.

Accurate signals on short time frames

Swing traders usually trade on short time frames like one-hour, four-hour, or daily charts. So your indicator should generate clear buy and sell signals that still work in these tighter windows.

Indicators like RSI and MACD can perform well when tuned for short time frames and used consistently.

Ability to combine with other technical tools

No indicator is perfect when used alone. A good swing trading indicator should combine smoothly with support and resistance, price action, or candlestick patterns.

This combination increases signal reliability and helps traders make decisions with more confidence.

Usable across multiple markets

An ideal indicator should be flexible across forex, crypto, and equity markets. Tools like the Exponential Moving Average (EMA), volume-based indicators, and Bollinger Bands often translate well across markets. They adapt more easily to varying volatility profiles and swing-trading conditions.

sms-star

Note:
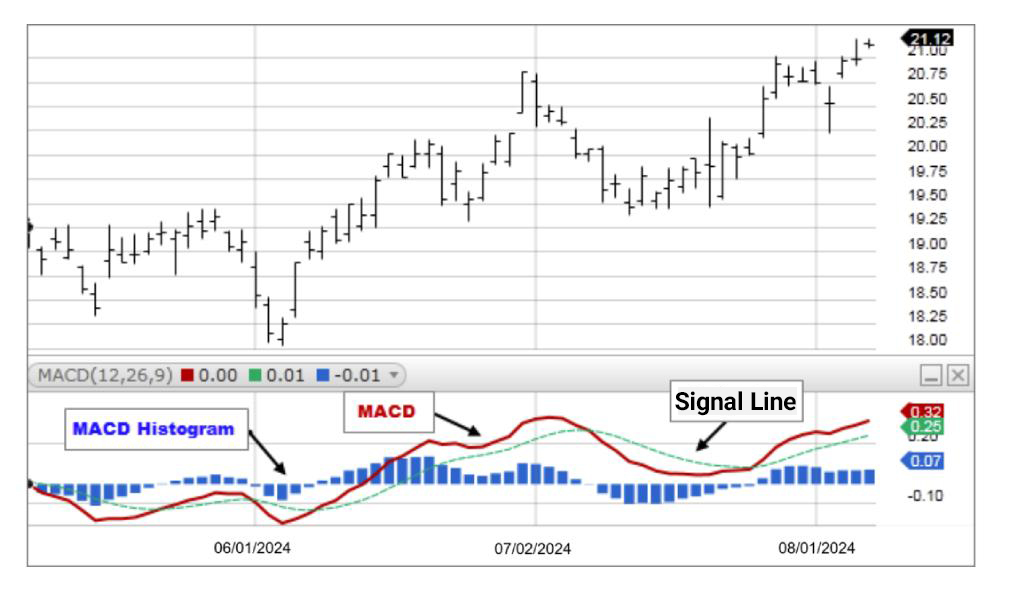
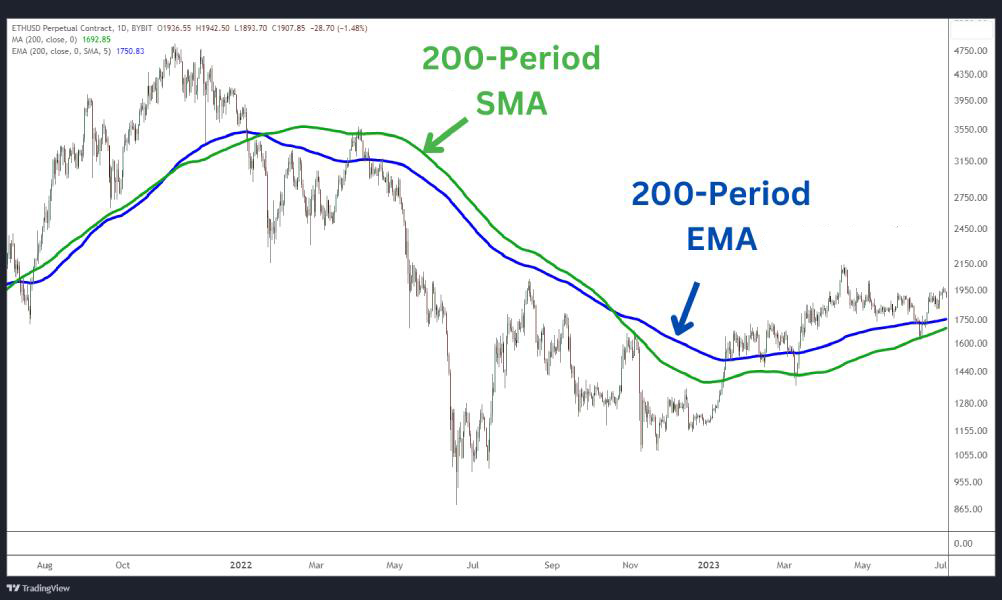
One effective swing trading technique is combining MACD divergence with a considerable distance from the 50-period moving average on the one-hour chart. This setup often signals strong mean-reversion moves, but it still requires confirmation and risk management.

Best Daily Swing Trading Indicators

Below, you will get familiar with four of the best indicators for daily swing trading.

RSI with Daily Time Frame Settings

The RSI (Relative Strength Index) is one of the most precise tools for spotting overbought and oversold conditions.

On daily charts, when RSI drops below 30 or rises above 70, it can provide useful swing trading signals.

For higher accuracy, many traders use custom settings like a 10- or 14-period RSI to better match short-term swings.

best indicators for swing trading

MACD for Identifying Divergence in Daily Trades

The MACD is one of the best tools for detecting divergence and potential trend shifts on the daily time frame.

When the MACD line separates from the signal line, or diverges from the price, a short-term reversal may be forming. MACD becomes even more accurate when combined with Stochastic or moving averages in swing trading setups.

best indicators for swing trading

Bollinger Bands for Analysing Price Volatility Range

Bollinger Bands plot upper and lower bands based on standard deviation, making the volatility range easier to see. If price approaches the upper band, a pullback toward the middle band becomes more likely, and vice versa. In daily swing trading, band touches can signal short-term entries or exits, especially in ranging markets.

best indicators for swing trading

Combining EMA and Volume for Daily Entries and Exits

Combining the Exponential Moving Average (EMA) with volume can create a practical daily entry-and-exit strategy.

For example, when a short EMA like EMA 9 crosses above a longer EMA like EMA 21, rising volume supports momentum. This combination is especially effective in highly volatile forex pairs where strong moves often follow confirmed breakouts.

Getting to Know the Best Indicators for Professional Swing Trading on Short Time Frames

Best Swing Trading Indicators for Hourly Time Frames (1H and 4H)

In hourly swing trading, traders usually base their decisions on 1-hour or 4-hour charts. In these time frames, the speed of analysis and the accuracy of signal detection become essential. That is why indicators that can read short-term market moves correctly are essential.

Below are four practical and popular indicators for swing trading on hourly time frames.

Stochastic Oscillator for Identifying Overbought and Oversold Conditions

The Stochastic Oscillator is useful for detecting overbought and oversold conditions in fast-moving markets. It compares the closing price to the recent high-low range over a defined period to gauge momentum.

On hourly charts, a reading above 80 suggests overbought conditions and a possible price pullback. In contrast, a reading below 20 signals oversold conditions and a potential rebound. These signals are valuable for traders who want quick swing entries and exits.

best indicators for swing trading

ATR for Defining the Price Movement Range on Hourly Charts

The Average True Range (ATR) measures volatility, or how far the price typically moves within a given period. ATR helps traders estimate how much the price could realistically move on an hourly time frame.

For example, a high ATR on the 1-hour chart indicates elevated volatility and sharper moves. You can use ATR to set stop-loss and take-profit levels based on real volatility, not pure guesswork.

best indicators for swing trading

Ichimoku for Swing Trading on the 1-Hour Time Frame

Ichimoku Kinko Hyo is a multi-purpose tool that includes support and resistance, trend direction, and equilibrium levels. On the 1-hour chart, the Ichimoku can provide useful information about the current trend and its strength.

best indicators for swing trading

If the price is above the Ichimoku Cloud and Tenkan-sen crosses above Kijun-sen, it often signals a buy setup. A bearish cross plus price moving below the cloud can indicate a sell setup. In markets like forex and crypto, Ichimoku can sometimes function as a complete hourly swing trading system.

sms-star

Note:
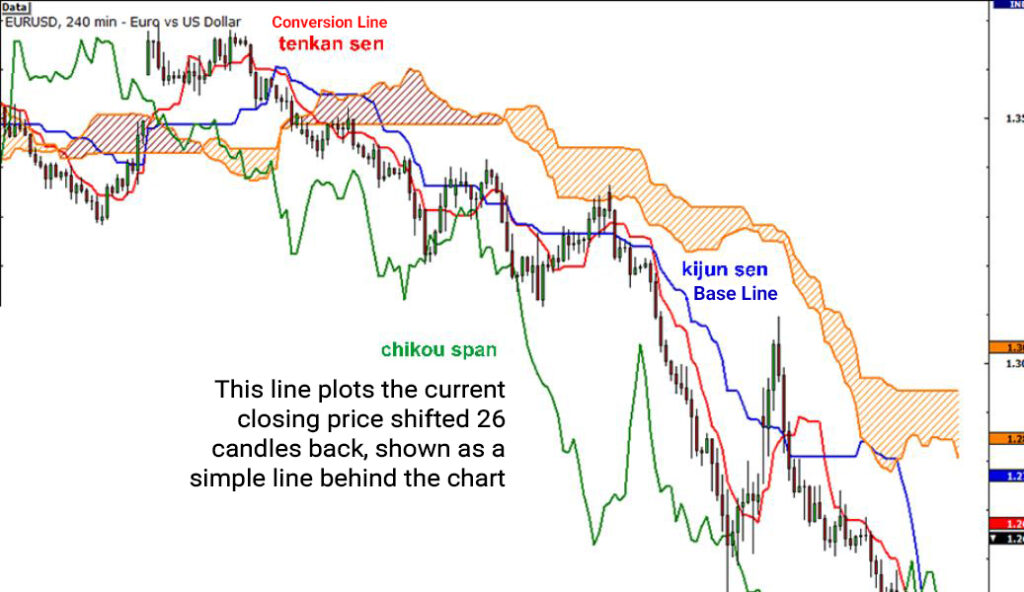
Tenkan-sen (the conversion line) averages the highest and lowest prices of the last 9 candles and reacts faster to changes. Kijun-sen (the base line) averages the highest and lowest prices of the last 26 candles, moves more slowly, and often acts as support.

Combining Moving Averages and CCI for an Hourly Strategy

Combining a Moving Average (MA) with the Commodity Channel Index (CCI) is another strong hourly swing trading strategy. The MA defines the broader trend direction, while CCI highlights overextension and possible reversals.

best indicators for swing trading

For example, if the price stays above the MA and CCI prints above +100, the uptrend is likely to continue. A reading below -100, alongside a breakdown through the MA, can be treated as a sell signal.

This combination balances trend confirmation with short-term momentum shifts in the market.

Common Mistakes When Using Swing Trading Indicators

Below are a few common mistakes many traders make.

Overusing Indicators

A common mistake is loading multiple indicators on the same chart, such as RSI, MACD, Bollinger Bands, moving averages, and CCI. This not only clutters the chart and creates decision confusion, but it can also generate conflicting signals.

In swing trading, it is better to use two to three complementary indicators that produce clear and aligned signals.

Ignoring Fundamental Factors

Many traders rely only on technical analysis and ignore fundamental factors and market drivers. However, economic news releases, interest rate changes, or company reports can trigger sharp short-term price volatility.

Even if indicators suggest a buy, a negative headline can instantly flip the setup. So, alongside technical tools, always review the economic calendar and the broader market context.

sms-star

Note:
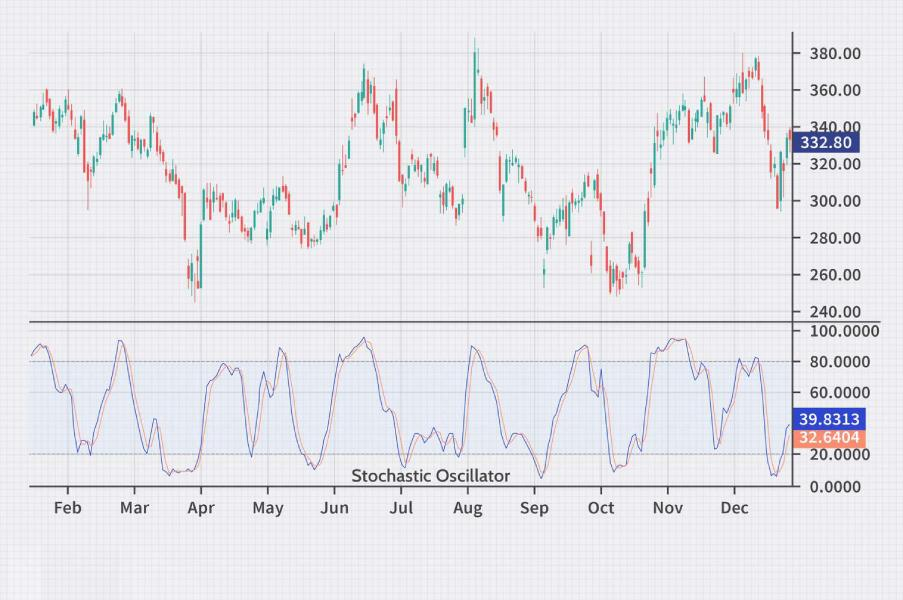
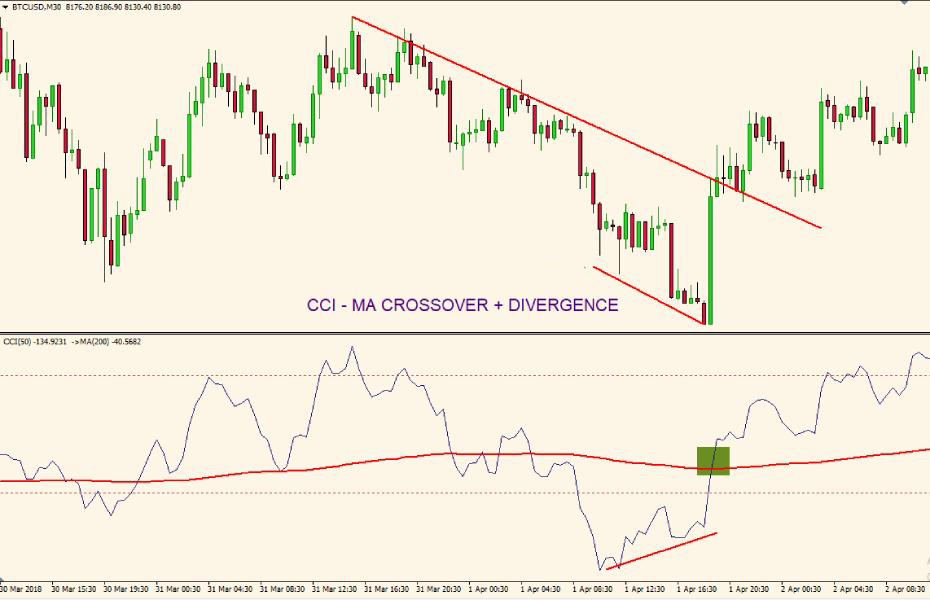
A lesser-known swing trading technique is to track divergence between price and indicators such as MACD or OBV on lower time frames. These divergences often highlight low-risk, high-quality reversal zones before the crowd notices the shift.

Skipping Strategy Backtesting

Many traders find a new strategy, such as combining RSI with EMA, and then enter trades without testing it on past data. This is very risky because the strategy may fail in current conditions, or it may have only worked well historically.

To confirm any trading system, you should first run a backtest on historical charts. This helps you identify the strategy’s strengths, weaknesses, and the conditions where it performs best.

Conclusion

Swing trading without precise and reliable tools often becomes guesswork rather than professional analysis. Indicators can improve entry and exit timing in short time frames by adding structure and measurable signals. When combined intelligently, they increase analytical accuracy and can raise your probability of success.

If you want to profit from short-term market moves, use the best swing trading indicators with careful execution and discipline.

Continue Reading
not-found
calendar 23 December 2025
Rate this article
Plugin not installed

Leave a Reply

Your email address will not be published. Required fields are marked *

No thanks