


In a market environment that feels stable, one spark can still completely reshape conditions. In that setting, an indicator that detects the start of a large wave earlier becomes a real competitive edge. Boom Hunter Pro was built for exactly this purpose: to track hidden momentum and prepare you for timely entries.
In this guide, we cover what it is, how it works, how to install it, how to read signals, and key usage tips.

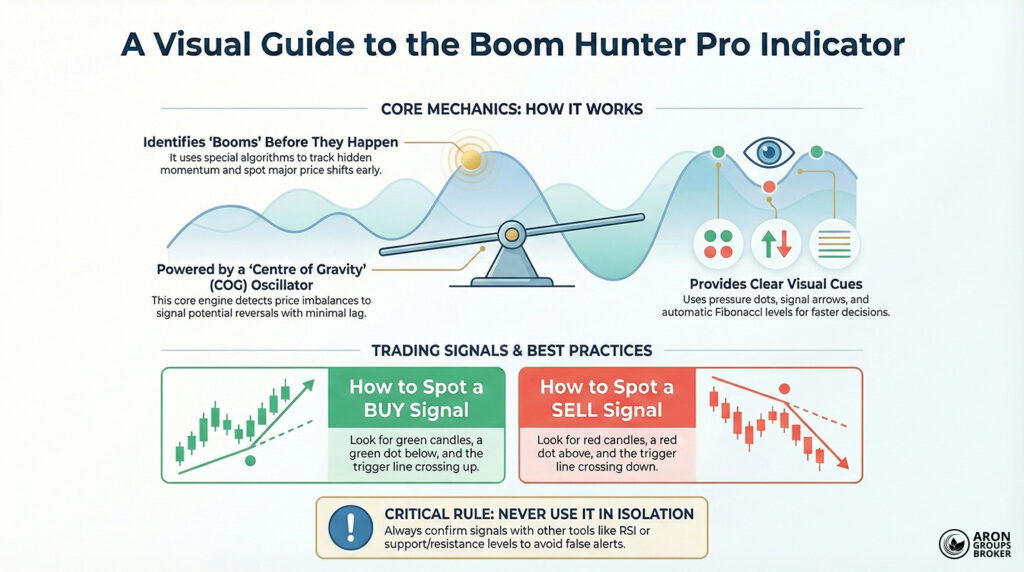
- Boom Hunter Pro is an advanced indicator that uses special algorithms and smart filters to spot meaningful price shifts early.
- It combines a Centre of Gravity (COG) oscillator with top-filter logic to remove noise and highlight real market moves.
Content Guidelines
- Coloured dots, Fibonacci lines, and audio/visual alerts help traders react faster when evaluating buy or sell decisions.
- To reduce false signals, use it alongside RSI or support and resistance levels, instead of relying on it alone.
What is Boom Hunter Pro?
Boom Hunter Pro is a specialised technical analysis tool designed to identify powerful and sudden price moves (“booms”). It is commonly used in markets such as forex, stocks, and crypto, and it is optimised for one-hour timeframes.
What sets it apart is its combined structure, rather than relying on a single calculation method like many indicators do. Its goal is to reduce false signals and focus on moves that reflect genuine market strength.
In practice, it helps traders find areas where a new trend may begin, or where the current trend can continue strongly. So, Boom Hunter Pro is mainly used to spot key decision zones where timing and confirmation matter most.
How does Boom Hunter Pro work?
Its mechanism combines several mathematical and technical algorithms that run in parallel and verify one another. Below is the role and operating logic of the key components.
Centre of Gravity (COG) oscillator
At the core of Boom Hunter Pro sits an advanced “Centre of Gravity” algorithm that continuously evaluates price balance.
By using a weighted average of prices and comparing current positioning to equilibrium, it detects reversal points with minimal lag.

As a leading indicator, COG can help you act before sharp jumps or drops begin, but filters are essential for accuracy.
Early Onset Trend (EOT) algorithm
Another key element is the Early Onset Trend (EOT) algorithm, developed by John Ehlers. It can detect a trend’s onset before it fully stabilises, providing earlier yet more usable signals. Signals are shown visually, and the tool can also trigger written and audio alerts for faster decision-making.
Components of Boom Hunter Pro
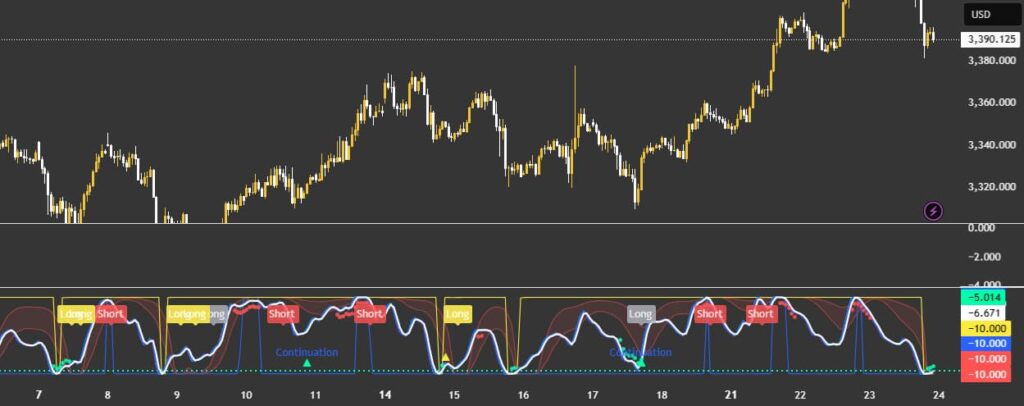
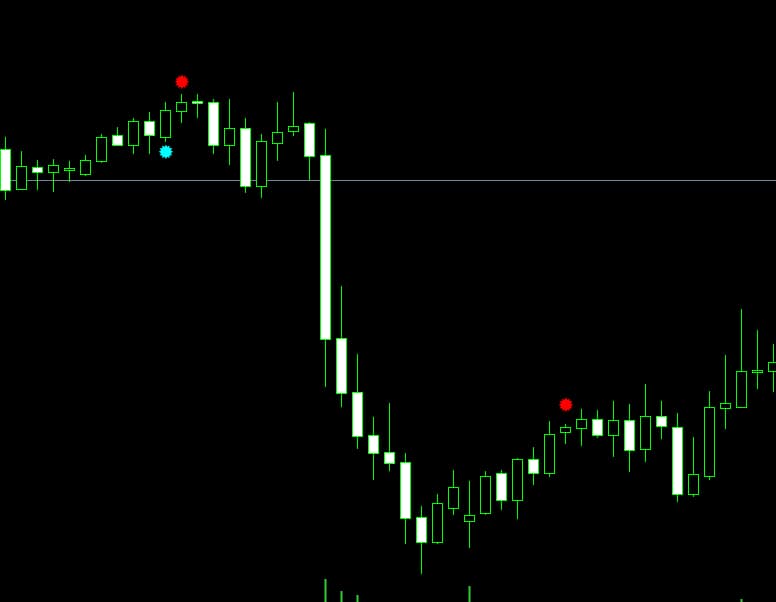
The main parts of Boom Hunter Pro are shown in the image below.
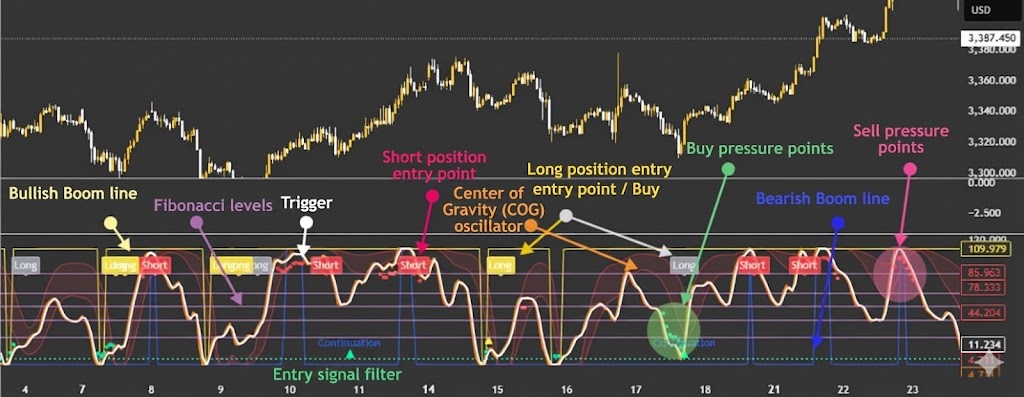
Some of the components work as follows:
- Buy/Sell pressure dots: These show real-time buy pressure (green) or sell pressure (red) to support entry and exit timing.
- COG oscillator line: This shows where the price sits relative to the market’s centre of gravity, and an extreme distance can signal reversal risk.
- Buy/Sell signal arrows: These appear only when multiple algorithmic conditions align, which is meant to reduce low-quality signals.
- Automatic Fibonacci levels: These estimate potential support and resistance for more structured take-profit and stop-loss placement.
Installing and Setting Up the Boom Hunter Pro Indicator
Installing and setting up Boom Hunter Pro on MetaTrader is straightforward, and the steps are usually quick to complete. Below, we explain how to download and install it correctly, and apply practical settings to improve performance.
How to download the indicator
Because there is no official source, download the indicator only from reputable websites or trading communities like TradingView or MQL5.
Check the file format to ensure it is .ex4 or .mq4 for MetaTrader 4, or .ex5 or .mq5 for MetaTrader 5. Scan the downloaded file with an antivirus tool to confirm it is clean and does not include malware.
Warning:
Avoid cracked or unofficial versions, because they can compromise your trading account security and platform stability.
Installation and optimal setup in MetaTrader
To use Boom Hunter Pro in MetaTrader 4 or 5, copy the indicator file into the correct folder, then restart the platform.
Below, each step is explained in detail so you can complete the setup without missing any critical action.
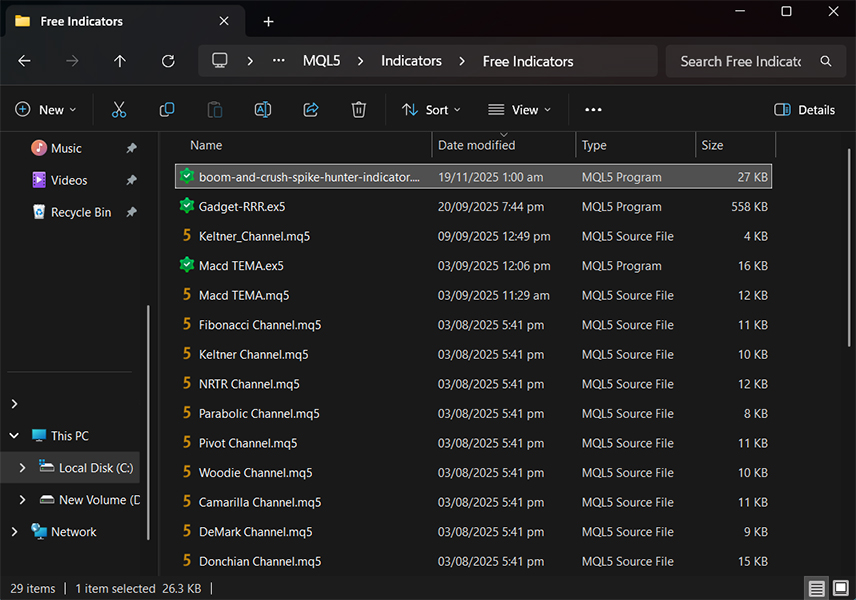
Step 1: Get the indicator file
After purchasing or receiving the tool, you will usually get one of the following file formats.
BoomHunterPro.ex4 or BoomHunterPro.mq4 is used for MetaTrader 4, while BoomHunterPro.ex5 or BoomHunterPro.mq5 is for MetaTrader 5.
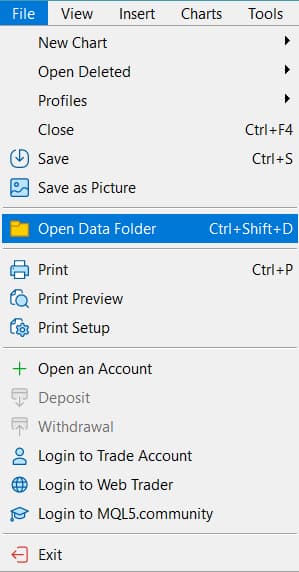
Step 2: Open the Data Folder in MetaTrader
Launch MetaTrader, then click File from the top menu to access the platform’s main directory options. Select Open Data Folder to open the exact installation path where MetaTrader stores indicators and scripts.
Step 3: Go to the Indicators folder
In the opened window, open MQL4 for MT4 or MQL5 for MT5 to reach the correct structure. Inside that folder, open Indicators, which is the dedicated directory for custom indicator files.
Step 4: Copy the indicator file
Copy the indicator file you received, such as BoomHunterPro.ex4, directly into the Indicators folder you just opened.
Make sure you paste it in the Indicators folder itself, not inside a random subfolder, to avoid loading issues.
Step 5: Restart MetaTrader
After copying the file, close MetaTrader completely, then open it again so the platform can detect the new indicator.
This restart step matters because MetaTrader refreshes custom indicators only at startup or when the folder is manually reloaded.
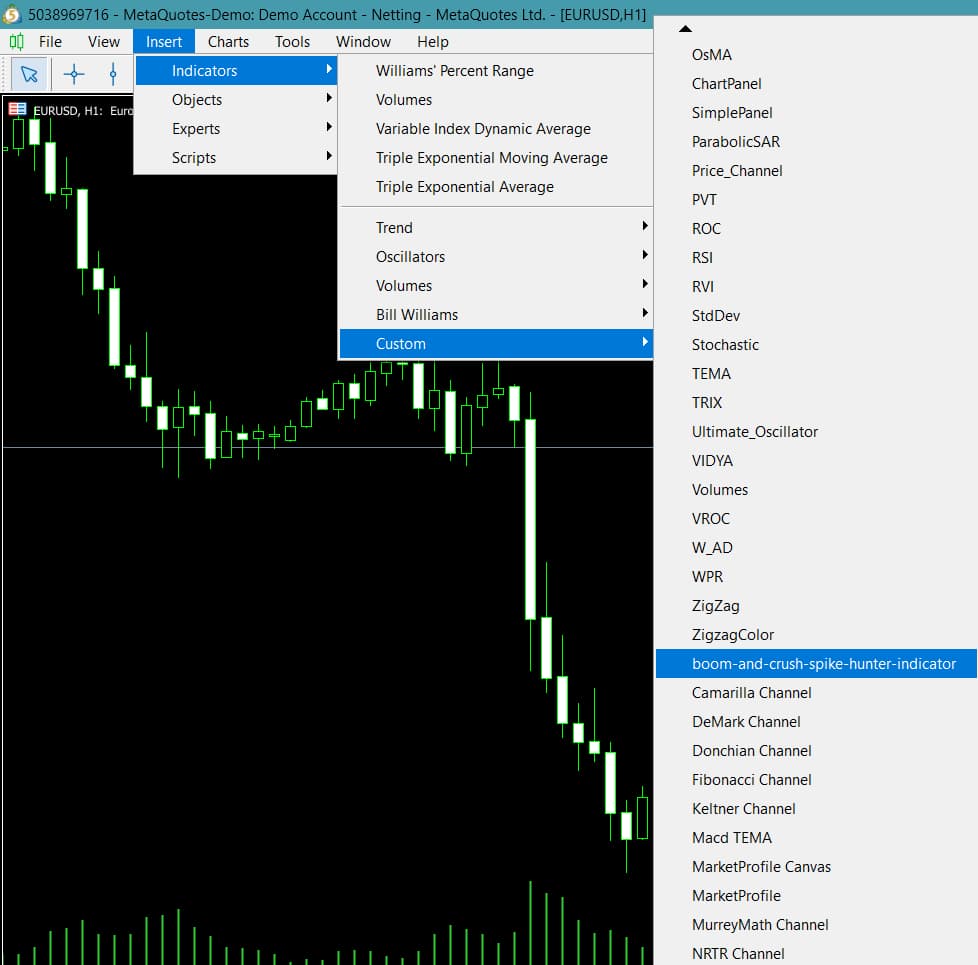
Step 6: Add the indicator to a chart
In the Navigator panel on the left, or from Insert > Indicators, find Boom Hunter Pro in the list. Drag and drop it onto the chart you want to analyse, then release it to apply the indicator.
If the settings window appears, you can enable alerts, adjust line colours, or toggle Boom lines based on your preferences.
How to interpret signals in the Boom Hunter Pro indicator
Understanding Boom Hunter Pro signals is essential if you want to use it effectively in real trading decisions. In this section, we explain how to read entry signals, exit cues, and the situations in which false alerts can appear.
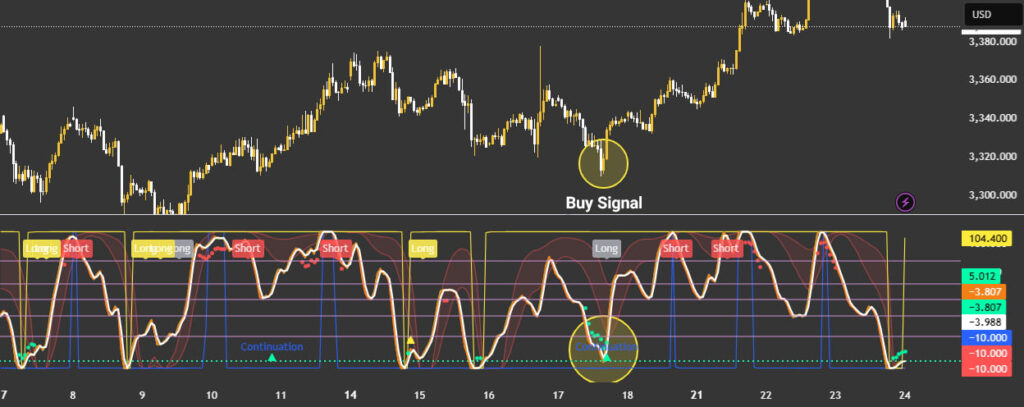
Buy entry signs or a buy signal.
When market conditions support a long entry, a set of visual clues usually appears on the chart together. These are the main buy-related signs you should watch for:
- Candle colours shift to light or dark green, suggesting buying pressure is building, and sentiment is changing.
- A small green pressure dot appears below the candle at the same time, confirming active buy-side pressure.
- A key confirmation is a bullish crossover, where the Trigger line crosses upward from below the oscillator line.
- The oscillator line represents the price centre of gravity, so the crossover acts like a practical entry “trigger.”
- If this setup forms near a Fibonacci support level, the buy signal generally becomes more credible.
When these signs align, the combined pattern is typically treated as a strong long signal.
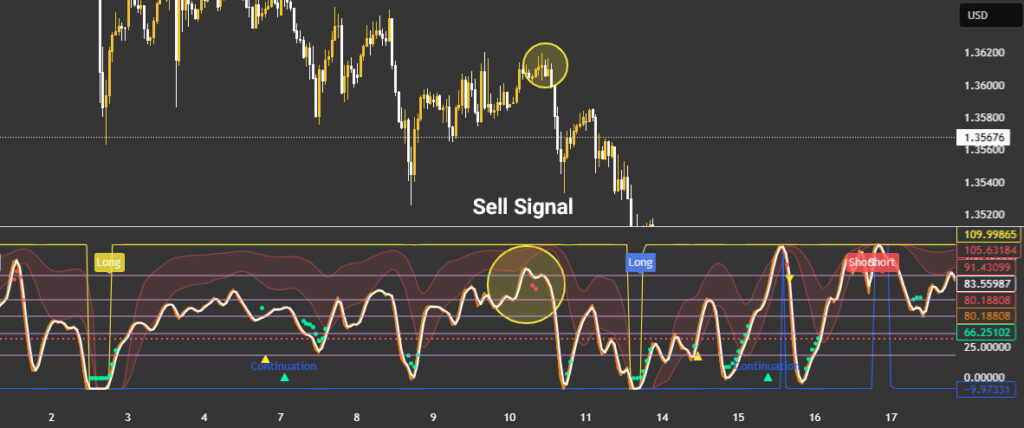
Sell entry signs or a sell signal
A sell signal is identified using similar elements, but in the opposite direction and with bearish confirmation logic. These are the main sales-related signs you should watch for:
- When candle colours turn red, it usually indicates that sell pressure is beginning to dominate the current move.
- At the same time, a red pressure dot appears above the candle, confirming intensified selling pressure.
- If the Trigger line crosses downward from above the oscillator line, downside momentum or a correction becomes more likely. This crossover often serves as a cue to exit a long trade or consider entering a short position. If the signal forms near a Fibonacci resistance level, the chance of price reacting and reversing increases further.
False alerts and recommended filters
Despite its high accuracy, Boom Hunter Pro can still produce false signals, especially during very volatile conditions. To avoid unnecessary losses, you should consistently apply a few simple filters and discipline rules:
- One common mistake is trading based on a single sign, like one dot, without other confirming conditions. Treat signals as valid only when at least two or three signs appear together, not when they appear in isolation.
- In low-volatility, sideways markets, false signals become more frequent, so trend confirmation from higher timeframes helps.
- Using tools like RSI and support and resistance levels can filter signals and improve decision quality. For example, if RSI shows overbought conditions, avoid taking a long signal even if Boom Hunter Pro suggests entry. If RSI is below 30 and Boom Hunter Pro shows a buy signal, the probability of an upward reversal is often higher.
- Also, watch the distance from the centre of gravity line, as extreme distance often increases the potential for mean reversion. Signals that appear when the price is far from the centre of gravity typically have a higher chance of a reversal move.
If the signal candle forms right as the price hits a Fibonacci level and gets rejected, the rebound strength is often doubled.
Pros and Cons of the Boom Hunter Pro Indicator
Like other technical analysis tools, this indicator has both strengths and limitations to consider before relying on it.
Pros of Boom Hunter Pro
Key advantages of Boom Hunter Pro include the following practical benefits for active traders and analysts:
- High accuracy in trend detection: The EOT algorithm and advanced filters help produce more dependable, actionable signals.
- Suitable for scalping strategies: Fast signal generation makes it useful for short-term trading and quick execution setups.
- Customisable settings: You can enable or disable features such as Fibonacci lines and alerts based on your workflow.
- Multiple alert types: It supports crossover, overbought/oversold, and reversal signals, which adds flexibility across setups.
Note:
When the centre of gravity line turns flat and horizontal instead of curved, entries become very risky, especially for scalping.
Cons of Boom Hunter Pro
Key disadvantages of Boom Hunter Pro include the following risks and practical constraints you should plan around:
- No official source: Lack of official support can create security concerns and compatibility issues across platforms or builds.
- Complex for beginners: Many settings and visual elements can confuse newer traders and increase decision noise.
- Timeframe dependency: It works on many timeframes, but it performs best on one-hour charts and may vary elsewhere.
- False signals in volatile markets: Without complementary filters, incorrect signals can increase during rapid, noisy price swings.
Conclusion
Boom Hunter Pro is a powerful tool for traders who want to catch major price moves in financial markets. By combining a centre-of-gravity oscillator, advanced filters, Fibonacci lines, and alert features, it improves entry and exit timing.
For best results, optimise the settings based on your strategy and confirm signals with complementary tools and market structure. If you trade scalps or hunt larger trends, Boom Hunter Pro can fit well, provided you respect its limitations.
Source: tradingview.com


