


Traders are always looking for tools that clarify the tug-of-war between buyers and sellers in the market. One practical tool is the BOP indicator, or Balance of Power, which measures who is driving price action. It helps you see, over a specific period, whether buyers or sellers had stronger control of the market.
In this article, we explain simply how to use BOP for market analysis and signal confirmation.

- The BOP indicator measures the balance of power and identifies who is controlling the market, buyers or sellers.
- BOP oscillates around the zero line, where positive values signal buyer strength and negative values signal seller strength.
- One of BOP’s strongest signals is divergence between price movement and the indicator, which can warn of reversals.
- To reduce false signals and improve accuracy, never use BOP alone and combine it with other tools.
What Is the BOP Indicator, and How Is It Used in Technical Analysis?
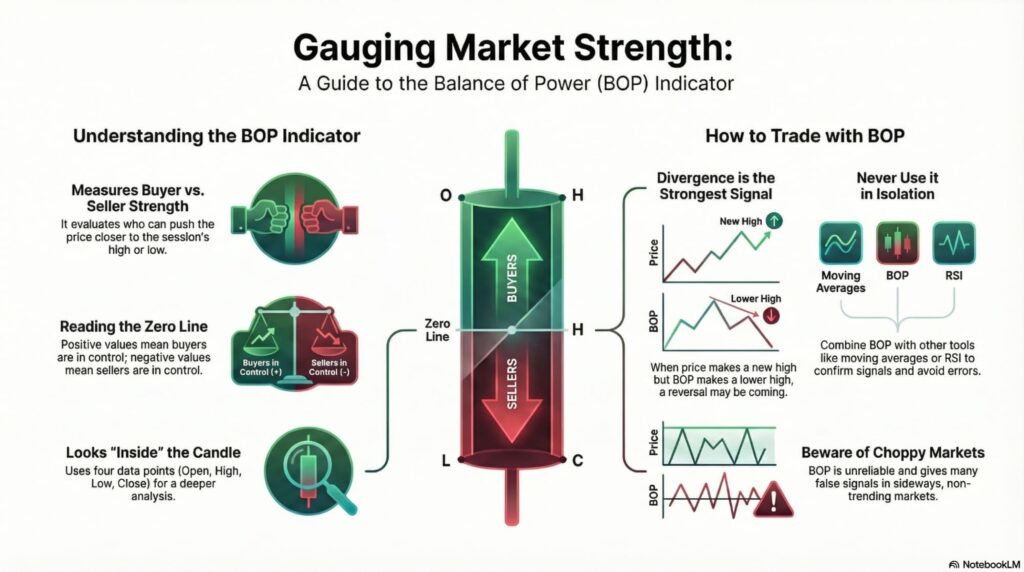
The BOP indicator is a technical analysis tool that compares the strength of buyers and sellers over a trading period. It does this by evaluating which side can push the price closer to the session high or pull it nearer the session low.
Put simply, it shows whether buyers were strong enough to drive the price toward the high, or sellers forced it down.
The indicator moves around a zero line, which acts as a balance point between buyers and sellers. Positive readings suggest stronger buying pressure, while negative readings suggest stronger selling pressure during that period. When BOP is near zero, it usually means neither side has a clear advantage, and market control is relatively balanced.
How the BOP Indicator Is Calculated
The BOP calculation formula may look complex at first glance, but its underlying idea is easy to understand.
Formula Components
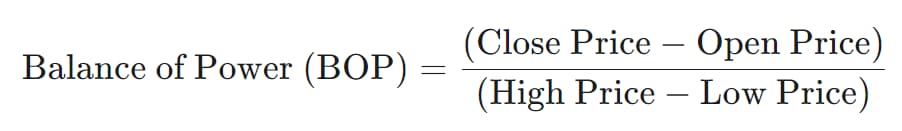
- Close Price: The price at which the candle (or time period) closes.
- Open Price: The price at which the candle begins.
- High Price: The highest price recorded during that time period.
- Low Price: The lowest price recorded during that time period.
Example
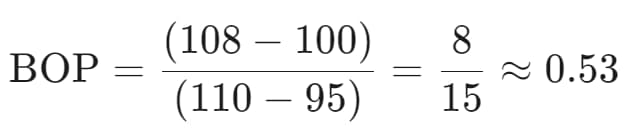
Assume that, in a one-hour candle for an asset, the following prices were recorded.
- Open: $100
- High: $110
- Low: $95
- Close: $108
Now we plug these numbers into the formula.
Result
- The value obtained (0.53) is positive, meaning buyers were stronger than sellers in that candle.
- A reading near 0.5 indicates buyers pushed the price above the open and closed near the range top. In other words, the close landed in the upper half of the candle’s range, close to the high. This is a clear sign of buyer dominance during that specific time window.

Note:
If BOP does not spike during a Break of Structure (BOS), or flips against price direction, fakeouts or liquidity grabs become very likely.
How to Use the BOP Indicator on a Chart
Using this indicator is very simple, and you can easily add it to your trading platform.
How Do You Enable the BOP Indicator in MetaTrader or TradingView?
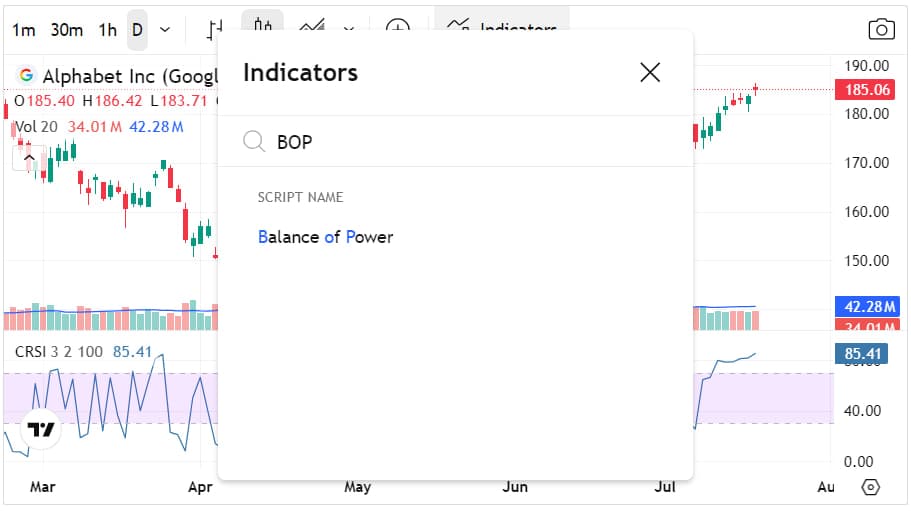
Enabling the BOP Indicator in TradingView
- Go to the Indicators section.
- In the search bar, type “Balance of Power.”
- Click it to add the indicator to your chart.
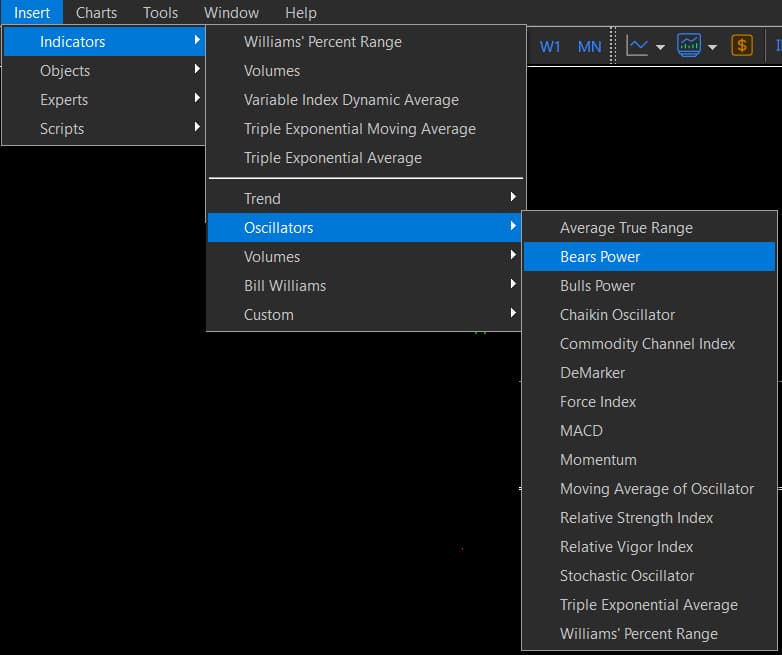
Enabling the BOP Indicator in MetaTrader
- From MetaTrader’s top menu, go to Insert > Indicators > Oscillators.
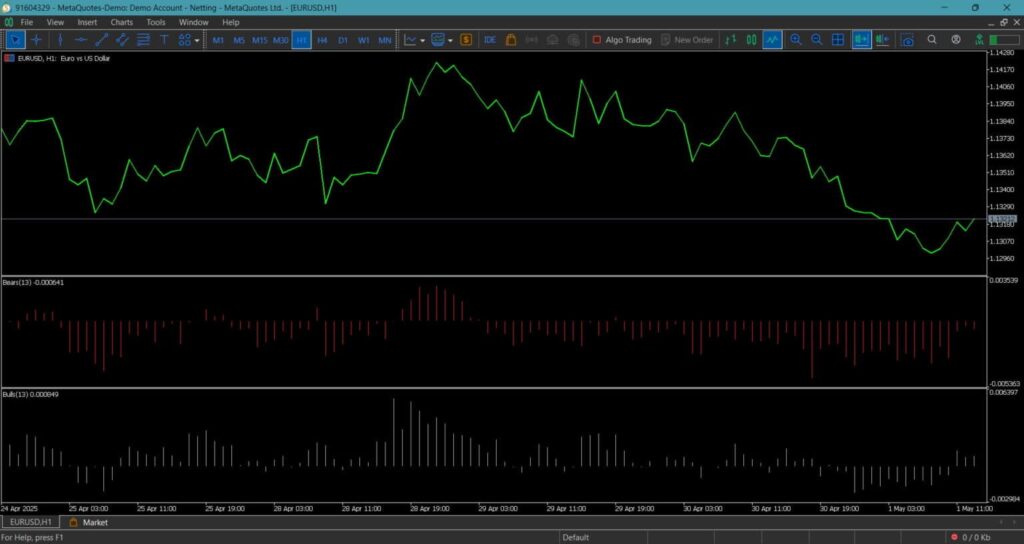
- Select “Bears Power” or “Bulls Power.”
- Note that these two are building blocks of BOP, and some MetaTrader versions lack a built-in combined BOP.
- However, custom BOP versions are easy to find online and install on MetaTrader.
Key BOP Indicator Settings
The most important BOP setting is the moving average period used to smooth the indicator line. Its default value is usually 14.
- Shorter periods (e.g., 9): Make the indicator more sensitive and generate more signals, but errors increase.
- Longer periods (e.g., 21): Smooth the line and reduce false signals, but signals may arrive with a delay.
In most cases, the default settings work best unless your trading strategy requires a specific adjustment.
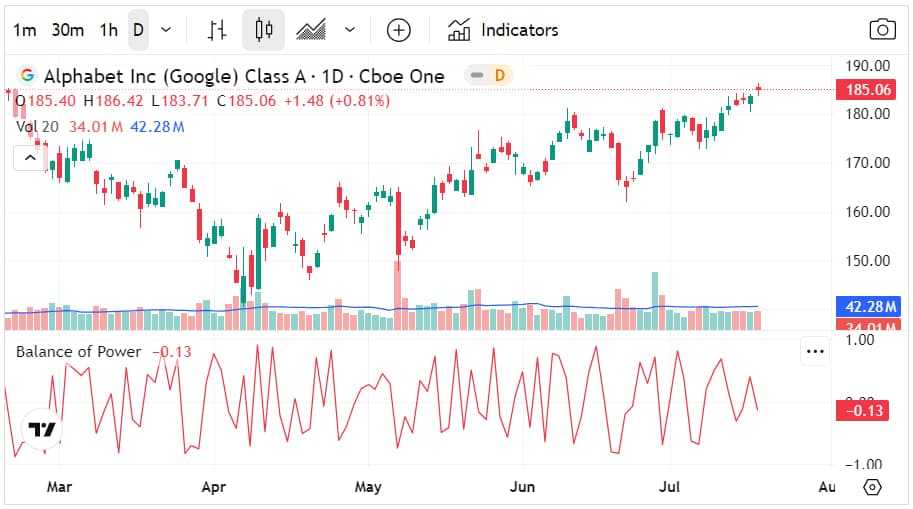
How to Interpret the BOP Indicator
Interpreting this indicator is very intuitive for most traders.
- BOP line above zero: Buyers dominate the market, and the farther from zero, the stronger the buying pressure.
- BOP line below zero: Sellers dominate the market, and the more negative it gets, the heavier selling pressure becomes.
- Zero-line crossover: Moving from below to above zero can be a buy signal, while crossing down can signal selling.
Best Methods for Signal Generation and Market Strength Analysis with the BOP Indicator
Relying only on BOP crossing the zero line, especially in range-bound markets, can produce many misleading signals. For more reliable signals, you should use smarter analytical methods, which we explain in detail below.
Identifying Buyer or Seller Strength Using BOP
This is the simplest, yet one of the most important, uses of the BOP indicator.
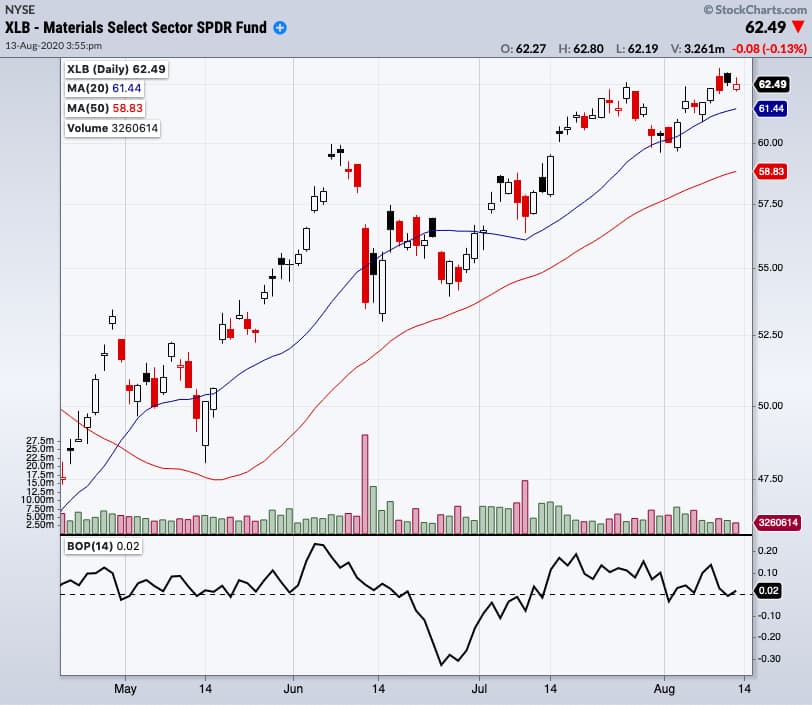
- Confirming an uptrend: Suppose the price is in an uptrend, for example, trading above a 50-period moving average. If BOP stays consistently above zero and prints higher peaks alongside price, it strongly confirms trend health. This signal tells you: “Buyers are still strong, and there is no clear reason to exit the long position.”
- Confirming a downtrend: In a downtrend, if BOP remains below zero and keeps making new lows, sellers dominate. This behavior signals strong selling control and supports the continuation of the bearish trend.
- Warning signal (trend weakening): The key warning appears when price and BOP stop moving in sync. For example, price makes a new high, but the BOP peak forms lower than its previous peak. This is not classic divergence, but a sign that the trend’s internal strength is fading. It tells you: “Price rose, but buyers are weaker now, so prepare to exit or tighten your stop-loss.”
Note:
In chart-driven structures like a vacuum block, BOP can reveal power “explosion points” several candles before price moves.
Spotting Divergences Using BOP
A divergence occurs when price movement and the BOP indicator move in opposite directions. This is one of the strongest signals for anticipating potential market reversals.
Regular Bearish Divergence
Price prints Higher Highs, while BOP prints Lower Highs.
Interpretation:
This means that despite rising prices, real buyer strength is weakening, and selling pressure may soon take over.
Strategy:
This is a sell signal, but do not rush into entry without confirmation. Wait for confirmation, like a break of a minor uptrend line or a bearish reversal candlestick pattern. A common confirmation example is a bearish engulfing candle forming near resistance.
Regular Bullish Divergence
Price makes Lower Lows, while BOP forms Higher Lows.
Interpretation:
Despite falling prices, seller strength is running out, and buyers are gradually stepping into the market.
Strategy:
This is a buy signal, but confirmation should come before entry for better risk control. Look for confirmation, such as a break of a downtrend line or a strong bullish candlestick pattern. After confirmation, you can enter a long trade with a clearer structure for placing the stop-loss.
Combining BOP with Other Technical Analysis Tools
BOP should not be your only decision-making tool, because it can be noisy in sideways conditions. Its real strength appears when you use it as a confirmation filter alongside other indicators.
1) Combining BOP with a Moving Average
- Wait until the price moves above a moving average, such as the 50-period EMA (EMA 50).
- Then wait for a pullback toward the moving average to test it as support.
- When price touches the average, and BOP crosses from negative to above zero, it’s a high-quality buy signal.
2) Combining BOP with MACD
Assume MACD prints a Golden Cross and generates a buy signal for the asset.
Before entering, check BOP to see whether buyer strength actually supports that MACD signal.
- If BOP remains deeply negative, buyer strength is still weak, so wait or enter with lower risk.
- If BOP is positive, or crossing above zero, the MACD buy signal gains much stronger confirmation.
3) Combining BOP with RSI
The best use of this combination is finding simultaneous divergence on both indicators. If price makes higher highs while both RSI and BOP make lower highs, the sell signal is extremely strong. That’s because both momentum (RSI) and internal power (BOP) are weakening at the same time.
4) Combining BOP with Momentum
The Momentum indicator measures the speed of price change, while BOP reflects the strength behind that move. Price can move fast with high momentum, but a weak BOP may show the move lacks power to continue. This combination is excellent for spotting “deceptive moves” that may stall or reverse quickly.
Advantages and Limitations of the BOP Indicator
Like any analytical tool, the BOP indicator has specific strengths and weaknesses, which we review below.
Advantages of the BOP Indicator
The main advantages of the BOP indicator include the following points.
- Simple interpretation and clear visuals
The biggest advantage of BOP is its simplicity and its clean, easy-to-read structure. You do not need complex formulas or multiple lines to interpret what the indicator is saying.
There is a central zero line and an oscillator moving above and below that baseline.
Above zero means buyers have the upper hand, while below zero means sellers control the pressure. This visual clarity helps traders, especially beginners, grasp market sentiment at a glance.
- Reveals the candle’s internal strength
Many popular indicators, like moving averages, rely on one data point, usually the closing price. BOP uses all four key prices: Open, High, Low, and Close, so it “looks inside” each candle.
A candle may close bullish, but a low BOP can show the rise lacked force and faced strong selling. Understanding that hidden resistance provides a real strategic edge in reading price behavior. - Excellent for identifying divergences
BOP’s most powerful feature may be its ability to clearly and early display divergences. Because it directly measures buyer and seller strength, divergence can serve as a leading warning signal.
If the price keeps rising but the BOP shows weakening buyer power, it warns that the trend may lose momentum soon. In that case, the probability of a pullback or reversal increases, even if the price still looks strong.
In V-shaped moves or incomplete structure breaks, BOP dropping sharply below zero can signal smart money exiting deceptive moves fast.
Limitations of the BOP Indicator
The main disadvantages of the BOP indicator include the following points.
- False signals in choppy, sideways markets
When markets lack a clear trend and prices move within a tight range, BOP becomes less reliable. In these conditions, BOP crosses the zero line repeatedly and generates many wrong buy and sell signals.
A key rule is simple: in non-trending markets, do not trust BOP’s zero-line cross signals. - BOP is a lagging indicator
Because BOP often applies a moving average to smooth its line, it becomes inherently lagging. That means its signals usually appear with a delay relative to the real-time price movement.
So BOP works better for confirming a move than for timing precise entries and exits.
If you need very fast signals, BOP may feel slow and occasionally frustrating. - It must be combined with other tools
Due to lag and false-signal risk, using BOP alone creates an incomplete and risky trading approach. To filter weak signals, combine them with trendlines, support and resistance, and candlestick patterns.
BOP performs best as a confirmation layer inside a broader, structured technical analysis system.
Conclusion
The BOP indicator is a valuable tool for assessing market depth and the balance of buying versus selling pressure. By showing which side controls price, it helps traders separate healthy trends from trends losing strength.
Success with BOP depends on a smart combination with other tools and strong signals like divergence. Treat BOP not as a fortune teller, but as a judge announcing who won the candle’s battle.
Sources


