Price does not move randomly. It often slows down before changing direction, and momentum indicators help traders spot that shift early. One of the most reliable signals is bullish divergence RSI, which appears when the price continues falling but the RSI indicator starts rising.
This pattern can signal weakening selling pressure and a possible reversal. Even if you are new to trading, understanding what bullish divergence RSI is can improve your market awareness.
In this guide, you will learn how to recognise regular and hidden setups step by step, so keep reading to build confidence in spotting reversals correctly.

- Bullish RSI divergence signals weakening selling momentum before price reversals.
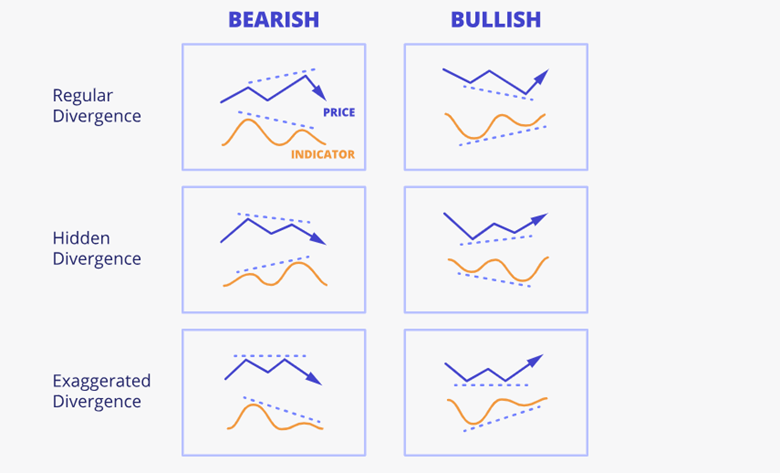
Regular bullish divergence appears in downtrends and signals a potential upside reversal (price lower low, RSI higher low).
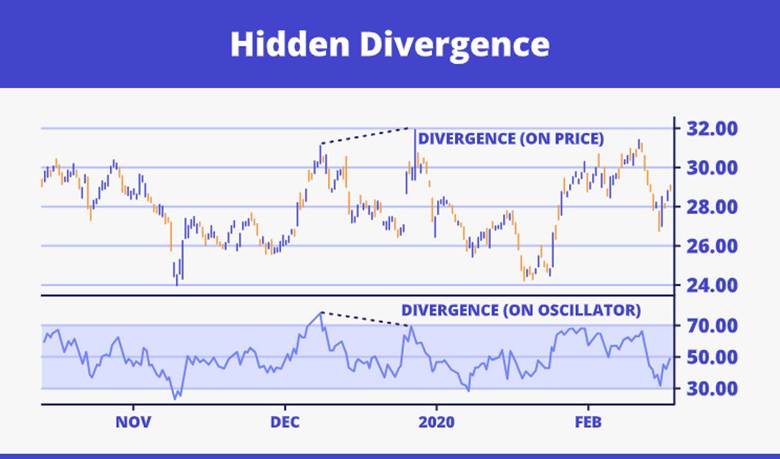
Hidden bullish divergence appears in uptrends during pullbacks and signals trend continuation (price higher low, RSI lower low).
- Divergences forming in oversold territory typically offer higher-probability reversal trades.
Understanding Bullish Divergence RSI
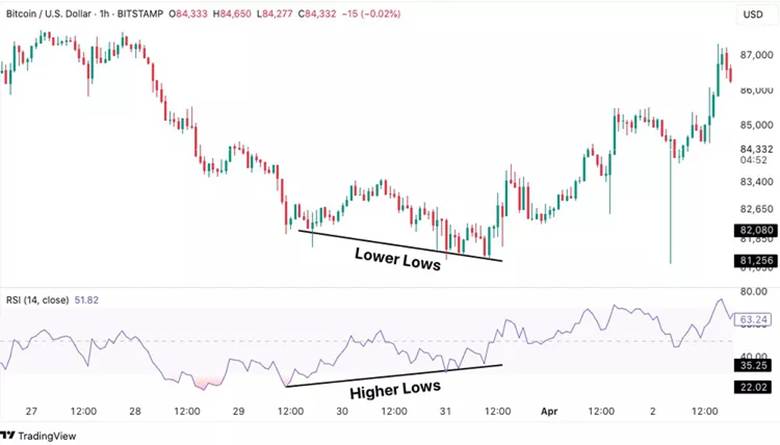
Bullish divergence RSI occurs when the price of an asset forms lower lows in price action, but the RSI indicator shows higher lows in RSI, creating a mismatch that highlights momentum exhaustion in a downtrend.
This concept is a key tool in technical analysis, helping traders spot potential upward reversals before they fully develop.
The RSI, developed by J. Welles Wilder, calculates momentum by comparing the magnitude of recent gains to losses over a default period of 14 days, with this formula:
RSI = 100 – (100 / (1 + RS))
where RS is the average gain divided by the average loss. It matters because it reveals when selling pressure weakens, allowing buyers to gain control and potentially shift the market direction.
According to Investopedia, this indicator ranges from 0 to 100 and excels at identifying such mismatches to predict trend changes.
| RSI Level | Interpretation | Example Asset |
|---|---|---|
| Below 30 (Oversold) | Potential buy signal as selling may be exhausted | Gold during a dip |
| 30-70 (Neutral) | Balanced momentum, no strong bias | EUR/USD in ranging conditions |
| Above 70 (Overbought) | Potential sell risk as buying may peak | Stocks like Tesla in rallies |
Q: How does RSI measure momentum?
A: RSI compares average gains to losses over 14 periods; a bullish divergence shows price making lower lows while RSI forms higher lows, suggesting fading downward pressure—always verify with volume for accuracy.

Key Point:
Bullish divergences often form after prolonged downtrends, indicating seller exhaustion and buyer entry points, but false signals can occur in ranging markets.
What is Bullish Divergence RSI and Why It Matters
Bullish divergence RSI refers to a scenario where the price hits new lows, reflecting continued bearish action, yet the RSI displays higher lows, pointing to momentum exhaustion among sellers.
This setup signals that the downtrend may lose steam, paving the way for a price rebound. It matters for traders as it uncovers hidden buying strength that price charts alone might miss, enabling anticipation of reversals in various markets.
- Provides early reversal signals to enter positions ahead of the crowd.
- Works across multiple timeframes, from intraday to weekly charts.
- Boosts entry confidence by combining with other confirmations like candlestick patterns.
For instance, in stocks with bullish RSI divergence, such as Apple during its 2020 recovery phase, the indicator highlighted a shift after a market dip, leading to upward movement.
According to BabyPips, this pattern serves as a reliable warning of trend shifts in assets like Forex pairs or equities.
Key Differences: Bullish vs Bearish Divergence RSI
Bullish divergence RSI features price forming lower lows with RSI showing higher lows, implying an upside reversal as bearish momentum fades.
In contrast, bearish divergence RSI involves price reaching higher highs while RSI posts lower highs, suggesting a downside shift as bullish strength weakens.
| Type | Price Action | RSI Action | What It Means | Trader Action |
|---|---|---|---|---|
| Regular Bullish | Lower Lows | Higher Lows | The trend is exhausted. | Look for buy reversals. |
| Hidden Bullish | Higher Lows | Lower Lows | Dip in an uptrend. | Buy the pullback. |
| Regular Bearish | Higher Highs | Lower Highs | Buyers are trapped. | Look for sell reversals. |
| Hidden Bearish | Lower Highs | Higher Highs | Rally in a downtrend. | Sell the bounce. |
Bearish patterns act as the mirror image of bullish ones, often appearing in uptrends. According to IG, this symmetry helps traders identify tops and bottoms effectively.
More Info: In trending markets, bullish divergences signal bottoms, while bearish indicate tops; both require confirmation to avoid whipsaws.
Recognising whether you are dealing with a bullish or bearish structure ensures correct bias and trade direction alignment.
Regular Bullish Divergence Setup and Trading
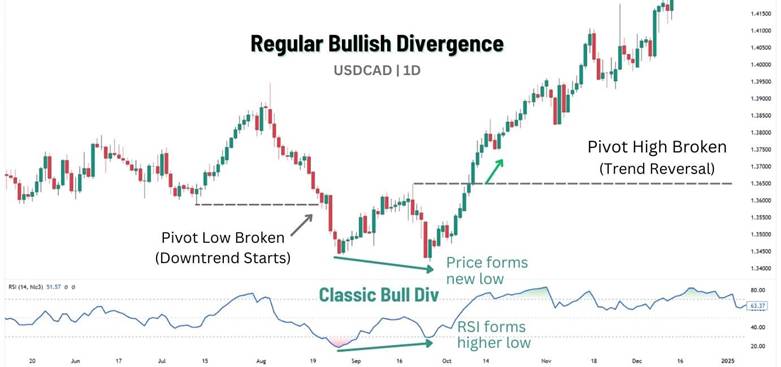
Regular bullish divergence RSI serves as a reversal signal in downtrends, where price establishes lower lows in price action while the RSI forms higher lows in RSI, pointing to fading bearish pressure.
Traders scan for established downtrends, spot the divergence pattern, and await confirmation before entering long positions to capture potential upswings.
This approach integrates with tools like stochastic RSI bullish divergence for added momentum checks, enhancing setups in volatile markets such as Forex or stocks.
Key Insight: Regular divergences are stronger in oversold markets, potentially yielding 2:1 risk-reward ratios when managed properly.
Q: Can regular divergence work in stocks?
A: Yes, in stocks with bullish RSI divergence like Tesla during dips, it signals recoveries; combine with earnings data for better odds, but remember market volatility can invalidate signals.
According to The Trading Analyst, this pattern indicates selling pressure losing steam, making it ideal for buy opportunities after confirmation.
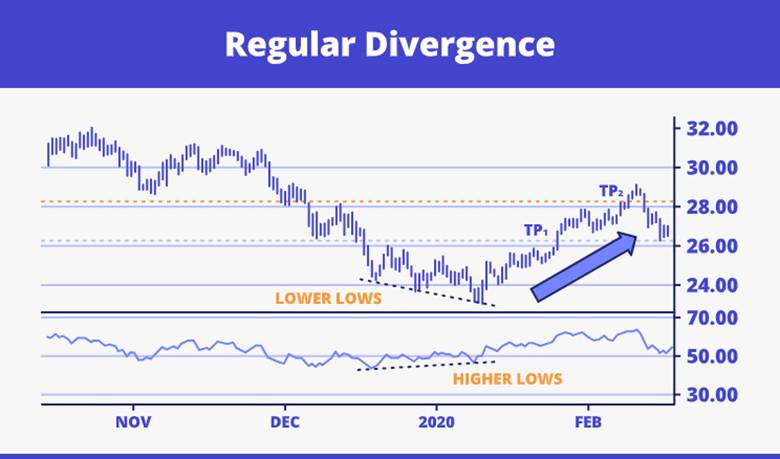
Regular Divergence Setup: Price Lower Low, RSI Higher Low
To visually identify regular bullish divergence RSI, focus on charts where price creates a lower low, but the RSI—typically set to a 14-period—registers a higher low. This mismatch reveals underlying buyer interest amid apparent weakness.
- Identify a clear downtrend with successive lower highs and lows.
- Mark the swing lows on the price chart, ensuring the second is below the first.
- Draw trendlines connecting the lows on both price and RSI to highlight the divergence.
Starting with the 14-period RSI boosts accuracy in spotting these patterns across timeframes.
RSI Bullish Divergence Cheat Sheet for Quick Reference
For fast assessments, use an RSI bullish divergence cheat sheet to streamline identification and action in live trading.
| Step | Action | Tip |
|---|---|---|
| 1 | Scan for RSI in oversold condition (below 30) during downtrends | Focus on assets showing prolonged weakness for a higher probability. |
| 2 | Check for price lower low versus RSI higher low | Ensure divergence lines slope oppositely to confirm momentum shift. |
| 3 | Enter on break of structure (BOS) or other confirmation | Avoid isolated signals; pair with volume for reduced false positives. |
According to Kraken, such checklists help traders spot regular bullish setups efficiently.
Timing Entries Using Oversold Conditions Below 30
The oversold condition (Below 30) can strengthen a regular bullish divergence setup, because it often appears during late-stage selling.
Many beginners enter too early, so use a simple timing rule. Wait for the price to defend a support area and close back above it. Combining oversold readings with divergence filters out market noise effectively.
Confirming Reversals with Break of Structure and Support Confluence
Strengthen regular bullish divergence RSI signals by waiting for a break of structure (BOS), where price surpasses a previous swing high, alongside support level confluence. This multi-factor approach elevates trade reliability.
- Align with horizontal support lines or demand zones for added buyer defense.
- Monitor for a volume spike during the breakout to affirm conviction.
- Incorporate other indicators, such as moving averages or fundamental analysis for news-driven boosts.
Emphasise risk management by placing stops below recent lows. Such confluences can lift win rates to around 60% in tested setups.
Hidden Bullish Divergence Setup and Trading
Hidden bullish divergence RSI identifies continuation opportunities within established uptrends, where temporary pullbacks present low-risk entry points for traders to align with the prevailing momentum.
Unlike regular divergences that hint at reversals, this pattern emerges during corrections, allowing positions to be added or initiated upon confirmation signals like price rebounds or indicator crossovers.
In practice, traders scan for uptrends, pinpoint the divergence in pullbacks, and enter long trades once a bullish resumption is evident, often integrating trading psychology principles to maintain discipline and avoid emotional entries during volatile dips.
For a Forex example, consider AUD/USD in an uptrend:
The pair forms a higher low during a retracement, but the RSI registers a lower low, signaling that bearish pressure is temporary and the upward trend should resume. This setup encourages buying the dip with defined stops below the low.
Did You Know:
Hidden divergences occur in 40% of strong trends, providing low-risk entries for trend followers.
This pattern reinforces that the divergence is “hidden” because the price chart shows the key low while the indicator continues its pattern, aiding trend traders.
Hidden Divergence Setup: Price Higher Low, RSI Lower Low
The hidden bullish divergence price higher low RSI lower low manifests in an ongoing uptrend as a subtle indicator of temporary weakness.
Here, the price establishes a higher low compared to the prior swing, reflecting sustained buyer support, while the RSI dips to a lower low, indicating a brief surge in selling momentum that fails to disrupt the overall direction.
This configuration is often less obvious than its regular counterpart, requiring careful chart analysis to detect.
Traders typically apply a 14-period RSI to visualise the mismatch, ensuring the uptrend context is intact with higher highs preceding the pullback.
spotting this involves confirming the price’s higher low against the oscillator’s lower reading, which underscores resilient upward bias.
Combining Trend Continuation with Hidden Divergence
Leverage hidden bullish divergence RSI for trend continuation (hidden divergence) by pairing it with trend lines to validate sustained momentum and pinpoint re-entry zones.
- Confirm the uptrend through successive higher highs and lows before seeking the pattern.
- Spot the divergence during a retracement, ensuring price holds above prior lows.
- Enter at the pullback’s conclusion, aligning with the trend line breakout for momentum resumption.
According to Orbex, this integration enhances reliability in trending markets.
Timing Entries and Confirmation Strategies for Hidden Divergence
Time entries for hidden bullish divergence RSI by monitoring the RSI’s rebound from its lower low, ideally crossing above the 50 level to affirm bullish control.
Supplement with moving averages, such as the 50-period EMA acting as dynamic support during pullbacks, to filter valid setups.
Employ multi-timeframe analysis: verify the divergence on a lower timeframe while confirming the uptrend on a higher one, incorporating support level confluence like Fibonacci retracements or pivot points.
For added strength, await a break of structure (BOS) where price exceeds the recent swing high, reducing the risk of premature trades.