


Fibonacci is a valuable tool for improving technical analysis, but its effectiveness depends on how well it’s configured. Many traders may not fully understand its settings on platforms like TradingView or MetaTrader 4/5. By adjusting levels, colours, and display styles, you can enhance the clarity and reliability of your analysis. This article will guide you through the steps to optimise your Fibonacci settings for more confident trading decisions.

- By adjusting Fibonacci settings in TradingView and MetaTrader, you can customise the tool to suit your trading style and optimise results.
- Instead of using all Fibonacci levels, retain only key levels such as 38.2% and 61.8% to avoid chart clutter and facilitate quicker decision-making.
- The accuracy of drawing the Fibonacci is crucial; an incorrect starting point can distort the entire analysis.
- To enhance precision, combine Fibonacci with indicators like RSI or price action patterns to generate stronger trading signals.
What is the Fibonacci Tool and Why is it Important in Technical Analysis?
The Fibonacci tool is based on a numerical sequence where each number equals the sum of the two previous numbers, such as 0, 1, 1, 2, 3, and 5. This sequence, introduced centuries ago by the Italian mathematician Leonardo Fibonacci, gives us key ratios.
Key Fibonacci ratios are essential in technical analysis for identifying support and resistance levels in Forex, stocks, and cryptocurrencies.
Key Fibonacci ratios are as follows:
- 23.6%
- 38.2%
- 50%
- 61.8%
- 100%
By using Fibonacci settings, traders can pinpoint areas where the price is likely to reverse. The tool is popular among traders due to its alignment with natural market behaviour and its accuracy in predicting price movements. From the stock market to crypto, Fibonacci helps analysts gain a better understanding of price action.
Introduction to Fibonacci Levels and Their Application in Trading
Fibonacci Retracement and Extension tools help traders identify price levels on charts where the market is likely to react.
For example, when the market is in an uptrend and undergoes a correction, the 38.2% or 61.8% levels might offer good points for re-entering the trend. On the other hand, extensions like 127% or 161.8% help in setting price targets after a breakout of a resistance or support level.
Many professional traders use these tools in conjunction with price action. They don’t rely solely on the levels but wait for price reactions, candlestick patterns, or support/resistance breakouts to make final decisions. A thorough understanding of ratios and the optimal Fibonacci settings helps structure your analysis more effectively for better tool utilization.
How Fibonacci Retracement Levels Help in Identifying Entry and Exit Points
In financial markets, finding the right time to enter or exit a trade is always a challenge. Tools like Fibonacci retracement help make these decisions a bit easier. Imagine the price of a stock or currency pair has risen and is now undergoing a correction. By using this tool, you can identify levels such as 38.2% or 61.8% on the chart, where the price is more likely to reverse.
- Entry point example: When the price reaches the 61.8% level and shows signs of reversal, it may present a buying opportunity.
- Exit point example: In a downtrend, this level can offer a suitable point to sell.
In practice, many traders enter the market or exit trades at these key levels. Accurate Fibonacci settings, tailored to the chart and timeframe, are crucial for the success of your analysis.
Q: Why does the Fibonacci golden ratio (61.8%) attract strong psychological attention and liquidity in financial markets?
A: The Fibonacci golden ratio (61.8%) is important because it acts as a critical decision zone where market structure, trader psychology, and liquidity converge. Structurally, it represents the deepest correction a trend can make while remaining valid; holding above it supports trend continuation, while a clear break often signals weakness.
Psychologically, price reaching this level increases pressure on late or weak traders, triggering stop-losses and emotional exits. This process releases liquidity, allowing larger market participants to enter or adjust positions efficiently.
Over time, the widespread use of the 61.8% level by professional traders and algorithms has reinforced its importance. As orders cluster around it, the level functions less as an exact price and more as a liquidity absorption zone, where trends are either confirmed or decisively challenged.
Which Traders Use Fibonacci the Most?
Almost all trading styles, from those trading on 15-minute timeframes to those analysing weekly charts, can benefit from Fibonacci. However, this tool is particularly favoured by traders who seek precise reversal points, particularly:
- Day traders
- And swing traders
In markets like Forex and cryptocurrencies, which experience significant volatility, correctly using Fibonacci levels can provide excellent trading opportunities. Therefore, understanding the best Fibonacci settings for each timeframe is crucial, as mismatched settings with your analysis type could result in false signals.
ًQ: Can Fibonacci levels remain effective if market structure shifts from trending to ranging?
A: Fibonacci performs best in clearly trending markets, where impulsive and corrective waves are well-defined. When market structure shifts into a ranging or choppy phase, Fibonacci levels lose predictive power because price movements lack directional commitment. In such cases, traders should either pause Fibonacci usage or combine it with range-based tools like value areas or horizontal liquidity zones. Understanding when not to use Fibonacci is a critical professional skill.

Pro Tip:
During high-volatility periods, such as major news releases or market openings, price often overshoots Fibonacci levels. Instead of relying strictly on exact numbers, treat the levels as price zones, widen your tolerance ranges, and wait for confirmation from price action. This approach helps maintain the accuracy of your analysis in volatile conditions.
Fibonacci Settings in TradingView
TradingView is a popular choice among traders for technical analysis, largely due to its wide array of customisable tools. One such tool, Fibonacci, is especially valuable for pinpointing potential support and resistance levels. However, simply plotting Fibonacci lines on the chart isn’t enough—how these lines are set up is crucial for improving the precision of your analysis.
With TradingView, traders can fine-tune their Fibonacci settings to suit their individual needs. They can:
- Enable or disable specific Fibonacci ratios
- Modify line colour and thickness
- Adjust the display of Fibonacci numbers
Properly configuring Fibonacci settings offers a clearer view of market trends, allowing for more detailed analysis without cluttering the chart with excess information.
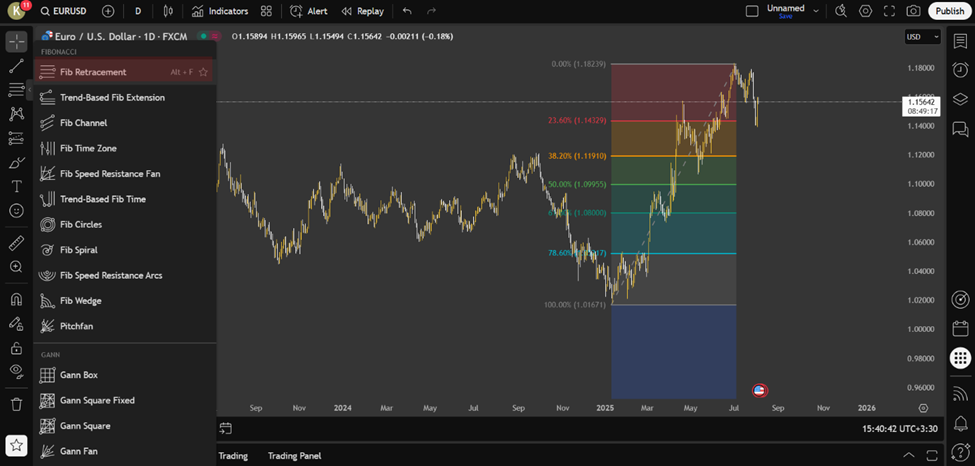
How to Add the Fibonacci Tool to Your Chart in TradingView
To draw the Fibonacci tool:
- first click on the “Gann and Fibonacci tools” option in the toolbar on the left.
- Now, select the ‘Fib Retracement’ option or similar tools.
- Then click and drag across the chart from a lower point upwards (or vice versa).
Choosing the exact bottom and top points is crucial for the accuracy of this tool.
How to Change the Colour, Thickness of Lines, and Font of Fibonacci Numbers
Once you have drawn the Fibonacci tool on your chart, you can fully customise its appearance to suit your preferences:
- Right-click the tool
- Enter the settings menu
- And you can change the line colours, adjust the thickness, and modify the font size of the numbers.
This customization enhances the readability of the levels and makes your chart more practical, especially when working with multiple timeframes.
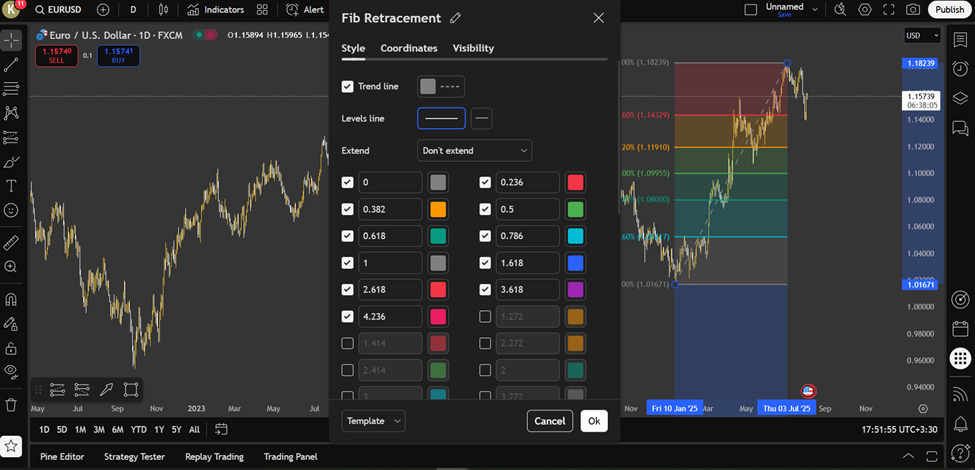
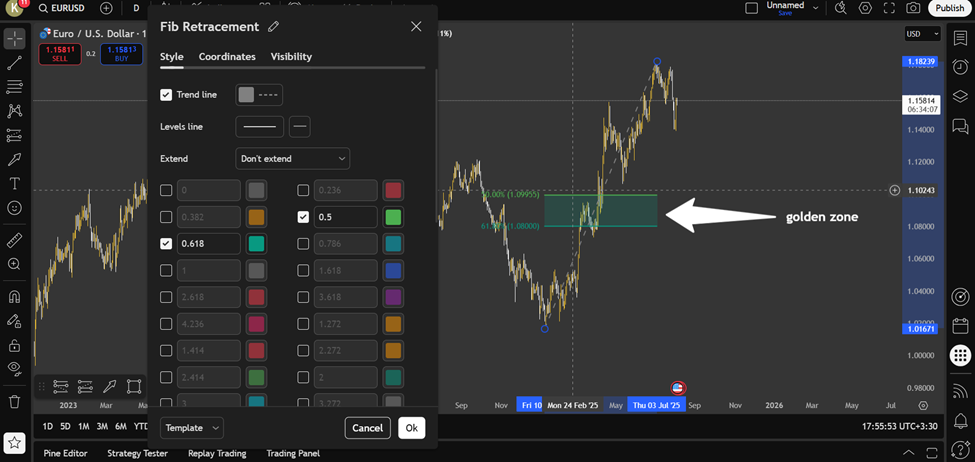
How to Display or Remove Specific Ratios like 0.618 or 1.618
In the Fibonacci tool settings, you can enable or disable any ratio that you need. For instance, if you are focusing solely on the Golden Ratio, you can retain only the 0.5 and 0.618 levels and discard the rest.
This helps you concentrate on the key levels, making your analysis simpler and more effective. Selecting the appropriate ratios is an essential part of Fibonacci settings in TradingView.
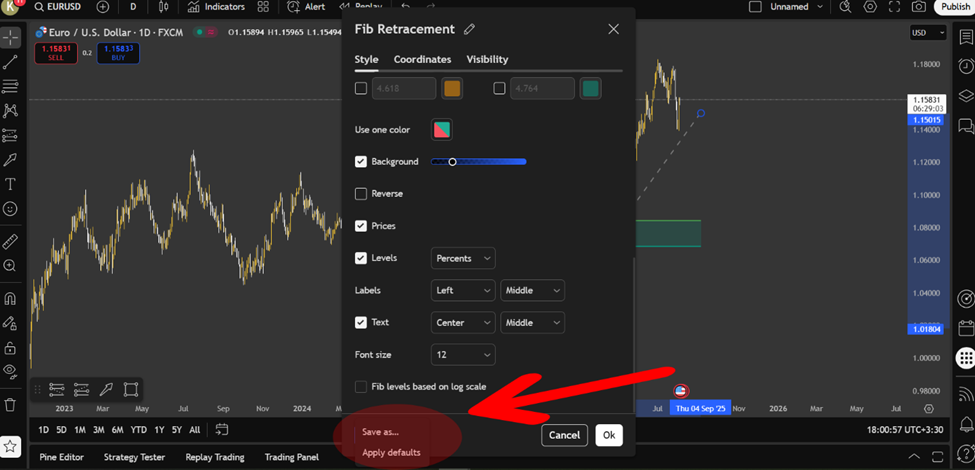
How to Save Custom Fibonacci Settings for Future Use
Once you have adjusted the tool’s settings to your exact needs, there is no need to reconfigure them each time. Simply select the “Apply default” option or save it as a template from the tool menu, and these settings will automatically apply to future charts. This feature in TradingView helps you save time and conduct your analysis more efficiently.
Best Fibonacci Settings in TradingView for Day Trading and Swing Trading
For day trading, it’s recommended to use shorter timeframes such as the 1-hour chart and focus on the 38.2%, 50%, and 61.8% levels.
These levels are excellent for identifying quick reversal points. For swing trading, consider using 4-hour or daily timeframes and include the 161.8% level as a price target. These Fibonacci settings will help align your strategies with your trading style.
Q: Is it valid to draw multiple Fibonacci retracements on different price swings simultaneously?
A: Yes, applying Fibonacci to multiple relevant swings can reveal overlapping retracement or extension levels, known as Fibonacci clusters. These clusters often act as high-probability reaction zones because they reflect agreement across different market participants and time horizons. However, excessive overlapping can create analytical noise, so traders should limit this technique to major swings with clear market significance.
Fibonacci Settings in MetaTrader (MT4/MT5)
The widely used MetaTrader platform (MT4 and MT5) offers a comprehensive set of Fibonacci tools that are especially beneficial for analysing Forex markets. In addition to drawing Fibonacci levels, the platform provides a variety of customisable settings, such as:
- Selecting specific Fibonacci ratios (e.g., 23.6%, 38.2%, 50%, etc.)
- Customising the colours of Fibonacci lines for better clarity
- Displaying exact price levels at each Fibonacci point for increased accuracy
It is essential to note that while the Fibonacci tool can be applied to the chart, incorrect settings can lead to misleading analysis. Misconfigured settings may hinder the accurate identification of reversal points, which are crucial for effective market analysis.
Source Box:
According to LuxAlgo, using higher timeframes to set Fibonacci levels (e.g., daily) and entering trades on smaller timeframes (e.g., 5-minute) can boost the success rate by up to 23%.
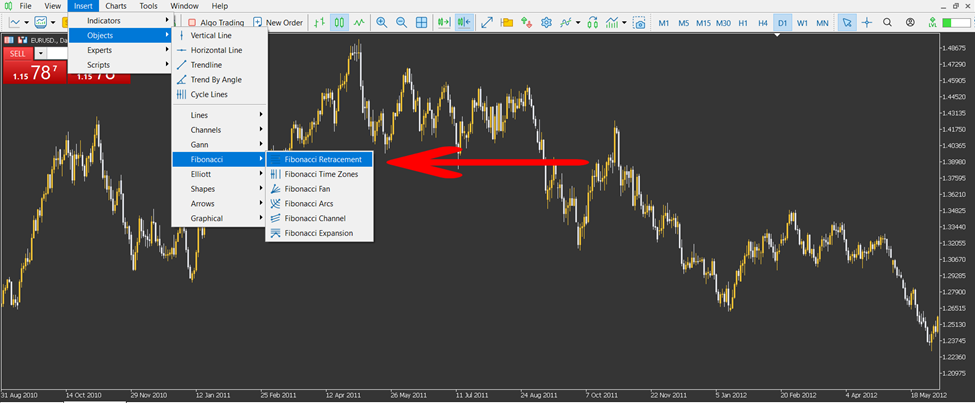
Adding the Fibonacci Tool to a Chart in MetaTrader
To add the Fibonacci tool to a chart in MetaTrader, follow these steps:
- From the top menu, click on “Insert,” then select “Fibonacci” and choose either “Retracement” or “Extension.”
- For an uptrend, click at the lowest point (the trough) and drag the tool to the highest point (the peak). For a downtrend, reverse the process.
- Accurately selecting the trough and peak points in your Fibonacci settings on MetaTrader is crucial for correctly displaying support and resistance levels. This simple process enables you to quickly see key levels on the chart.
How to Edit Levels, Line Colours, and Fonts for Fibonacci in MetaTrader
After placing the Fibonacci tool on a MetaTrader chart (MT4 or MT5), customising its appearance is straightforward and can be done as follows:
- Right‑click on the Fibonacci tool and choose “Properties” to open the configuration panel.
- Navigate between the Levels and Style tabs to refine the display:
- Adjust line colours to make key levels stand out
- Set line thickness for clearer visual hierarchy
- Change the font style and size of the displayed price values at each level

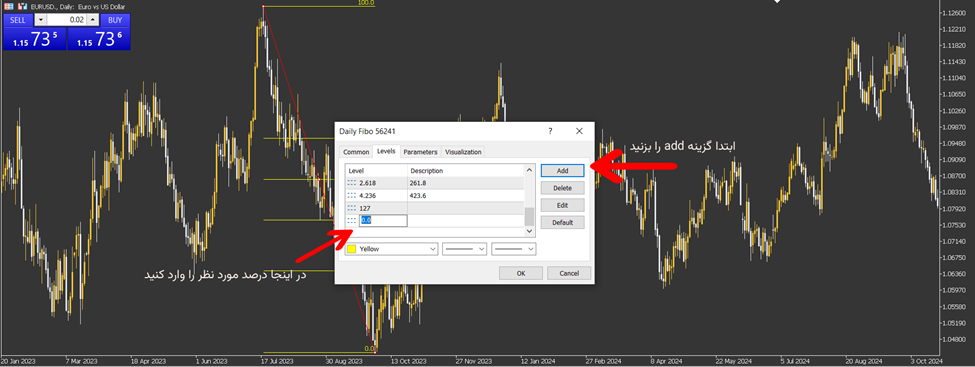
Adding Custom Levels to the Fibonacci Tool in MetaTrader
When you access the Fibonacci tool settings, you can add custom levels such as 78.6% or 127.2% to your list of retracement levels.
These additional levels enable the implementation of more tailored trading strategies. For instance, adding these levels will aid in more precise market fluctuation analysis or in setting profit targets.
Tips for Better Utilisation of Fibonacci in MetaTrader
To maximise the potential of Fibonacci in MetaTrader, incorporating a few strategic techniques can greatly enhance your analysis. Here are some tips to make your Fibonacci tool more effective:- Test Fibonacci across different timeframes: Experiment with the tool on various timeframes to achieve a more robust analysis.
- Combine with other indicators: Enhance signal reliability by combining Fibonacci analysis with indicators like RSI or MACD.
- Use Fibonacci Time Zones: Applying time-based Fibonacci can help identify market cycles and trends.
- Make small adjustments for efficiency: These small tweaks improve the overall effectiveness of Fibonacci settings in MetaTrader.
Best Fibonacci Settings for More Accurate Analysis
Achieving the best results with Fibonacci depends largely on choosing the right settings for your specific trading style and timeframe. To fine-tune your analysis, consider the following:- Activate key ratios: For cleaner, more readable charts, use only important ratios, such as 38.2% and 61.8%.
- Use limited settings for short timeframes: In shorter timeframes, keep the analysis focused with fewer ratios.
- Add extension levels for long-term analysis: For swing or long-term trading, include extension levels such as 127% or 161.8% to set price targets.
- Customise settings for your strategy: The best Fibonacci settings depend on your timeframe and trading strategy, and are crucial for successful analysis.
Is it Necessary to Use All Fibonacci Levels?
According to Investopedia, many market analysts suggest that it is not necessary to use all Fibonacci levels. Focusing on the key levels of 38.2%, 50%, and 61.8% can simplify your analysis and improve its accuracy. Here’s why:- Focusing on key levels: Concentrating on the 38.2%, 50%, and 61.8% levels helps in creating a cleaner and more accurate analysis.
- Avoiding clutter: Adding too many levels can make the chart look cluttered and confusing, reducing the effectiveness of the analysis.
- Price response reliability: Price reactions to these key levels tend to be more reliable and noticeable by the market.
- Smart Fibonacci settings: Choosing the right Fibonacci ratios in your settings is crucial for a streamlined analysis. Activating all ratios can lead to confusion when identifying the most significant price reactions.
Common Mistakes When Using the Fibonacci Tool
Using the Fibonacci tool effectively requires careful attention to detail. Here are some common mistakes traders make and how to avoid them:- Incorrectly identifying high and low points: One of the most common mistakes is incorrectly selecting the high and low points on the chart. This leads to inaccurate Fibonacci levels. For example, choosing the body of the candle instead of the shadows (or vice versa) reduces the precision of the analysis.
- Using Fibonacci on logarithmic charts: Applying arithmetic Fibonacci on logarithmic charts can lead to misleading results. It’s essential to use the correct chart type to avoid such issues.
- Not combining Fibonacci with other tools: Another mistake is not combining Fibonacci with other indicators, such as RSI or trendlines. This can result in weak signals and unreliable analysis.
- Best practices for Fibonacci settings: To ensure the best results, always:
- Select high and low points with precision.
- Verify the chart type to ensure accuracy.
- Combine Fibonacci with other technical indicators, such as RSI or trendlines, for a stronger analysis.
Pro Tip:
Drawing Fibonacci on very short timeframes (e.g., 5 minutes) can generate false signals due to market noise. It’s best to use at least a 1-hour timeframe for drawing levels and then switch to a lower timeframe for entry.
Conclusion
To truly harness the power of Fibonacci in your analysis, it should be seen as more than just a series of static lines. The settings are only the beginning. What matters is the ability to personalise this tool based on your trading style, market behaviour, and alignment with your strategy. Instead of relying on fixed formulas, incorporate Fibonacci settings into your analysis through practice to develop a personal understanding of the best settings for you.


