


Mastering institutional price delivery requires a deep understanding of ICT PD Arrays, the primary framework for mapping how smart money moves through the market. Rather than using static retail levels, these arrays identify dynamic zones where professional orders are gathered and delivered with high precision.
This guide breaks down the classification of ICT PD Arrays and provides a structural roadmap for improving your trade timing and risk management.

- Rather than static support, ICT PD Arrays act as a GPS, revealing the specific route institutional orders take between internal and external liquidity.
- The equilibrium level is not a bounce signal but a mandatory fair price filter that ensures you never overpay for a position.
- Stop hunts are not market errors but the fuel injection phase required to fill large institutional orders before a primary move.
- Fair value gaps function as price magnets that dictate the market's "draw on liquidity" rather than acting as simple barriers.
ICT PD Array Explained: Definition and Market Function
Discover how ICT PD Arrays serve as the building blocks of institutional price delivery and why they are essential for mapping smart money movement.
What PD Arrays Mean in ICT Trading
The term PD Array stands for Premium and Discount Array, a core concept created by Michael J. Huddleston for ICT trading. It is important to remember that a PD Array is not a single indicator but a category representing a collection of structural price zones.
These elements help you identify specific areas where institutional traders place large orders and where the market might pause or reverse direction. Because “array” implies a ranked list, you must learn to identify and combine multiple zones before you decide to place any trade.
PD Array Meaning in ICT Market Structure
In the ICT market structure, price never moves randomly; instead, it is delivered efficiently from one liquidity pool to another liquidity pool. These movements occur through a series of structured levels known as PD Arrays, which act as the specific zones where market delivery happens.
By focusing on these structural zones, you can stop chasing random price movements and start trading with the actual flow of institutions. This perspective allows you to view the chart as a logical map of supply and demand rather than a chaotic series of candles.
Why ICT Maps Institutional Price Levels Using PD Arrays
Retail traders typically mark horizontal support and resistance on their charts. However, the ICT methodology argues that institutions do not operate at fixed horizontal levels. Instead, professional traders place orders at specific structural points where high liquidity exists and where prices can be delivered efficiently.
PD Arrays are the primary way that ICT traders map these institutional price levels. By identifying where institutional activity is most likely, you can align your entries with the larger order flow.
- Better Alignment: This method helps you trade in the same direction as the smart money participants.
- Logical Selection: This approach does not remove all risk, but it does provide a more logical basis for every trade selection.
- Efficiency: Using structural logic allows you to find high-probability zones rather than guessing at random price points.
Premium-Discount Framework Within PD Arrays
Understand why institutions only seek buy setups in discount zones and sell setups in premium zones to maintain a professional edge.
Premium and Discount Zones in PD Arrays
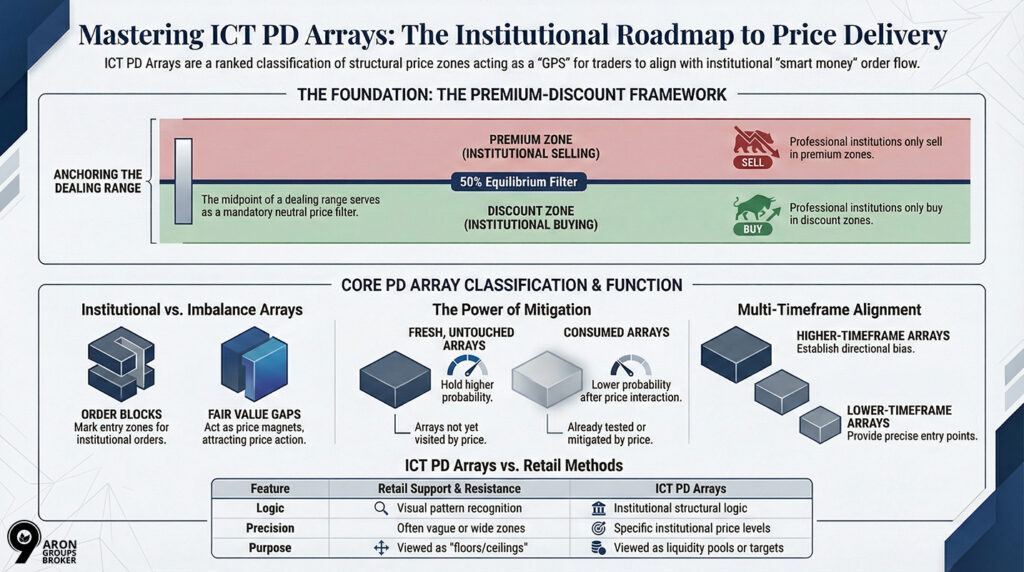
The premium and discount zones are the foundational reference points for the entire PD Array framework within the ICT trading methodology. To define these zones, a trader identifies a significant price range starting from a major swing low to a major swing high.
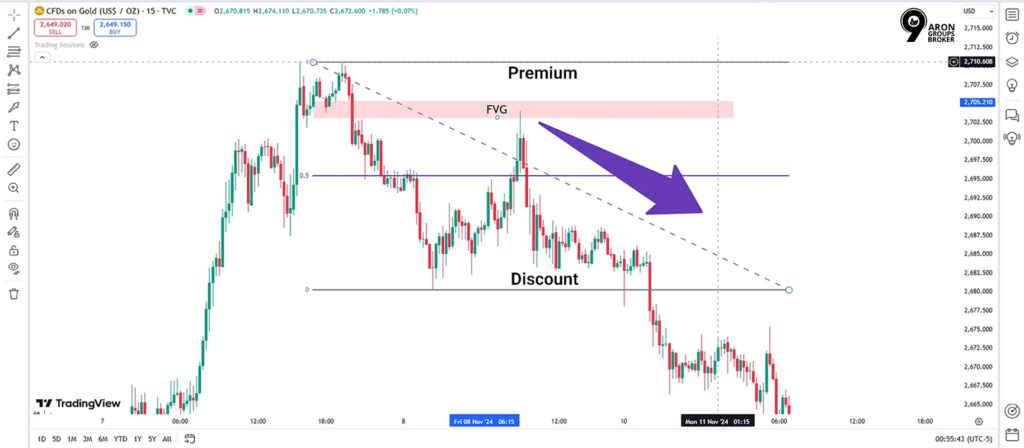
- The Equilibrium Point: The midpoint of that range, calculated at the 50% level, becomes the neutral equilibrium point for the current move.
- The Premium Zone: Price above the 50% midpoint is the premium zone, where institutions prefer to sell at these relatively high prices.
- The Discount Zone: Price below the 50% midpoint is the discount zone, where professional institutions usually look for high-value buying opportunities.
This division reflects the core institutional logic of buying low and selling high to ensure they remain profitable in the financial markets.
How to Use the 50% Midpoint as a Trade Filter
The equilibrium level acts as a primary filter, helping you avoid low-quality entries that occur at unfavourable prices within a dealing range. For example, entering a long trade while the price is still in the premium zone carries much more risk than buying in a discount.
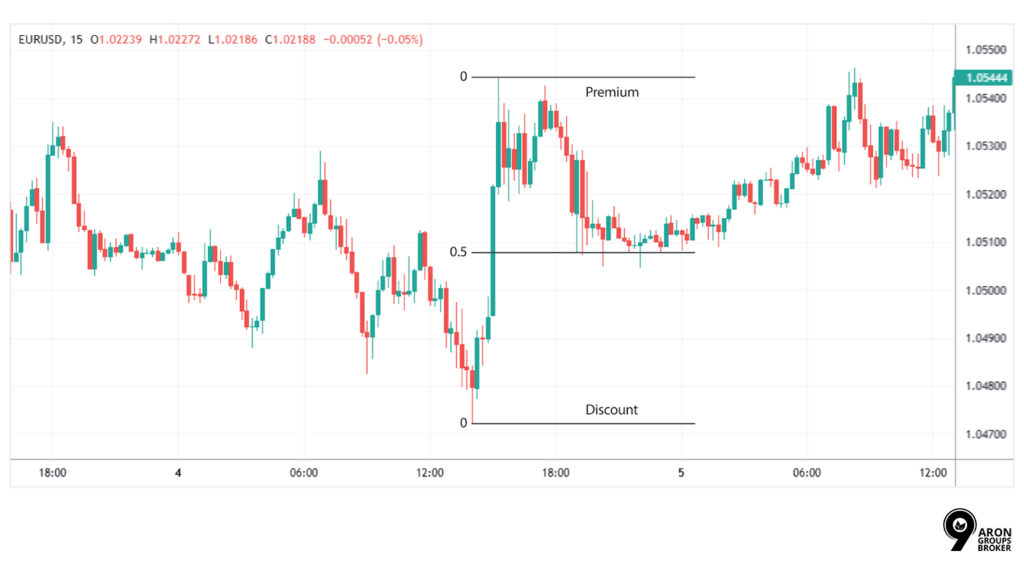
- Lower Probability: Trades taken at the exact 50% equilibrium level carry a weaker argument and are generally considered lower probability setups.
- Structural Tool: Traders commonly use a Fibonacci retracement tool set to 0.5 to mark this structural dividing line on their trading charts.
- Primary Filter: This premium-discount logic is always applied as a first step before you look for any specific types of secondary PD arrays.

The Golden Rule of PD Arrays
Never look for a Buy PD Array (like a Bullish Order Block) in a Premium zone, and never look for a Sell PD Array in a Discount zone. If you are buying in Premium, you are providing liquidity for the institutions that are selling.
By using this 50% rule, you can align your trade selection with institutional order flow and avoid entering the wrong market half.
Anchoring PD Arrays to the ICT Dealing Range
The ICT dealing range refers to the specific price range used to define the premium and discount zones. It is typically anchored to a significant swing high and a significant swing low, or to the prior trading session’s high and low.
The quality of a PD array analysis depends on correctly identifying the dealing range.
- If the dealing range is too narrow, the premium and discount zones will not reflect meaningful institutional activity.
- If it is too wide, the zones lose precision.
Traders must therefore select dealing ranges that correspond to the timeframe and market context they are working with.
Core ICT PD Array Types and Classification
Explore how to categorise and prioritise different arrays by their specific market function to ensure you focus on the most relevant levels.
What Each PD Array Type Is Used For
Every array type serves a unique purpose, acting as either a precise entry zone, a price target, or a market direction filter. Understanding these functions helps you decide how to use each structural level when it appears on your current trading chart.
- Order Blocks and Breakers: These institutional levels are primarily used as precise entry zones where you expect the price to react and reverse.
- Fair Value Gaps (FVGs): These imbalances often act as magnets for price, serving as both entry points and logical targets for your trades.
- Liquidity Voids: These large gaps in delivery are often high-probability targets, as the market often seeks to fill the resulting unfair price action.
- Previous Highs and Lows: These levels mark major liquidity pools and are used to identify potential reversal points in the market.
Understanding all ICT PD Arrays requires knowing how they function together within the current dealing range to provide a complete market picture. You must also consider the specific timeframe of each array to ensure you are only trading from the most significant institutional zones.
Complete ICT PD Arrays List
The following is a structured list of the primary ICT PD arrays:
| PD Array Type | Category | Primary Function |
|---|---|---|
| Order block | Institutional | Mark's prior institutional buying or selling zone |
| Fair value gap (FVG) | Imbalance | Identifies price imbalance requiring mitigation |
| Balanced price range | Imbalance | Marks fully overlapping FVGs on opposing moves |
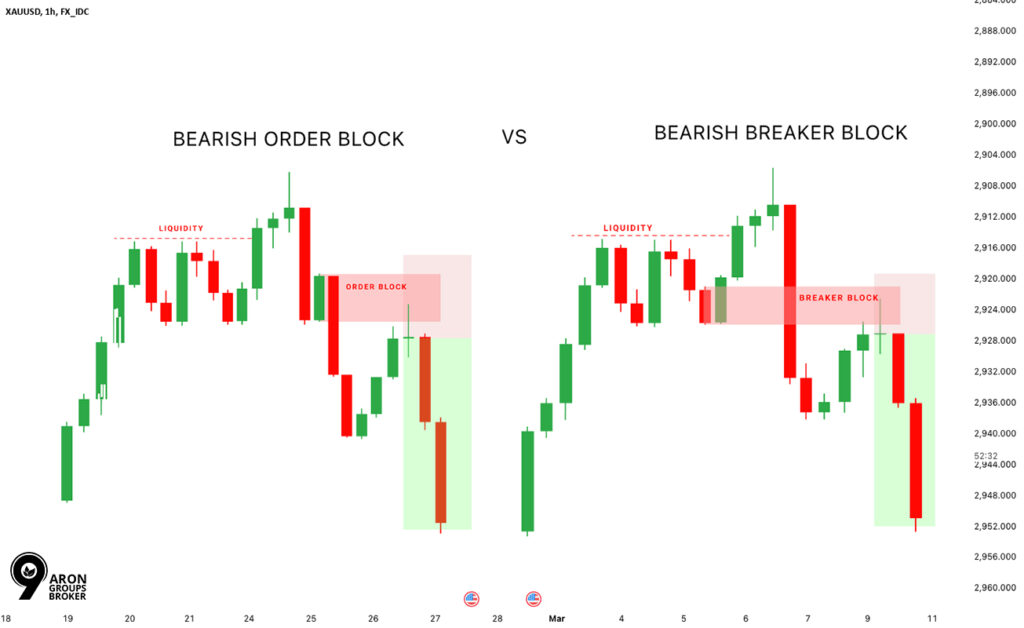
| Breaker block | Institutional | Failed order block that reverses its prior function |
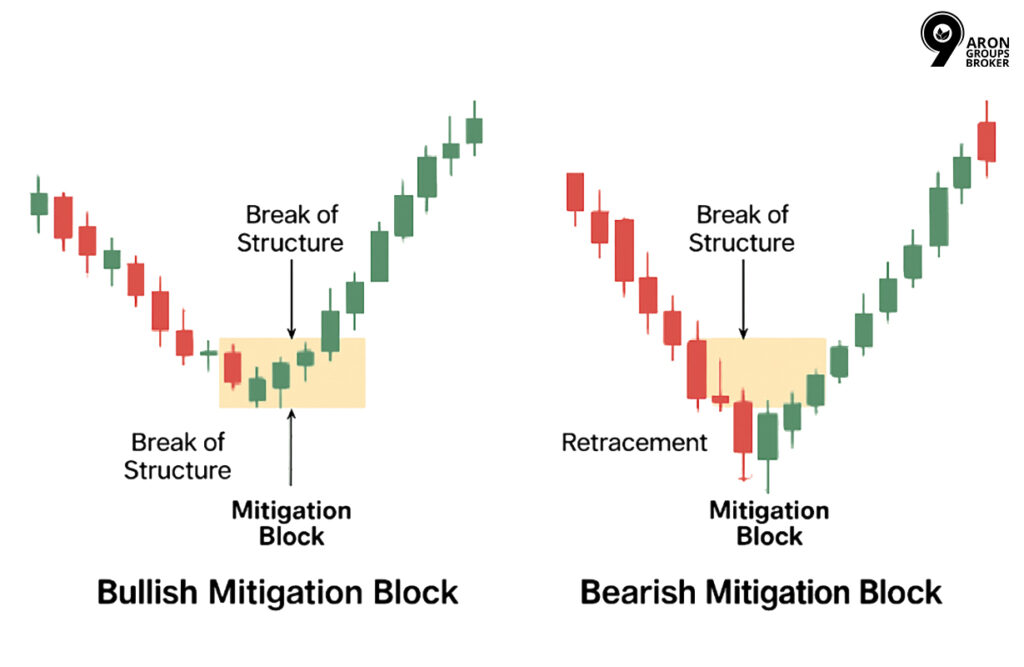
| Mitigation block | Institutional | Similar to breaker; forms after a market structure shift |
| Rejection block | Institutional | Order block defined by wick structure rather than body |
| Liquidity void | Imbalance | Large FVG formed by extreme one-sided price movement |
| Previous high / low | Liquidity | External liquidity pool; stop-order accumulation zone |
| Optimal trade entry (OTE) | Premium-discount | 62%–79% retracement within a dealing range |
ICT PD Array Matrix and Functional Grouping
The ICT PD array matrix is a ranking of arrays by their importance. Not all arrays carry the same weight when you trade. Generally, arrays are ranked by their position in the dealing range, their specific timeframe, and how recently the market formed them.
An order block sitting inside a discount zone on a higher timeframe carries more weight than a fair-value gap in a premium zone on a lower timeframe.
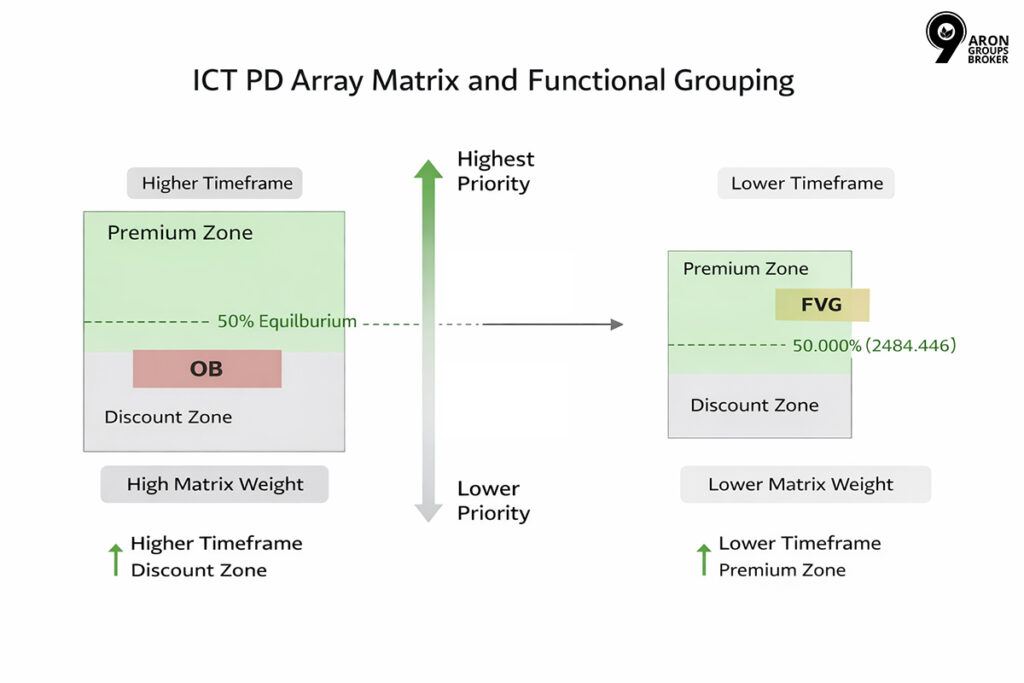
The matrix helps traders prioritise which arrays to use when multiple ones are present on the same chart.
Institutional vs Imbalance-Based PD Arrays
PD arrays divide broadly into two functional groups.
- Institutional arrays such as order blocks and breaker blocks mark zones where large orders were placed.
- Imbalanced arrays, such as FVGs and liquidity voids, mark areas where price moved too quickly, leaving gaps in the order book that the market tends to revisit.
Both types are valid tools within the PD array framework. Institutional arrays tend to mark precise entry zones, while imbalance arrays act as price targets or filters that indicate where delivery is heading.
Imbalance and Delivery-Based PD Arrays
Understand the mechanics of price delivery inefficiencies and how the mitigation process determines the future validity of any market gap.
Fair Value Gaps as PD Arrays
A Fair Value Gap (FVG) is a three-candle formation where the wicks of the first and third candles do not overlap at all. This creates a visible gap in the price chart representing a specific area of market imbalance that institutions eventually need to fill.
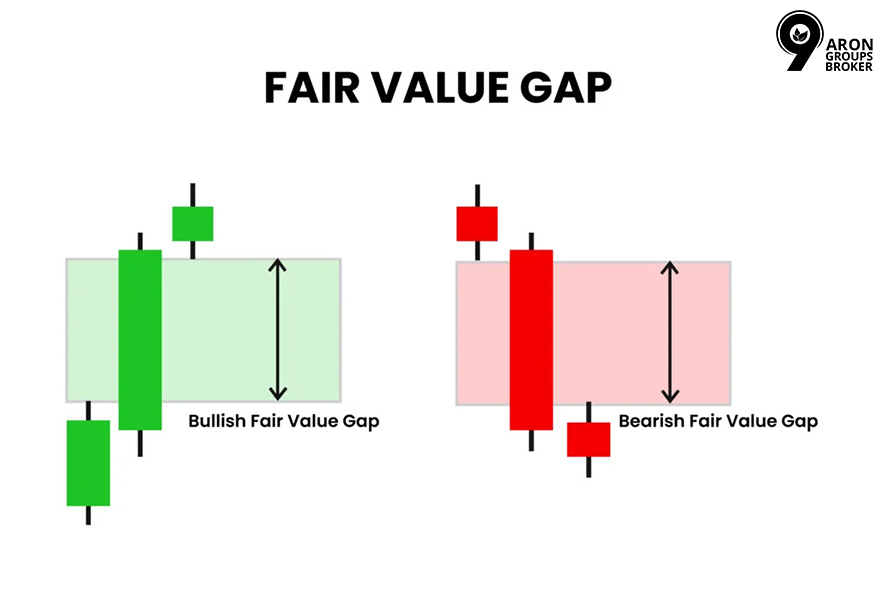
Price tends to return to these gaps because institutional models require efficient delivery across all levels to maintain a balanced order book. In this context, an FVG acts as a powerful draw-on-liquidity, effectively pulling the market price toward the gap like a magnet.
Balanced Price Ranges as PD Arrays in ICT
A Balanced Price Range (BPR) forms when a bullish fair value gap and a bearish fair value gap overlap on the same chart. This overlapping region represents a zone that price has revisited from both directions, creating a perfectly balanced area for institutional order flow.
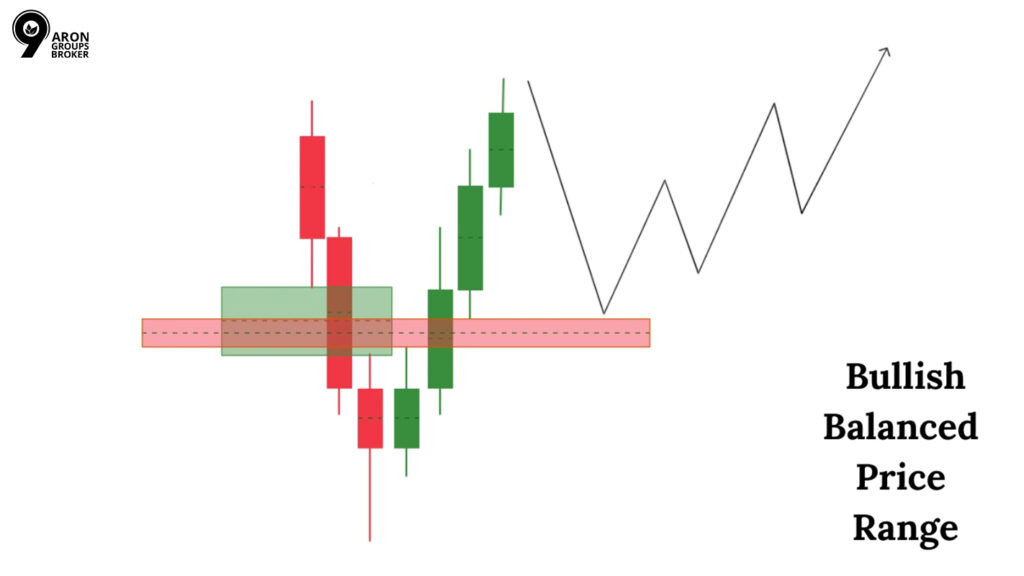
This overlap is considered a high-precision zone because both institutional buy-side and sell-side imprints are present in a single area. Traders use the BPR as a highly refined entry zone when they expect the price to react very strongly from a level.
Mitigation Logic Within Imbalance PD Arrays
Mitigation refers to the specific process where price returns to an imbalance zone to partially or fully close the existing price gap. In ICT terminology, once the price trades through an FVG, the gap is considered mitigated and loses its significance for future moves.
- Target Setting: Traders use this logic to set precise take-profit targets by anticipating exactly how far a corrective move is likely to extend.
- Level Freshness: A fresh imbalance is highly probable, whereas a fully mitigated zone is usually ignored as it no longer contains any unmatched orders.
- Support/Resistance: A partially mitigated FVG often acts as a temporary support or resistance level immediately after the first contact with the market price.
Mitigation vs. Consumption
Think of an FVG like a "hole in the road." Price returns to fill it (mitigation). Once the hole is paved over and the price moves past it, the level is "consumed" and no longer acts as a magnet. Always prioritise "fresh" levels that haven't been touched yet.
Order Flow and Institutional PD Arrays
Examine the arrays that directly reflect professional order placement, focusing on the refined selection of order blocks and their structural variants.
Order Blocks as PD Arrays
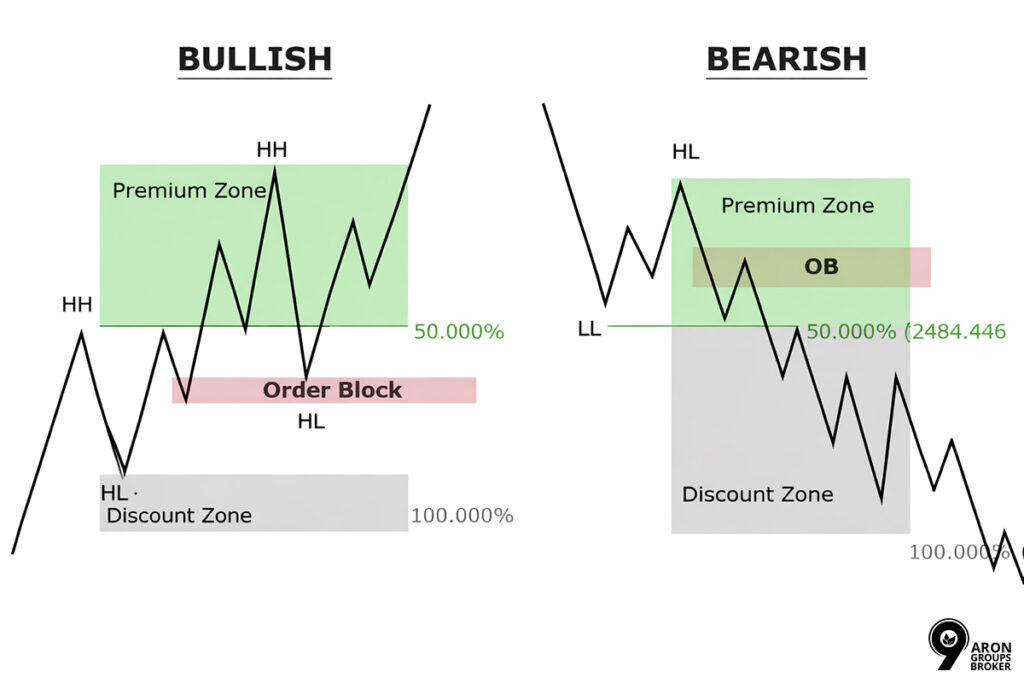
An order block is the last bullish or bearish candle before a significant directional price move. It represents the zone where institutional orders were placed prior to a strong push. In ICT, order blocks are among the highest-ranked PD arrays because they mark specific areas of prior institutional commitment.
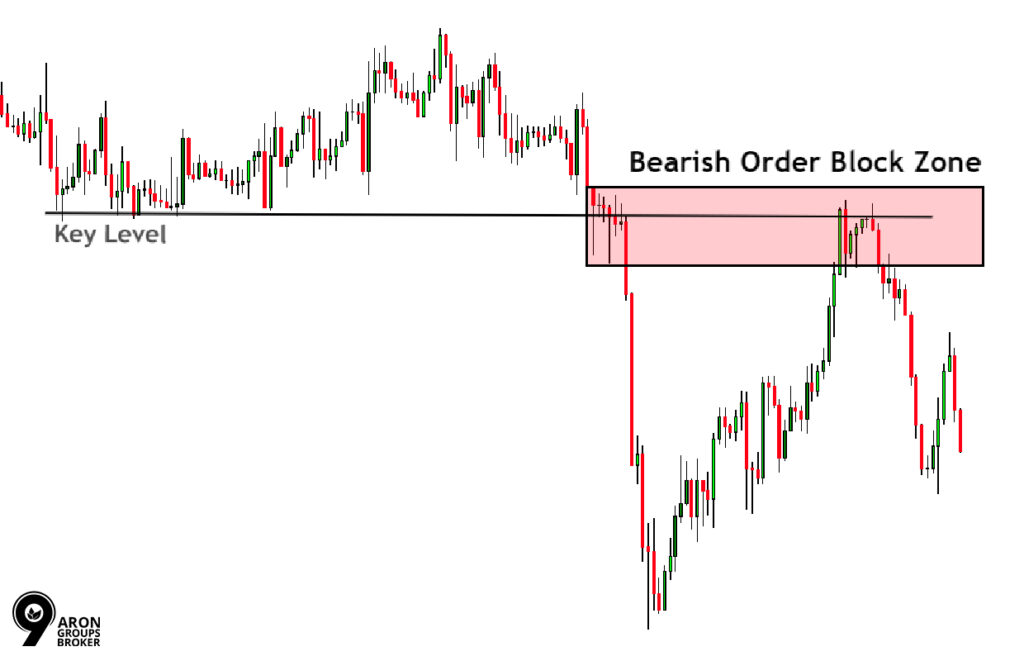
A bullish order block is the last bearish candle before a strong upward move. A bearish order block is the last bullish candle before a strong downward move. When prices return to these zones, traders look for confirmation that institutional interest remains.
Bullish vs Bearish Order Blocks as PD Arrays in Premium/Discount
The position of an order block within the dealing range determines its quality. A bullish order block is most useful as a long entry when it sits within a discount zone, that is, below the 50% midpoint of the dealing range. A bearish order block carries more analytical weight when it sits within a premium zone.
Entering a trade at an order block in the wrong zone, for example, buying a bullish order block in a premium zone, reduces the trade’s logical basis, even if the candle formation is technically valid.
How to Judge Whether an Order Block Is Still Valid
Order blocks mark institutional price levels because they reflect exactly where large positions were originally initiated by the major market participants. Unlike retail levels, these zones do not necessarily disappear after the first test; however, you must monitor them for signs of consumption.
- Retest Logic: Price may return to a valid order block multiple times before the institutional orders are considered fully filled or finally consumed.
- Invalidation Close: An order block is considered invalidated if the price closes beyond the full candle body range, with significant momentum.
- Timeframe Confluence: When a higher-timeframe order block aligns with a lower-timeframe PD array, it creates a much higher-quality level for your trade.
Pro-Tip: The Mean Threshold
The most sensitive part of an Order Block is the Mean Threshold (the 50% level of the candle body). If the price closes beyond the Mean Threshold, it is an early warning sign that the Order Block may fail. If it closes beyond the full wick, the level is officially dead.
Common Validation Errors in Order Block PD Arrays
Identifying an order block requires more than just spotting a specific candle; you must also evaluate its historical context and subsequent price momentum. Avoid these two common pitfalls to ensure the levels you mark on your chart carry the necessary institutional weight for high-probability trades.
Error 1: Using Consumed or Stale Levels
A frequent error is marking an order block too far back in price history, in an area already fully absorbed by subsequent action. An order block is considered officially consumed once the price trades completely through it and closes significantly beyond its established candle body range.
Error 2: Lack of Impulsive Displacement
Another common error is marking an order block without first confirming the absolute strength of the directional move that immediately followed the formation. A genuine institutional order block must be followed by a strong, impulsive move that breaks prior structure rather than a slow, gradual drift.
Liquidity-Driven PD Arrays
Learn how liquidity pools at previous highs and lows dictate the path of price delivery and serve as primary targets for institutions.
Previous Highs and Lows as PD Arrays
Previous highs and lows are PD arrays because they act as liquidity pools. Traders who placed buy stops above a prior high or sell stops below a prior low are the liquidity that institutions need to fill large orders. In ICT, previous highs and lows are not primarily treated as barriers; they are treated as targets.
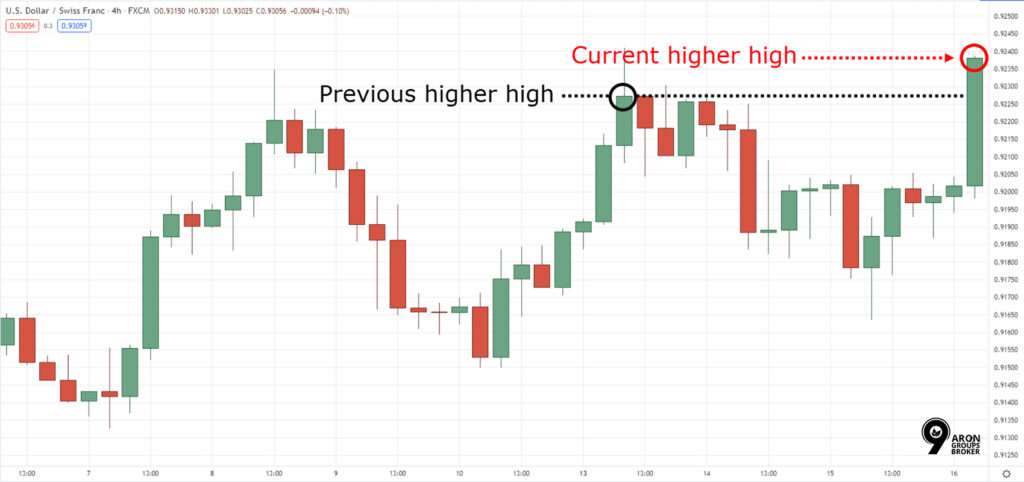
When price is trending, the market tends to run stops above previous highs in a bullish context or below previous lows in a bearish context before reversing or continuing. Identifying these levels helps traders anticipate where the price is drawn before a significant directional move.
External vs Internal Liquidity PD Arrays
ICT distinguishes between external liquidity and internal liquidity. External liquidity refers to highs and lows that sit outside the current price range, such as the most recent swing high or swing low. Internal liquidity refers to equal highs or lows, FVGs, and imbalance arrays that sit within the current price range.
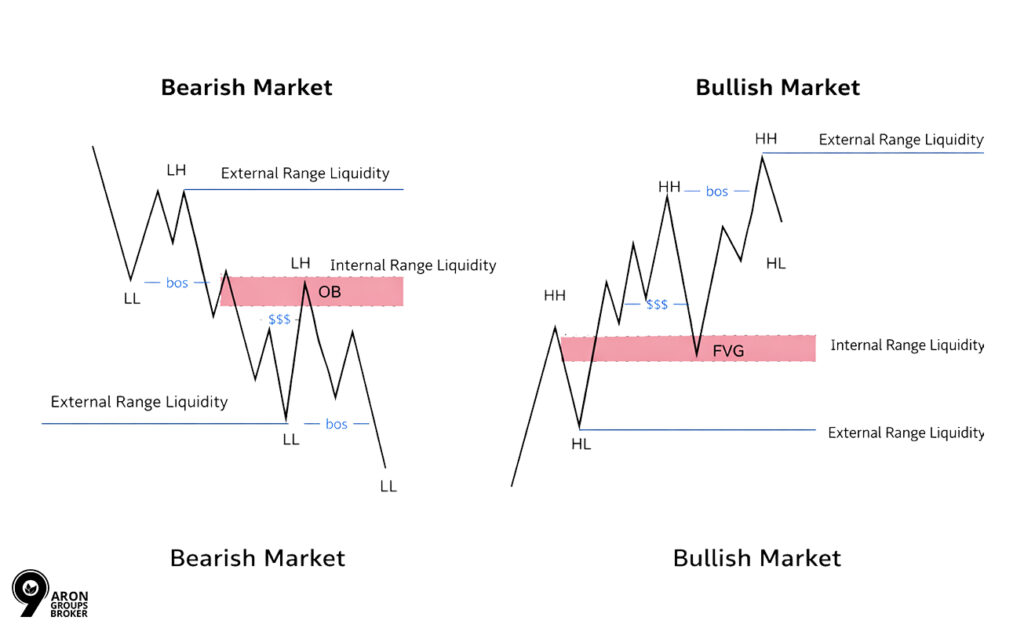
Price typically targets external liquidity first to engineer a stop sweep, then retraces into internal PD arrays such as an order block or FVG before resuming the larger move. Understanding this sequence allows traders to avoid entering too early and being stopped out by the liquidity sweep.
Stop Hunts Around PD Arrays
A stop hunt, also called a liquidity sweep, occurs when the price moves deliberately beyond a prior high or low to trigger stop orders. In the ICT framework, these are engineered liquidity-collection moments that always precede significant institutional order placement and large directional market moves.
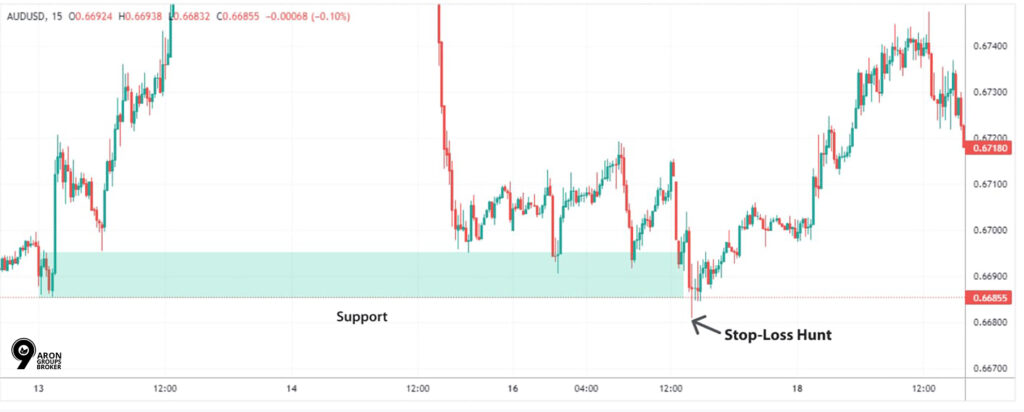
These events are structural necessities for big players, not random market noise or broker-driven price manipulation on your live trading chart. Recognising a stop hunt helps you confirm that the market has collected enough fuel to power the next major price expansion move.
While most retail traders see these moves as breakouts, professional ICT traders view them as a signal that a reversal is now imminent.
Liquidity Engineering Within PD Array Frameworks
Liquidity engineering explains the specific sequence institutions use to enter or exit large positions without moving the market price against their own interests. By driving price into areas where retail stop orders accumulate, institutions generate the massive volume they need to fill their orders.
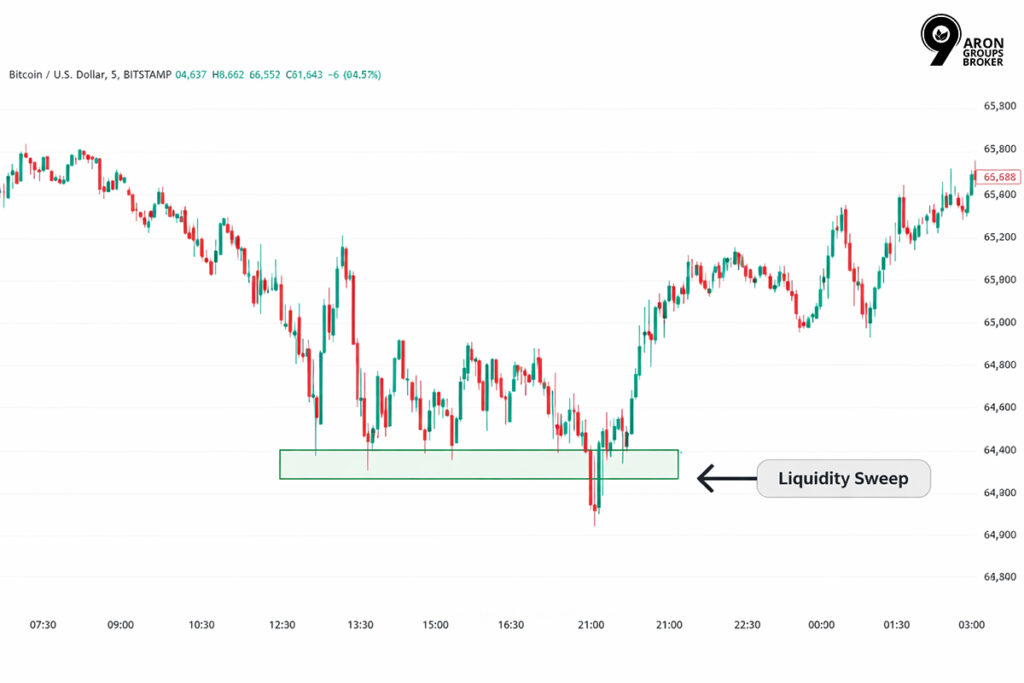
The Three-Step Sequence:
- The Sweep: Price exceeds a key high or low to engineer the liquidity needed to liquidate resting retail stop-loss orders.
- The Retrace: After the sweep, the price retraces into a specific PD Array, such as a discount order block or a fair-value gap.
- The Delivery: The market then delivers in the intended direction, moving away from the manipulated zone with high speed and clear institutional momentum.
Multi-Timeframe PD Array Integration
Master the top-down approach of aligning higher-timeframe directional bias with lower-timeframe execution for maximum precision.
Timeframe Context of PD Arrays
PD arrays do not exist in isolation from the timeframe. An order block on a weekly chart carries significantly more weight than the same formation on a five-minute chart. The timeframe context of PD arrays determines how much influence each array has over price delivery.
In ICT methodology, traders typically begin their analysis on higher timeframes weekly, daily, or four-hour charts to identify the dominant PD arrays. They then move to lower timeframes to find precise entry opportunities within those higher-timeframe zones.
Higher Timeframe PD Arrays for Directional Bias
A higher-frequency PD array, such as a weekly order block or a daily fair-value gap, establishes the primary directional bias for your trade. If the price is approaching a bearish order block in a premium zone, the bias is bearish, and you should seek short entries.
Q: What is The Role of Decision Zones?
A: Higher-timeframe PD arrays act as major decision zones where prices are likely to consolidate or react before committing to a larger directional move. Ignoring these higher-timeframe levels is one of the most common reasons why traders accidentally take entries against the dominant institutional flow.
Q: How to Determine Market Direction?
A: Identifying a significant array on the daily or weekly chart allows you to filter out lower-timeframe noise and focus on high-probability setups. This top-down approach ensures that every trade you take is supported by the massive order flow moving through the larger market framework.
Lower Timeframe PD Arrays for Trade Execution
Once your directional bias is established, you move to lower timeframes to identify precise entry arrays that sit within your higher-timeframe zone. Executing on a lower timeframe allows you to use a tighter stop-loss, which significantly improves your overall risk-to-reward ratio on the trade.
- Entry Trigger: You enter at a specific structural point, such as the Mean Threshold of a five-minute order block candle body.
- Stop-Loss Placement: Set your stop-loss safely at the invalidation point of the lower-timeframe array to protect your capital from sudden market spikes.
- Structural Logic: This professional approach ensures that each trade is backed by a firm reason rather than just a simple guess or feeling.
Managing Multi-Timeframe PD Array Conflicts
Conflicts arise when a higher-frequency PD array signals one direction and a lower-frequency array signals the opposite. For example, price may be trading into a bearish daily order block (bearish bias) but simultaneously filling a bullish FVG on the one-hour chart (short-term bullish pressure).
In these situations, the higher timeframe array takes precedence for directional bias. The lower-timeframe array may still yield a valid short-term reaction, but it should not override the higher-timeframe context. Traders are advised to reduce position size or wait for the lower timeframe array to be mitigated before entering in the direction of the higher timeframe bias.
PD Arrays vs Traditional Technical Levels
Understanding the difference between retail tools and institutional arrays is essential for shifting your perspective from simple pattern recognition to deep market logic.
Traditional levels rely on historical bounces, whereas PD Arrays identify where institutional orders are currently resting or where price delivery remains incomplete.
PD Arrays vs Support and Resistance Levels
Traditional support and resistance levels are usually drawn based on where the price has previously bounced multiple times without any deeper structural reasoning. In contrast, PD Arrays are identified using specific criteria like order block candles, three-candle imbalance patterns, or significant swing highs that hold liquidity.
The fundamental difference lies in the logic:
Support levels exist because price reacted there, while PD arrays exist because institutional orders are present.
| Feature | Retail Support & Resistance | ICT PD Arrays |
|---|---|---|
| Logic | Visual pattern recognition | Institutional structural logic |
| Definition | Where the price was touched many times | Where orders are likely gathered |
| Precision | Often vague or wide zones | Specific institutional price levels |
Execution Differences Between Institutional PD Arrays and Retail Levels
Retail support and resistance levels are widely watched, making them predictable targets for institutional stop hunts rather than safe entry zones. ICT PD Arrays identify structurally meaningful levels that allow traders to anticipate institutional reactions before a visible bounce or rejection occurs on the chart.
- Entry Logic: ICT traders enter within arrays in anticipation of flow, rather than waiting for the retail “confirmation” of a price bounce.
- Defined Risk: Stop-losses are placed at the array’s invalidation point, offering a more precise risk boundary than vague and subjective retail support zones.
- Liquidity Awareness: While retail traders view horizontal lines as floors, ICT traders see these as liquidity pools that institutions will target and sweep.
- Execution Timing: Using arrays allows for entries during the delivery phase, providing a significantly higher risk-to-reward ratio than traditional, reactive retail breakout methods.
Precision and Structural Behaviour in PD Arrays
One major advantage of PD Arrays is their inherent precision, as each array has clearly defined high and low values for your analysis. For example, using the body of an order block candle allows you to set a specific invalidation level rather than guessing a zone.
- Defined Invalidation: Each array type has a built-in “expiry date” that tells you exactly when a specific trade setup is no longer valid.
- Structural Risk: This mechanical approach to price levels supports a more professional risk management strategy compared to trading with traditional horizontal price lines.
- Clear Boundaries: Professional traders use these structural limits to place stop-losses precisely, ensuring they only stay in trades while the logic remains intact.
Practical Execution Models Using PD Arrays
Convert theoretical concepts into a repeatable, step-by-step execution model that features strict entry triggers and defined risk parameters.
Entry Models Based on PD Arrays
Entry models using PD arrays follow a logical sequence to ensure you are trading with the higher-timeframe trend and professional order flow. This systematic approach helps you time your entries precisely while managing your risk effectively within the current market dealing range.
The Entry Sequence:
- Identify Range: Define your trading range and confirm your directional bias by using the market price’s premium or discount.
- Higher Timeframe (HTF): Locate the most relevant higher-timeframe PD array where you expect a significant institutional reaction to occur very soon.
- Lower Timeframe (LTF): Use lower-timeframe arrays, such as an order block midpoint or an FVG edge, to time your entry.
Confirmation via Market Structure Shift (MSS)
Traders often use a Market Structure Shift as a secondary confirmation signal before entering a new position within a high-probability zone. An MSS forming from a discount zone order block proves that the chosen array is active and currently holding the price.
Confluence Between PD Arrays and Market Liquidity
Confluence occurs when multiple PD arrays align at or near the same price level. For example, a discount zone bullish order block that also coincides with a bullish FVG and sits just below a previous low (external liquidity that has been swept) represents a strong confluence of ICT signals.
Confluence does not eliminate risk. However, it does strengthen the structural argument for a trade. Traders should note that adding more arrays to a confluence does not proportionally increase probability. Quality of confluence matters more than quantity.
Risk Management Around PD Array Levels
Risk management in the PD array framework is built around the specific invalidation logic of each individual array type on your chart. If the price closes beyond an order block’s full range, the level is considered consumed, and your trade setup is technically invalidated.
- Structural Stop-Loss: This clear logic provides a professional basis for stop-loss placement rather than guessing where to protect your active trading position.
- Smart Position Sizing: Calculate your position size based on the distance to the invalidation point instead of using a fixed number of pips.
- Consistent Risk: This approach ensures that each trade carries a consistent monetary risk regardless of the physical size of the chosen PD array.
Important Note:
Trading CFDs involves a significant risk of loss. You should consider whether you understand how CFDs work before applying these concepts.
Conclusion
ICT PD Arrays offer a professional framework for mapping institutional price delivery by identifying where big players buy at discounts and sell at premiums. By aligning these arrays across timeframes, you can time executions using structural logic rather than unreliable horizontal lines.
The most effective setups occur when multiple ICT PD Arrays converge with a lower-timeframe market structure shift to confirm the entry. Mastery requires consistent practice, as these interconnected tools must be used together to improve precision while managing the inherent risks of trading.