


ICT Time and Price Theory is a way to understand why prices often move at certain times, not by chance. Instead of staring at charts all day, you learn to watch key market hours when activity tends to rise, especially during major trading sessions.
This approach helps beginners focus on clearer moments, avoid random noise, and build better timing habits. If you have ever wondered why markets suddenly “wake up” and then calm down, this guide will make it easier to understand.
Stay with us until the end to learn a simple timing routine you can practise.

- The ICT time and price theory treats time and price as connected elements that institutions use to reach targeted levels efficiently.
- Specific sessions like London and New York often trigger liquidity raids followed by strong directional expansions.
- Combining timing with key structures, including Fibonacci retracement, creates higher-probability trading setups.
- Patience and solid risk management help traders avoid common pitfalls when applying these concepts.
Foundations of ICT Time and Price Theory
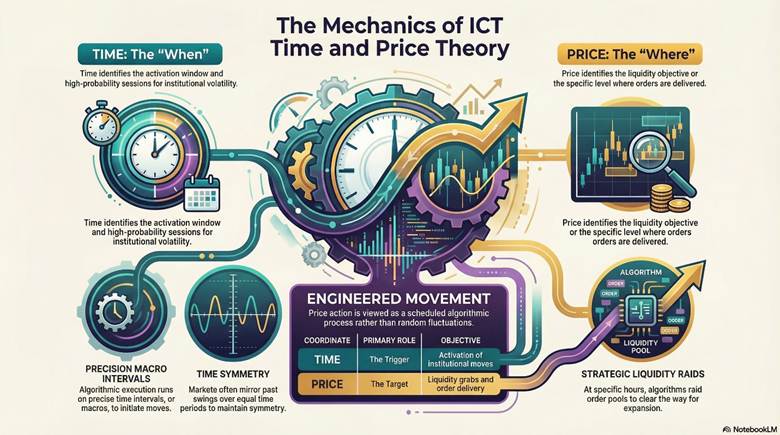
The ICT time and price theory explains market behaviour through two coordinates: time and price. Rather than analysing charts by price levels alone, this framework studies when markets are likely to move and where the price is expected to be delivered.
It assumes that institutions operate within structured timing windows and seek liquidity at specific levels.
Traditional technical analysis often focuses on patterns, indicators, or static support and resistance. In contrast, ict time and price theory views price movement as scheduled and engineered, not random.
What ICT Time and Price Theory Really Means
At its core, ict time and price theory separates two essential questions:
- Time = When the price will move
- Price = Where it is delivered
Time identifies the activation window. Price identifies the liquidity objective.
This approach aligns with the broader smart money concept, which suggests that large institutions accumulate and distribute positions strategically.
Instead of chasing breakouts at random hours, traders study market timing in ICT to anticipate volatility during high-probability sessions.
According to a comprehensive guide on ICT concepts, this theory shifts attention from pure price action to the coordination of time and price delivery.
Core Principles of Time-Based Market Movement
Several key ideas support time-based market movement in ICT.
- First, algorithmic execution runs on precise intervals, often called macros.
- Second, liquidity seeking drives price to pools of orders at expected times.
- Third, time symmetry in markets means price often mirrors past swings over equal time periods.
These principles create repeatable patterns. According to Inner Circle Traders resources, understanding them helps anticipate ICT algorithmic price delivery.

Key Insight:
In ICT, time is the trigger that activates institutional moves. Price levels are deliberate targets for liquidity grabs or delivery. Aligning both creates high-probability setups driven by smart money concept algorithms.
How Time, Liquidity, and Price Interact in Markets
Time, liquidity, and price work together in ICT. At specific hours, algorithms raid liquidity pools, such as stop-loss orders above highs or below lows.
This raid clears the way for true directional moves. Without the right time, the price stays in range, even near key levels.
Once liquidity is taken, displacement follows, leading to expansion. This interaction explains why some breakouts fail while others run strongly.
As noted in a Medium analysis of ICT theory, timed liquidity grabs enable efficient price delivery.
Q: How does this differ from classic technical analysis?
A: Classic methods focus on patterns like head and shoulders. ICT adds timing, showing why the same pattern succeeds in one session but fails in another.
Understanding Market Phases and Sessions
In ICT methodology, the trading day splits into clear phases and sessions. Session timing ICT plays a key role in predicting price behaviour. Traders use these ICT time cycles to anticipate shifts from consolidation to directional moves.
Recognising these periods improves alignment with institutional activity.
Spotting Range vs Expansion Phases in Daily Trading
Markets typically alternate between range (consolidation) and expansion (directional movement) phases.
- Range Phase:
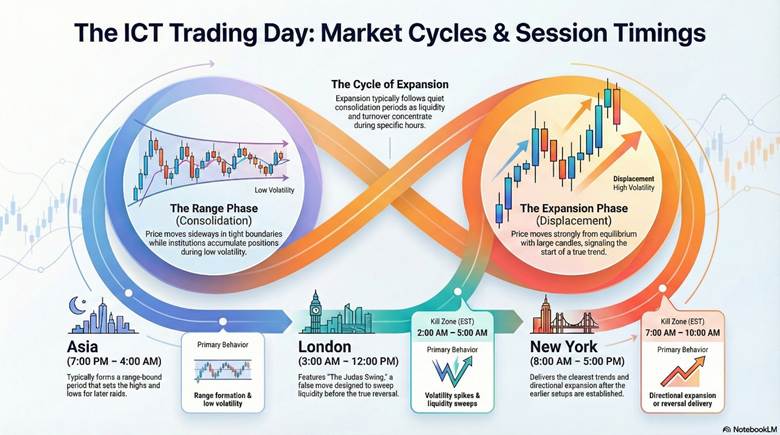
Range phases show consolidation. Price moves sideways in tight boundaries. Volatility stays low. Institutions often accumulate positions here.
- Expansion Phase:
Expansion phases bring directional moves. Price displaces strongly from the equilibrium. Strong candles appear. This signals true trend development.
liquidity and turnover concentrate during certain trading hours, which helps explain why expansion often follows quiet consolidation periods.
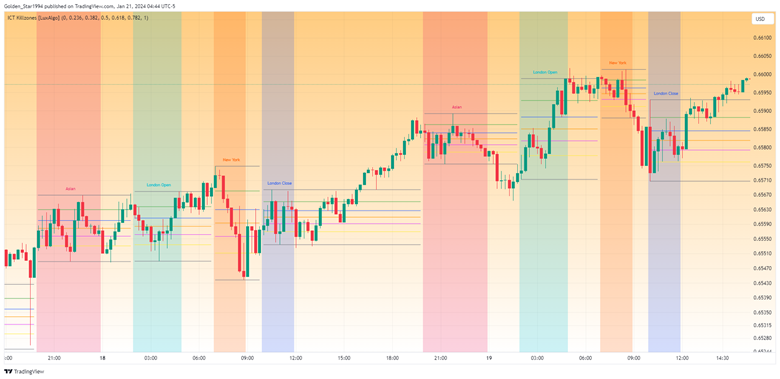
In ICT time cycles, the Asian session frequently forms the range, while the London session or the New York session initiates expansion. Recognising this time-based market shift helps traders avoid premature entries during consolidation.
Session Timing in ICT: Asia, London, and New York
ICT divides the day into three major sessions with specific timings in Eastern Standard Time (EST).
- The Asian session runs approximately from 7:00 PM to 4:00 AM EST. It often forms a range-bound period.
- The London session opens around 3:00 AM and closes near 12:00 PM EST. Its kill zone falls between 2:00 AM and 5:00 AM EST.
- The New York session starts at 8:00 AM and ends around 5:00 PM EST. The key kill zone here is 7:00 AM to 10:00 AM EST.
These windows highlight when liquidity and volatility peak.
| Session | Approx. EST Time | Typical Behaviour |
|---|---|---|
| Asia | 7:00 PM – 4:00 AM | Range formation, low volatility |
| London | 3:00 AM – 12:00 PM | Volatility spike, liquidity sweeps |
| New York | 8:00 AM – 5:00 PM | Expansion or reversal delivery |
More Info:
The London session often creates the Judas Swing – a false move designed to take stops before reversing toward the true directional objective.
How Market Behaviour Changes Across Sessions
Each session plays a different role in the daily cycle:
- Asia accumulates liquidity within a narrow range.
- London grabs liquidity through stop runs and volatility spikes.
- New York delivers expansion, confirming the true move or reversing London’s manipulation.
This sequence reflects ICT time cycles, where liquidity must first build before directional expansion occurs.
By aligning entries with session timing ICT, traders improve probability and reduce exposure to low-activity periods.
Q: Which session typically delivers the strongest directional move?
A: New York often delivers the strongest sustained move, especially when it confirms the London session’s liquidity sweep. This is because US participation adds volume to existing momentum.
Interactions Between Time, Price, and Market Structures
In ICT methodology, time aligns precisely with market structures to drive efficient price movement. Key levels, such as dealing ranges and PD arrays, act as destinations for ICT algorithmic price delivery.
This interaction creates opportunities for time-based price expansion when confluence occurs.
According to FXOpen‘s guide on PD arrays, combining time with these structures reveals institutional intent more clearly.
Time and Dealing Range: Finding the Sweet Spot
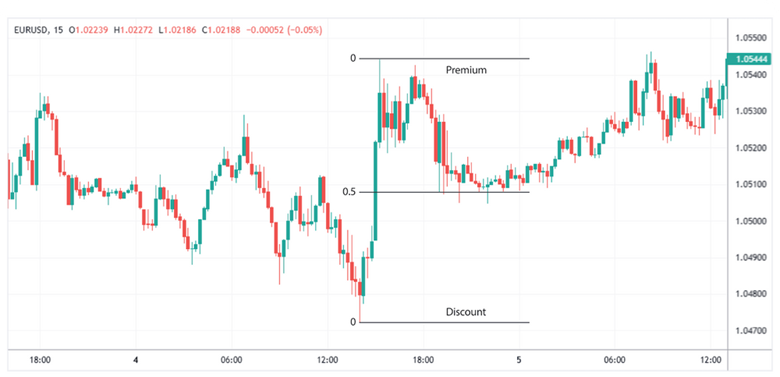
A dealing range forms between the most recent swing high and swing low during low-volatility periods. Price seeks equilibrium near the midpoint, often the 50% level.
Institutions accumulate or distribute here before expansion. Time windows determine when the price enters or exits this range effectively. This sweet spot offers balanced risk when aligned with session timings.
Aligning Time with PD Arrays for Accurate Price Delivery
PD arrays include order blocks, fair value gaps, breakers, and mitigation blocks. These represent premium (above equilibrium) or discount (below) zones. Algorithms deliver prices to these arrays at specific times for liquidity raids or reversals.
Fibonacci retracement levels often coincide with PD arrays, enhancing confluence. For instance, the 0.618 or 0.79 levels mark premium/discount boundaries.
According to TradingFinder’s explanation of PD arrays, this alignment supports precise ICT algorithmic price delivery.
Tip:
Mark PD arrays on your chart and wait for the correct session before expecting a price reaction. Acting too early reduces the probability.
Multi-Timeframe Logic: Making Time and Price Work Together
Effective execution combines higher timeframe bias with lower timeframe precision. The higher timeframe establishes directional expectation. The lower timeframe identifies entry during the correct session window.
For example:
- The daily chart identifies bullish bias.
- The four-hour chart defines the dealing range.
- Fifteen-minute chart confirms entry during London or New York overlap.
This multi-timeframe approach supports time-based price expansion while filtering low-probability trades.
Q: How do I identify a dealing range in practice?
A: Draw lines from the most recent clear swing high to swing low. The area in between is the dealing range. Price oscillates here until a timed displacement breaks it.
ICT Algorithmic Price Delivery and Expansion
Price expansion in modern markets is rarely accidental. Institutional trading desks rely on automated execution models that release volume during high-liquidity windows.
This process is often described as ICT algorithmic price delivery, where timing and structure combine to move price efficiently from one liquidity zone to another. Instead of constant volatility, markets typically compress before expanding.
How Time-Based Price Expansion Happens
Markets frequently remain range-bound until a macro session opens or an economic catalyst increases participation.
During quiet hours, liquidity builds above and below the range. When a major session begins, accumulated orders provide fuel for time-based price expansion.
For example:
- Asian session forms a consolidation.
- London open increases volatility.
- New York overlap accelerates directional flow.
Adding Displacement to Your Time and Price Analysis
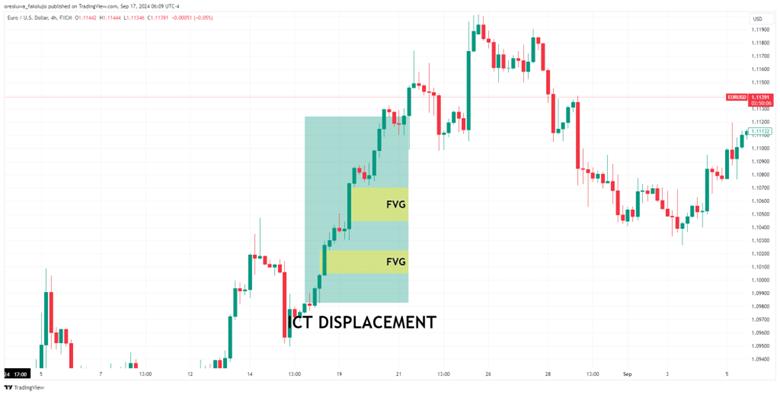
Displacement appears as strong, consecutive candles moving away from equilibrium. It confirms a true directional shift after liquidity is taken.
- Bullish displacement shows large green candles with minimal wicks.
- Bearish versions feature red candles pushing lower forcefully.
This momentum signals institutional conviction. Adding displacement to analysis filters weakens ranges from genuine expansions. According to howtotrade, displacement often leaves fair value gaps behind.
Key Point:
Displacement after a macro time often signals the start of true directional expansion.
Using Algorithmic Signals to Enhance Market Timing
Timing alone is insufficient without structural confirmation. Traders often combine session windows with clearly defined support and resistance zones.
Many use tools such as a support and resistance indicator to visualise reaction levels and identify confluence.
When the following elements align, probability increases:
- Macro session open
- Liquidity sweep
- Structural level interaction
- Displacement confirmation
This confluence approach strengthens time-based price expansion analysis and reduces false signals.
Q: What triggers time-based price expansion in ICT?
A: Specific macro times act as triggers. Algorithms seek liquidity first, then displace price strongly, leading to expansion once resistance clears.
Applying ICT Time and Price Theory in Real Trading
Traders apply the ICT time and price theory practically by combining precise timing with market structure. This can enhance market timing in ICT for higher-probability setups.
Success depends on consistent execution and strong risk awareness, as no method eliminates losses entirely.
According to Morpher’s ICT strategy overview, real-world application focuses on disciplined entries during optimal windows while prioritising capital protection.
Step-by-Step Market Timing Methods with ICT
Follow these structured steps to implement the theory effectively.
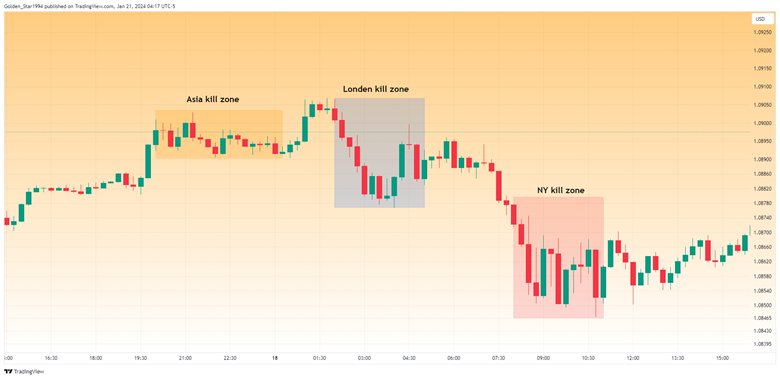
- Mark key sessions and kill zones, such as London (2:00–5:00 AM EST) and New York (7:00–10:00 AM EST).
- Identify higher-timeframe bias on daily or weekly charts to determine overall direction.
- Wait patiently for the correct time window before considering any trade.
- Confirm confluence with market structure, such as a valid break of a trendline or alignment with PD arrays.
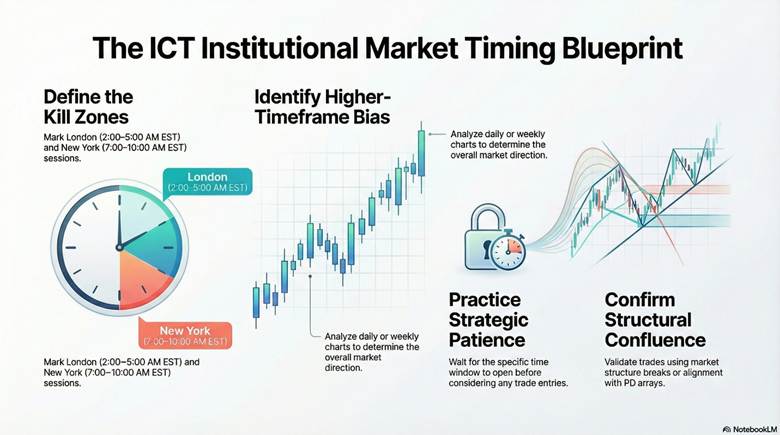
This sequence filters random noise and aligns trades with institutional activity.
Real-World Examples of Time-Driven Price Moves
Time-driven moves appear frequently across pairs.
During the London open, prices often raid the Asian session high or low, creating a false breakout to sweep liquidity.
This manipulation sets up a reversal. In the New York session, true expansion follows as price displaces strongly in the opposite direction, reaching targeted levels.
Another common pattern occurs when the price consolidates in the Asian range. London grabs stops at extremes. New York then delivers directional momentum toward premium or discount arrays.
Trading CFDs and forex involves significant risk of loss. Past price behaviour does not guarantee future results.
Warning:
Entering trades outside high-probability time windows often leads to stop-loss hits, even with correct directional bias.
Common Mistakes Traders Make and How to Avoid Them
Beginners frequently trade during low-volatility Asian sessions, expecting immediate expansion. This leads to frustration asthe price remains range-bound.
Another error ignores higher-timeframe bias, causing counter-trend entries.
Poor risk management, such as oversized positions, compounds losses quickly.
Avoid these by sticking to a checklist: confirm session, bias, time window, and structure before acting. Practice on demo accounts first and journal every trade for review.
Consistent risk rules and patience separate profitable ICT traders from the rest.
| Common Mistake | Why It Happens / Impact | How to Avoid It |
|---|---|---|
| Trading during low-volatility Asian sessions | Beginners expect quick expansion, but the price stays range-bound, leading to frustration and unnecessary losses. | Focus on high-probability windows like London or New York kill zones. Patience preserves capital. |
| Ignoring higher-timeframe bias | Traders enter counter-trend positions based only on lower-timeframe signals. | Always confirm directional bias on daily or weekly charts before taking lower-timeframe entries. |
| Poor risk management (e.g., oversized positions) | Small losses quickly compound and wipe out accounts. | Risk no more than 0.5–1% per trade. Use tools like a position size calculator and set strict stop losses. Practise first on a forex demo account. |
| Lack of journaling and review | Repeated errors go unnoticed, slowing improvement. | Journal every trade, note session, bias, and outcome. Regular review builds discipline and consistency. |
Consistent rules and patience separate successful ICT traders from the rest. Start with a forex demo account to test these habits without risk.
Conclusion
The ICT time and price theory offers a clear edge by sharpening market timing in ICT, helping traders align with institutional flows for higher-probability setups. Begin with consistent practice on a forex demo account to refine skills safely.
No approach removes risk entirely – losses remain possible. Success demands disciplined execution, ongoing learning, and strong risk management. Pair ICT time and price insights with habits like proper position sizing and emotional control. Over time, this combination supports sustainable growth in trading.