Many traders lose not because their analysis is weak, but because their timing becomes predictable to other participants. Markets tend to reward liquidity over opinions, so predictable behaviour can create avoidable costs and poorer entries. If you want cleaner entries and fewer traps, keep reading to learn inducement in trading and how to filter them.
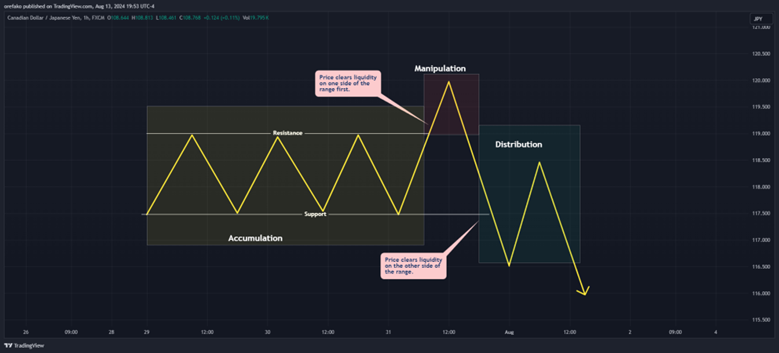
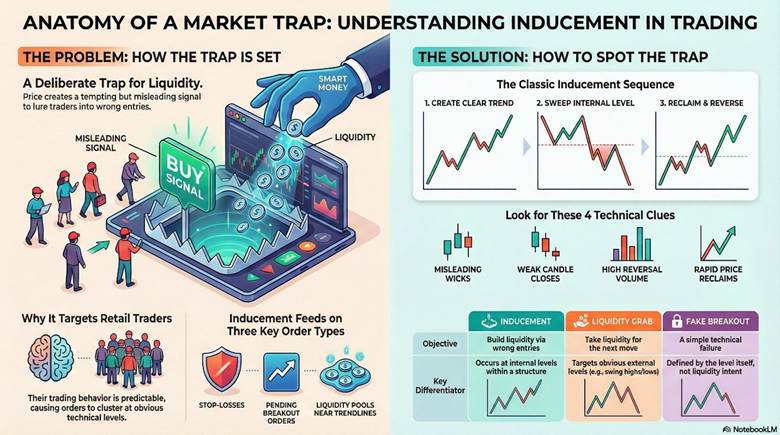
- Inducement in trading is a liquidity-seeking strategy that traps traders by enticing them to enter early or incorrectly.
- Understanding inducements' connection to market structure is crucial to recognising liquidity events, not just price patterns.
- Session context affects the effectiveness of inducement, with more active sessions leading to sharper, faster setups.
- Recognising inducement helps shift your approach from reactive, emotional decisions to a more systematic, disciplined trading strategy.
What Is Inducement in Trading?
Inducement in trading is a price move that tempts traders to make early or incorrect entries by presenting a convincing but misleading signal. In Smart Money Concepts (SMC), it is often explained as a way to gather liquidity so larger orders can execute with less friction.
According to HowToTrade, inducement functions as a trap that pulls retail stop-loss orders into the market’s available liquidity.
Inducement meaning in trading becomes clearer when you identify where orders concentrate, especially around obvious swing highs, swing lows, and tidy technical levels. Because many traders use similar placements, these areas form clusters that the price can reach quickly during a short-term liquidity sweep or probe.
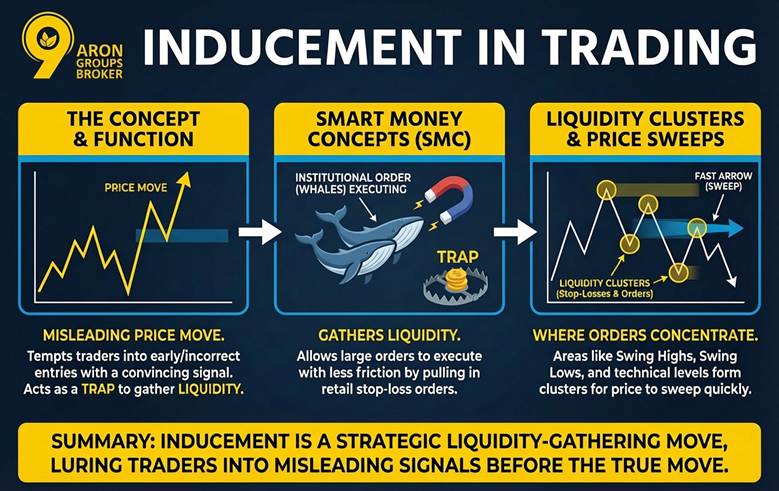
Inducement is defined by its underlying purpose rather than a specific candle shape or pattern seen on a chart. It creates the necessary liquidity required to fuel the next significant move by institutional players.
Why Inducement Targets Retail Liquidity in Trading
Large participants often need deep liquidity to enter or exit without excessive slippage, so they seek areas with abundant resting orders. Retail behaviour is frequently predictable, which causes orders to cluster around obvious technical levels and recent swings.
According to XS, inducement can look like a false move that traps smaller traders and releases liquidity into the market.
The three order sources of inducement often feed on
- Stop-loss clusters near swing highs and swing lows.
- Pending orders around breakouts and “retest” entries.
- Liquidity pools formed by equal highs, equal lows, and clean trendlines.
Q: Does inducement only target stop-losses?
A: No, it can also draw in pending breakout orders and “retest” entries, because both add usable liquidity.
How Inducement Forms on the Chart in Trading: Step-by-Step SMC Explanation
Inducement in trading usually forms within a clear market story, such as a trend continuation or a pullback inside structure. Price often prints a convincing trigger that answers what inducement is for many traders, then invalidates it quickly
A TradingView example illustrates inducement as a trap move that appears before the price continues in the broader direction.
The inducement in trading meaning becomes practical when you focus on where it happens, not just how it looks. In the SMC context, it commonly appears near internal highs or lows where resting liquidity and stop-loss clusters build naturally.
That is why the meaning is closely linked to liquidity, rather than a single candle pattern.
A common inducement sequence on price action
- The market prints a clear directional leg, creating a visible swing and a readable structure for most traders.
- Price pulls back into internal structure, and many traders expect continuation, especially after a clean retracement.
- A brief violation or sweep occurs at an internal level, triggering stops and pulling in breakout or early-reversal entries.
- Price quickly reclaims the level and resumes the larger move, often moving towards an obvious liquidity pool.
Q: Does inducement in trading always involve stops, or can it involve pending orders too?
A: It can involve both, because stop-loss clusters and pending breakout orders often sit together around the same obvious levels.
Analysing Inducement Within Smart Money Market Structure
In SMC context (Smart Money Concepts), inducement in trading is often discussed in relation to market structure trap events, such as breakouts or pullbacks. It commonly forms near internal swing levels, where price temporarily breaks key support or resistance levels before reversing.
Inner Circle Trader explanations describe inducement as a technique to lure traders into early entries, often leading to traps.
Essential SMC Terms Linked to Inducement
- Resting Liquidity: These are queued buy or sell orders waiting at high-probability technical levels to be executed.
- Buy-side Liquidity: This refers to the concentration of buy stop orders and protective buy stops located above previous highs.
- Sell-side Liquidity: This represents the pool of sell stop orders and protective sell stops sitting beneath recent swing lows.
- Order Flow Imbalance: Fast market displacement creates gaps where price must eventually return to fill inefficiently executed orders.
Key Insight:
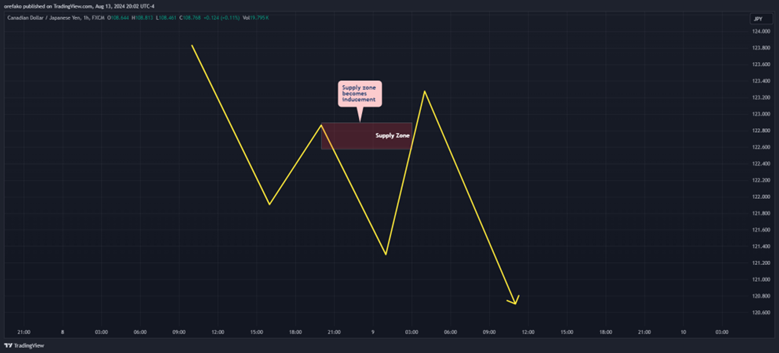
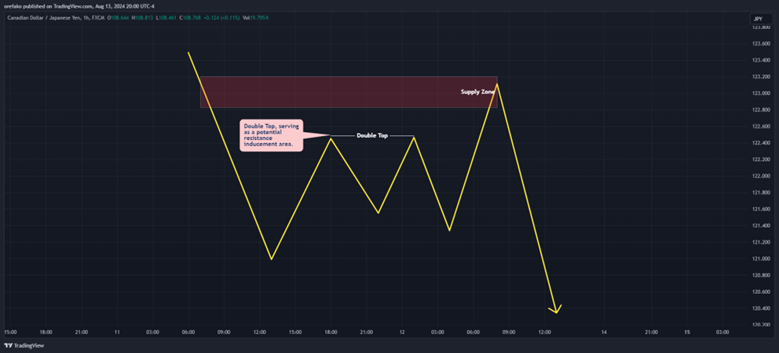
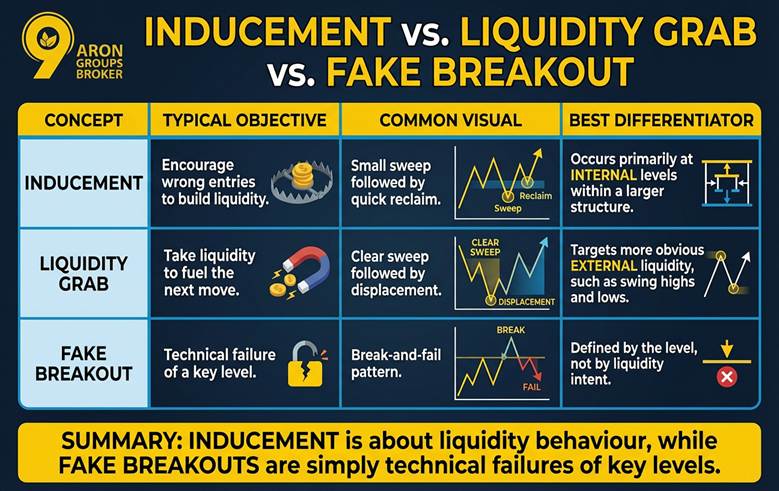
Inducement often forms within internal structure, whereas liquidity grabs typically target external and more obvious levels of resting orders.
Types of Inducement in Trading: Meaning, Patterns, and SMC Examples
When traders search “what is inducement in trading” or “inducement in trading meaning”, they often want a clean way to classify what they see. A practical method is to group inducements in trading by the type of level it exploits, because that is where orders tend to cluster.
The inducement meaning in trading becomes easier to apply when you ask one question: which group is being encouraged to commit here? In an SMC lens, inducement often appears around internal structure where resting liquidity and stop-loss clusters are likely to sit.
If you categorise it consistently, you will reduce over-labelling and avoid treating every failed level as a “setup”.
Supply and Demand Zone Inducement
One common form of inducement in trading appears around supply and demand zones, because many traders place stops and limits there. In this setup, the price briefly pushes beyond the zone boundary to trigger clustered orders, then returns inside the zone quickly. This behaviour supports the inducement in trading, meaning as a liquidity-building move, rather than a genuine breakout continuation.
Support and Resistance Break Inducement
When traders ask what is inducement in trading, support and resistance traps are often the easiest example to visualise. Price breaks a clear level, triggering breakout entries and pending orders, then closes back on the original side with weak follow-through. This is why inducement, meaning in trading, is tied to order placement, not the appearance of one “perfect” candle.
Premature Reversal Inducement
A frequent answer to types of inducement in trading is the early reversal that happens before the price reaches an obvious liquidity target. That early turn invites traders to enter aggressively, placing tight stops close to the recent swing and creating an easy liquidity pocket.
Price may then sweep those stops and only afterwards deliver the move that fits the higher-timeframe direction.
Trendline and Chart-Pattern Inducement
Another version of inducement in trading happens when a neat trendline break or chart pattern looks too clean and widely visible. Because many traders enter on the same trigger, pending orders and stops stack around the same area, creating accessible liquidity.
If price quickly re-enters the prior structure, the move often reflects inducement in trading, meaning more than true trend change.
Session-Open Inducement
Inducement can also appear around major session opens, where volatility spikes and stops are more likely to be triggered in a short burst. In these moments, a fast push can tempt traders into momentum entries, then reverse once liquidity is absorbed and direction stabilises. This is why session context matters when judging what inducement in trading is in live conditions.
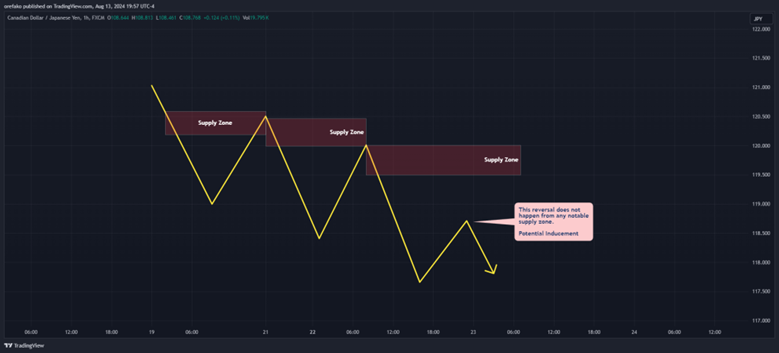
- Do not label every failed level as an inducement, because that removes structure and turns analysis into storytelling.
- Define your market structure rules first, then decide whether the move fits the types of inducement in trading above.
Inducement vs. Liquidity Grab vs. Fake Breakout Explained
While inducements in trading, liquidity grabs, and fake breakouts may appear similar, they serve distinct purposes and behave differently within the market.
Understanding these concepts requires asking, why did price do this?, instead of focusing only on identifying a specific pattern.
Each term represents a different market move, and recognising their nuances is crucial for better trading decisions.
| Concept | Typical Objective | Common Visual | Best Differentiator |
|---|---|---|---|
| Inducement | Encourage wrong entries to build liquidity | Small sweep followed by quick reclaim | Occurs primarily at internal levels within a larger structure |
| Liquidity Grab | Take liquidity to fuel the next move | Clear sweep followed by displacement | Targets more obvious external liquidity, such as swing highs and lows |
| Fake Breakout | Technical failure of a key level | Break-and-fail pattern | Defined by the level, not by liquidity intent |
Key point:
The key difference between inducement and fake breakouts is that inducement is about liquidity behaviour, while fake breakouts are simply technical failures of key levels.
How to Spot Inducement Clues in Your Price Action Analysis
Traders often search for a single candle to confirm inducement, but this narrow approach usually fails in fast-moving markets. You should instead recognise these traps by analysing the broader market context and the immediate reaction at key levels.
Common Technical Signs of Market Inducement
- Misleading Wicks: Price aggressively pierces a structural level but rejects almost immediately, leaving behind a long, deceptive candle shadow.
- Weak Closing Prices: A candle may briefly break a significant level but fails to close beyond it, indicating a lack of momentum.
- Anomalous Volume: High trading volume near a structural break followed by a rapid reversal often suggests institutional participation in a trap.
- Rapid Reclaim: Price quickly moves back inside the original range after a breakout, signalling that the initial move was purely for liquidity.
Beyond the Single Candle
Searching for one “inducement candle” is less effective than watching the specific sequence of a sweep, a reclaim, and a displacement. This chronological flow provides the necessary confirmation that the market has successfully trapped retail participants before shifting direction.
Q: Does a long wick always signify that an inducement has occurred?
A: Not necessarily; you must see the price reclaim the broken level and displace in the opposite direction to confirm the trap.
Step-by-Step Inducement Analysis in a Trend Continuation Setup
In a bullish higher timeframe trend, the market often pulls back to establish a clean and highly visible internal low. This specific structural point attracts retail traders who place their stop-losses just beneath it while anticipating a standard trend continuation.
A brief price dip below this internal low triggers protective sell stops and lures aggressive breakout shorts into the market.
Price then quickly reverses and reclaims the broken level, leaving trapped sellers at a disadvantage as momentum shifts back upward.
Strong displacement follows the reclaim, targeting the buy-side liquidity sitting above previous swing highs to complete the institutional move.
These traps are fundamentally emotional because they are designed to trigger a sense of urgency and false certainty in retail participants.
Key Insight:
The real trap here is emotional, not technical; it is designed to trigger certainty, urgency, and tight stops, leading traders to make hasty decisions.
Master Trading Session Context for Identifying Market Inducement
The context of trading sessions influences how inducements play out. When more participants are active, inducement can result in sharper price sweeps and quicker reclaims. Conversely, during quieter times, price moves can be slower, creating choppy traps. This difference happens because liquidity is more concentrated during active sessions, allowing the price to move decisively.Practical Session Tendencies Many Traders Observe
- London open: Price often runs quickly into liquidity and experiences sharper reversals as major players act on early opportunities.
- New York overlap: This session tends to show more follow-through after displacement, as both the London session and the New York markets are active.
- Asia session: Price often moves within a range, building liquidity, and inducement setups form as price oscillates around key levels.
A setup that works during high-volume sessions may fail during quieter ones due to thin liquidity. This is why time-of-day filters can help improve consistency by avoiding low-participation periods.
Conclusion
A trader’s real job is not to predict the market, but to make high-quality decisions while navigating uncertainty. When you view enticing moves as potential inducement in trading events, you can reduce impulsive entries and improve your timing. Over time, this mindset shifts your approach from reacting to the market to executing a more systematic and disciplined trading strategy.