


Keltner Bands are often misunderstood as simple entry signals, but they are better used as a decision framework. This guide focuses on how to think with the channel, identify conditions, select the right tactic, and manage risk realistically in MT5. The goal is not prediction, but consistency across changing market behaviour.

- Treat Keltner Bands as a volatility framework first; only then choose trend, pullback, or mean-reversion execution.
- A “best setting” is meaningless unless it holds up across different volatility regimes and realistic trading costs.
- Touching a band is context-dependent; confirmation comes from closeness, slope alignment, and structure breaks.
- Use the middle line as a decision zone, not a signal: it separates continuation pullbacks from failed trends.
- Keep risk stable by sizing from stop distance and ATR, so exposure automatically contracts in fast markets.
What are Keltner Bands, and what do they measure exactly?
Keltner Bands (also known as the Keltner Channel) are a volatility-based indicator that plots price within a three-line channel:
- a middle line,
- an upper band,
- and a lower band.
The purpose of this channel is not to predict the future. Rather, it helps you assess how far the price has moved from “normal” market conditions at the current moment.
This indicator measures two key elements at the same time:
- Market direction and slope, using a moving average, most commonly an Exponential Moving Average (EMA).
- Volatility is gauged using the Average True Range (ATR), which indicates whether the channel is wide or narrow, reflecting current market stability or turbulence.
So, the Keltner Bands strategy provides a structured way to see how far price has deviated from its average, and whether that distance is typical or unusually large given the current volatility regime. This can help you make more informed trading decisions with greater confidence.
Keltner Bands Mechanics and Formula
Keltner Bands are a three-line channel built using an Exponential Moving Average (EMA) and the Average True Range (ATR). The middle line represents the average price, while the upper and lower bands show a typical volatility range around it.
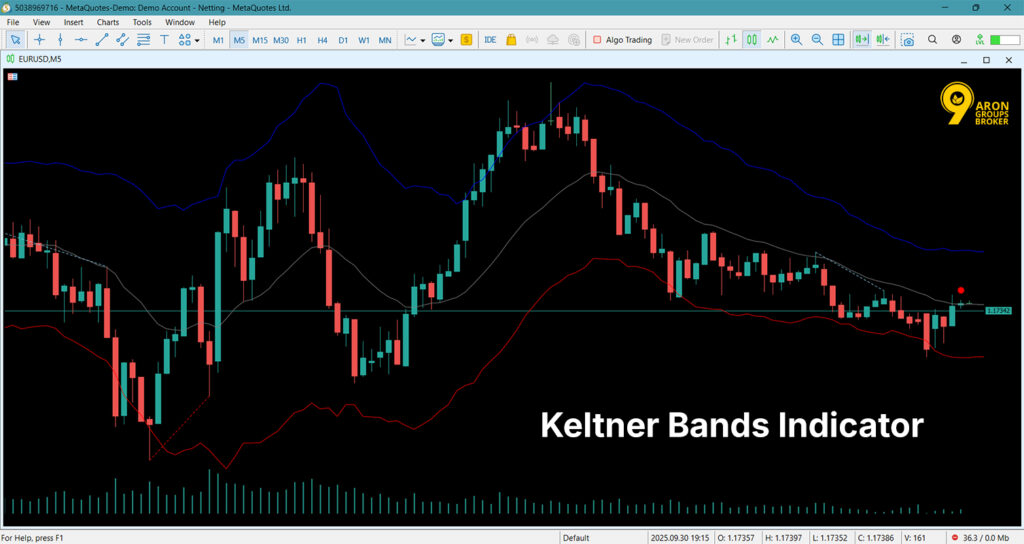
The standard Keltner Bands formula is straightforward:
- Middle Line = EMA
- Upper Band = EMA + (ATR × Multiplier)
- Lower Band = EMA − (ATR × Multiplier)
The EMA Middle Line: Direction and Averaging
The EMA is a moving average that places greater weight on recent prices. As a result, the middle line in Keltner Bands typically responds more quickly to price changes than an SMA.
In practice, the EMA middle line serves two clear purposes:
- Trend direction: The slope of the EMA helps you judge whether the market is broadly rising or falling.
- Distance from the mean: the gap between price and the EMA shows how far the current move has stretched away from its average level.
It is important to note that the EMA on its own is not a “definitive signal”. It is a clean reference point for structured decision-making.
Upper and Lower Bands with the ATR Multiplier
The ATR is a volatility measure and determines how wide or narrow the Keltner Channel becomes. When ATR rises, the bands move farther from the EMA, and the channel widens. When ATR falls, the bands move closer, and the channel becomes tighter.
This is where the ATR Multiplier acts as the main sensitivity control:
- Larger multiplier → a wider channel, fewer band touches, and stronger volatility filtering.
- Smaller multiplier → a narrower channel, more signals, but also more noise and false triggers.
A common default configuration is EMA (20 period) with ATR (multiplier 2). However, the most appropriate settings should be aligned with your timeframe, the instrument you trade, and your execution costs.
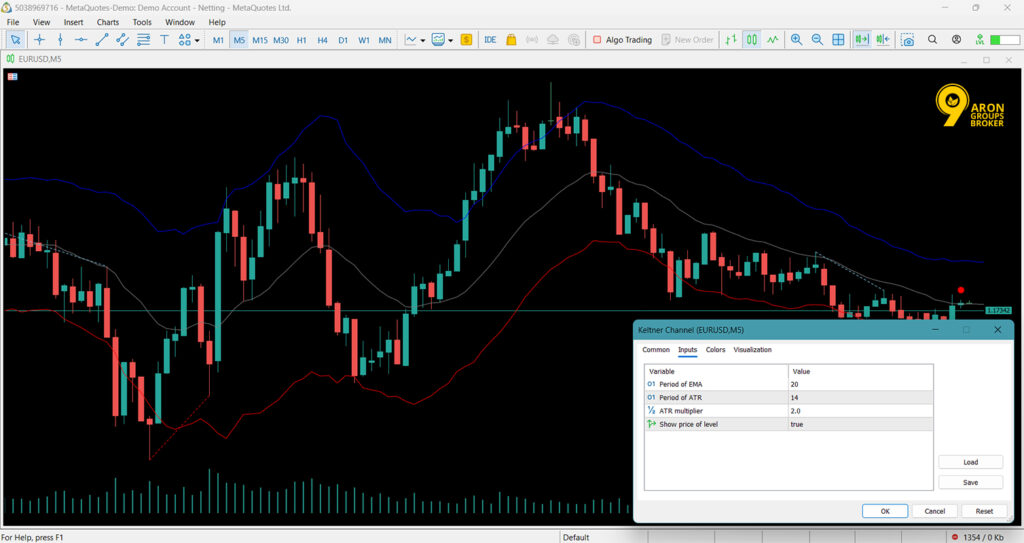
How to Install and Add the Keltner Bands Indicator in MT5
Keltner Bands are available inside MT5, so you typically do not need to download anything. You can add the indicator from the main menu in under a minute.
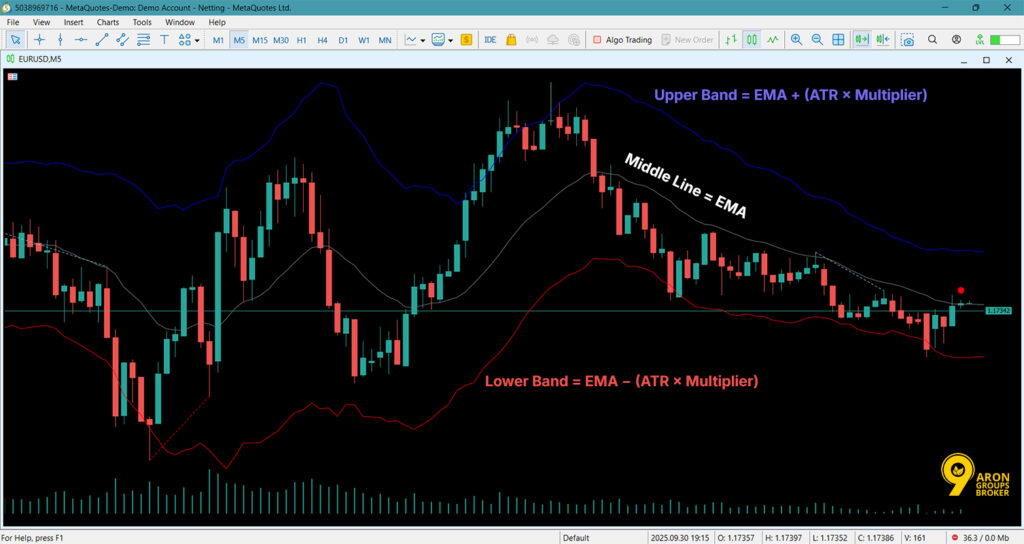
- Open MetaTrader 5 and load any chart.
- Click Insert in the top menu.
- Go to Indicators → Custom.
- Find the Keltner Channel and select it.
- Click OK to apply it to the chart.
After you add it, review the inputs before trading.
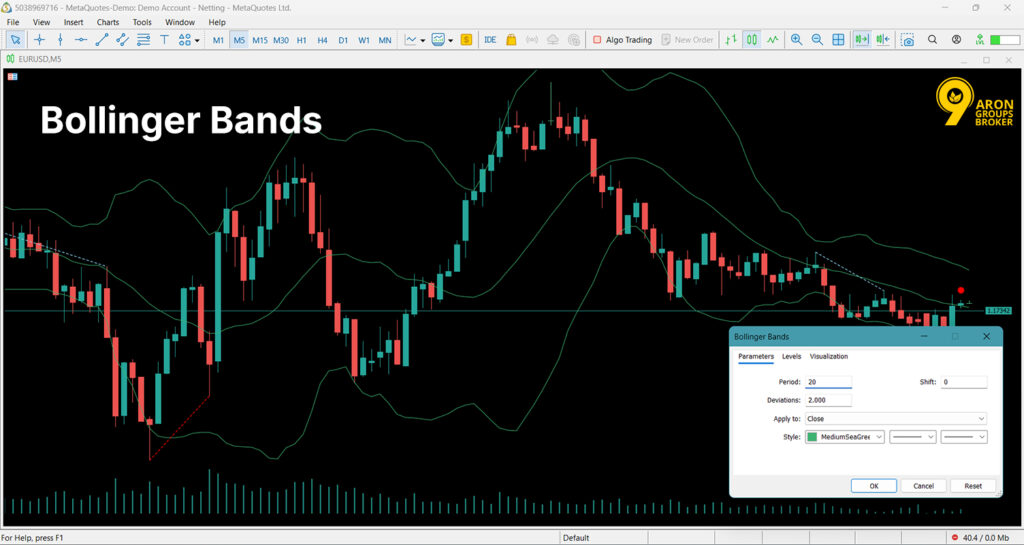
Keltner Bands Indicator Settings in MT5
In Metatrader 5, you can summarise the Keltner Bands indicator settings into two simple areas:
- The middle-line settings, which are based on a moving average (MA, typically EMA).
- The channel width settings are built using the Average True Range (ATR).
If you align these two elements correctly, the Keltner Channel will match your timeframe and the instrument’s volatility, and the signals will be more meaningful.
MA Period and MA Type: EMA vs SMA and the impact on signal lag
MA Period defines how many candles are used to calculate the moving average. A larger period produces a smoother middle line, but it reacts more slowly to price changes. This slower response can create noticeable signal lag.
MA Type specifies the moving average method, most commonly EMA or SMA. In Keltner Bands, EMA is more widely used because it responds faster to recent price action.
A simple selection guide:
- If you want faster responses and more timely entries, EMA is usually the better choice.
- If your priority is reducing noise and filtering signals, SMA may behave more steadily.
ATR Period and ATR Multiplier: Adjusting the Keltner channel’s sensitivity to volatility
ATR Period determines how many candles are used to calculate ATR. A higher period smooths the volatility reading, but the channel adapts more slowly to new market conditions.
ATR Multiplier sets how far the upper and lower bands sit from the middle line. A larger multiplier creates a wider channel, so price touches the bands less often. This typically means stronger filtering, but fewer signals.
A common reference setting in educational materials is: EMA 20 with bands set at 2×ATR.
Suggested settings for Forex, Gold, and Crypto (Period/Multiplier)
There is no single “best” configuration for every market condition. However, these are practical starting points you can test:
- Forex (general): EMA 20 / ATR 14 / Multiplier 2
- Gold (XAUUSD): EMA 20 / ATR 14 / Multiplier 2 to 2.5
- Crypto (high volatility): EMA 20 / ATR 14 / Multiplier 2.5 to 3

The logic is straightforward:
The more inherently volatile the market, the wider the channel typically needs to be, so that normal noise is not mistaken for a meaningful move.
Reading Signals with Keltner Bands: From Market Conditions to a Trade Trigger
To use Keltner Bands correctly, separate the process into two steps: First, identify the market conditions; then, look for a clear entry or exit trigger.
Identifying Market State via Channel Slope: Trend, Range, and Regime Shift
The simplest filter for market state is the slope of the middle line and the channel’s overall direction. If the middle line and the channel are rising, you are likely in a bullish phase. If they are falling, bearish pressure is dominant.
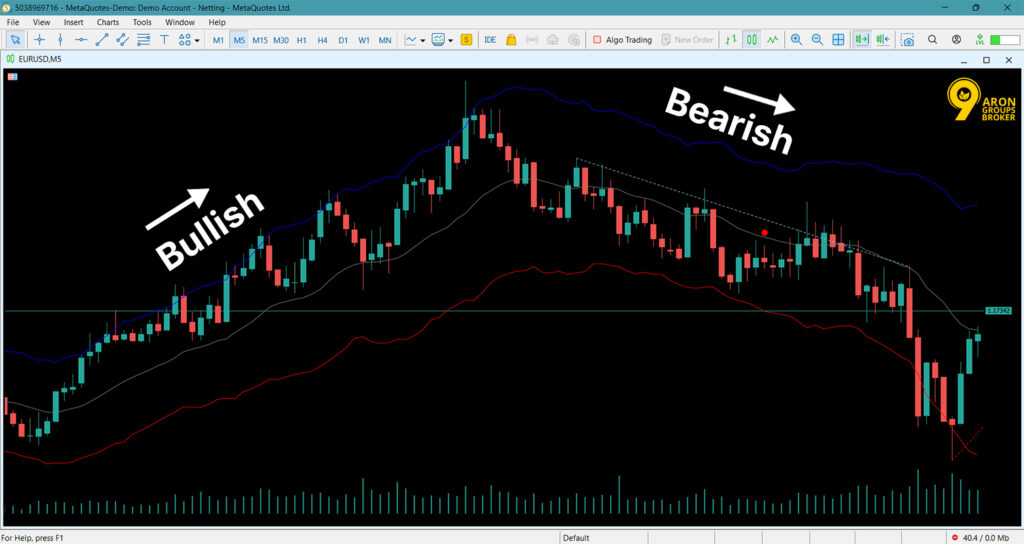
However, do not rely on slope alone to identify a range. In ranging conditions, the slope is often weak, and the channel becomes narrower. This contraction typically occurs when ATR declines.
Practical signs for each phase using Keltner Bands:
- Trend: a clear slope, with price often “leaning” towards one side of the channel and travelling near that band.
- Range: a shallow slope, a tighter channel, and frequent back-and-forth movement between the upper and lower bands.
- Regime shift: the channel changes from near-flat to clearly sloped, or the channel width expands sharply, usually signalling that volatility conditions are changing.
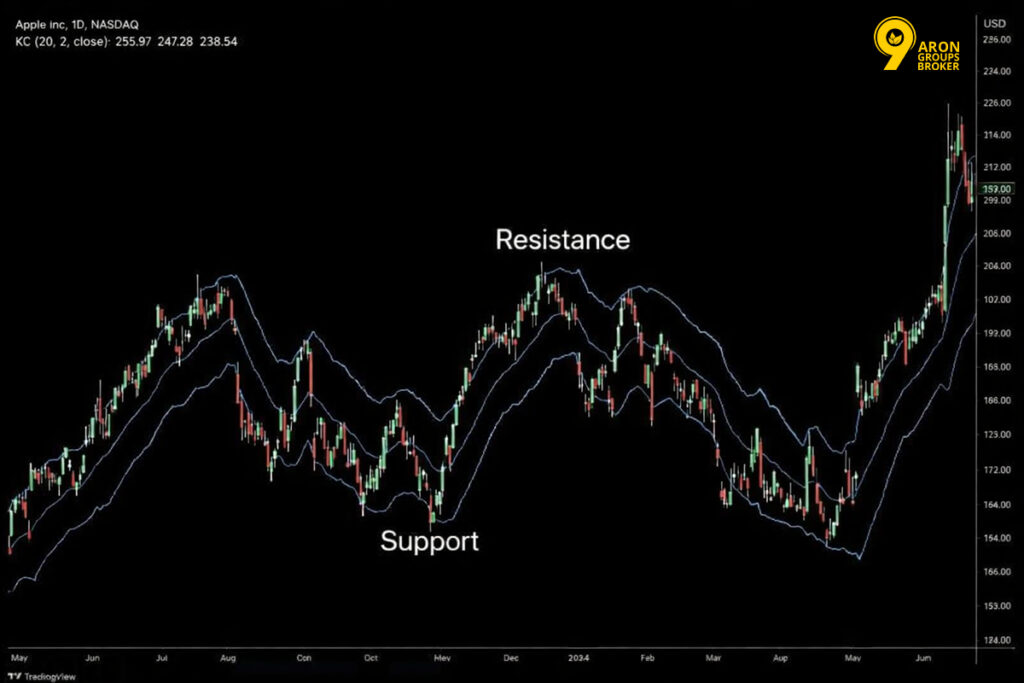
Dynamic Support and Resistance with Keltner: Planning Entries and Exits
Within the Keltner Channel, the bands can act as dynamic support and resistance. “Dynamic” means these levels are not fixed; they adjust up and down as volatility changes.
Practical applications for trade planning:
- In an uptrend, the EMA middle line often serves as a pullback area: price approaches it, then resumes the trend.
- In a downtrend, the same middle line can act as a temporary rebound area: the price reaches it, then turns lower again.
In a range, the upper band often behaves like resistance and the lower band like support. Rather than guessing, you can structure entry and exit scenarios around movement between the two bands.
A Common Mistake: Why a Band Touch Is Not a Signal by Itself
A frequent error is assuming: “Price touched the upper band, so I should sell”, or “price touched the lower band, so I should buy.” This is risky in strong trends because the price can remain near one band for extended periods.
A band touch is not sufficient because Keltner Bands measure a typical volatility range, not a guaranteed reversal point. A touch, or even a brief break, can simply reflect trend strength or acceleration, not a turning point.
Practical rule:
Do not treat Keltner Bands as a standalone signal. Use it with a price structure (support/resistance, swing highs/lows) or a clear confirmation filter.
Core Keltner Bands Trading Strategies
As explained in Chartschool, there are four widely used approaches to Keltner Bands. Each follows the same two-step logic: first, define the market conditions, then apply a clear entry or exit trigger.
Trend-Following Strategy: “Hug the Band” and Trading with the Dominant Direction
“Hug the Band” refers to a strong trend in which price spends extended periods near one band. In an uptrend, price tends to hold near the upper band; in a downtrend, it tends to hold near the lower band.
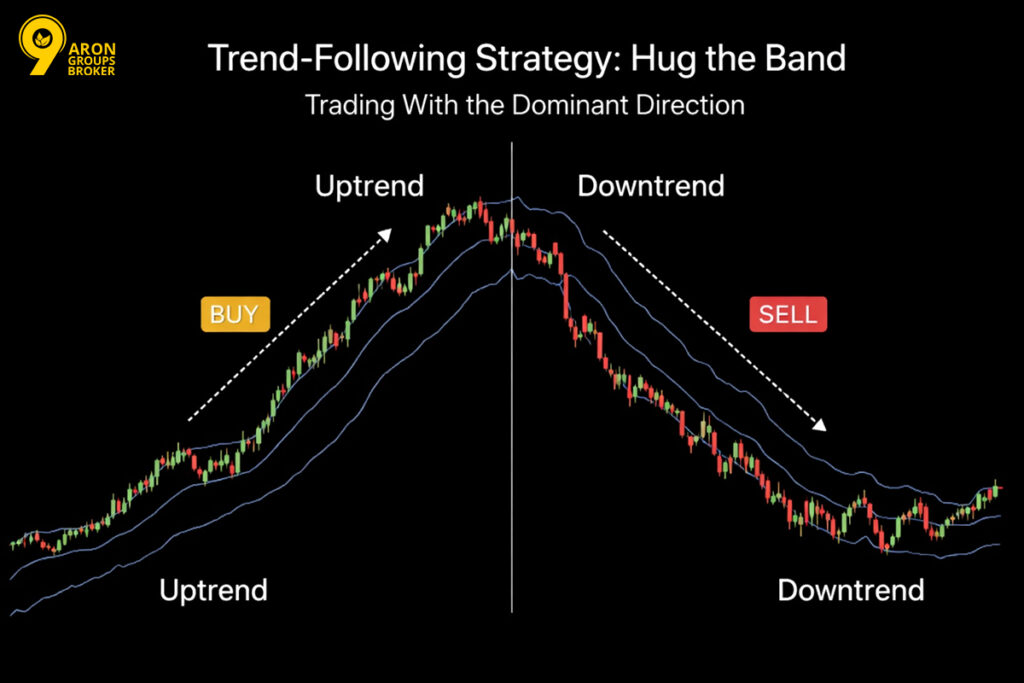
Market conditions
- The channel slope is clear, and all three lines move in the same direction.
- The channel is not flat and compressed, which would typically indicate a sluggish, range-bound market.
Trade trigger
- Bullish: candles close near the upper band, with the EMA middle line sloping upwards.
- Bearish: candles close near the lower band, with the middle line sloping downwards.
Trade management
- Place the stop-loss behind the price structure (e.g., swings), not just behind the band.
- A conservative exit is a cross-back through the middle line. A more aggressive exit targets the opposite band.
Pullback Strategy: Entries from the Middle Line in Healthy Trends
This approach is useful when a trend is intact, but the price pauses for a short correction. In that case, the EMA middle line often acts as a practical pullback zone.
Market conditions
- The channel slope is established, and the trend has not been invalidated.
- Price pulls back to the middle line without breaking the underlying structure (swing highs/lows).
Trade trigger
- Bullish: a constructive reaction around the middle line, followed by a move back towards the upper band.
- Bearish: rejection around the middle line, followed by a move back towards the lower band.
Practical note
If the channel widens sharply during the pullback, be cautious. Rapid expansion typically signals rising volatility and a higher risk of false moves.
Mean Reversion Strategy: Band Break and Re-Entry into the Channel
Mean reversion assumes that after an excessive move, the price tends to return towards its typical range. In the Keltner Channel, the key sign is a move outside the band followed by a return inside the channel.
Market conditions
- The channel slope is weak, or the channel is close to flat.
- The market is more range-like than trend-driven.
Trade trigger
- Price moves outside a band, then closes back inside the channel.
- This re-entry suggests the push beyond the channel was not sustained.
Targets and exits
- The first target is often the EMA middle line.
- If momentum is weak, scaling out in stages is usually more sensible than holding for an extended target.
Keltner Channel Breakout Strategy: When Is a Breakout “Valid”?
A valid breakout often starts from a low-volatility phase. The channel remains flat and tight for a period, then the price breaks out of it.
Market conditions
- The channel is fairly horizontal, and ATR has declined.
- ATR then rises, and the channel begins to expand.
Breakout trigger
- A clear close outside the band, not merely a brief wick.
- Ideally, the breakout aligns with price structure, such as a break of range highs or lows.
Confirmation and risk management
- Weak breakouts often revert quickly back into the channel.
- Place the stop-loss where a return into the channel would invalidate the breakout thesis.
Risk reminder:
No Keltner Bands strategy is guaranteed. Test on a demo account first and use a consistent stop-loss on every trade.
Keltner Channel Scalping Strategy: An Execution Framework for Lower Timeframes
Scalping with the Keltner Channel means capturing short price moves with fast decisions and precise exits. On lower timeframes such as M1 and M5, market noise is higher and execution costs have a larger impact on outcomes.
As a result, you typically need a faster channel while using a few simple filters to reduce false signals.
Faster Keltner Channel settings for scalping
In scalping, the goal is not “more signals”. The goal is for the Keltner Channel to track near-term volatility more effectively and avoid reacting too slowly.
What do we adjust?
- Shorten the EMA period to make the middle line respond more quickly to shifts in market conditions.
- Reduce the ATR multiplier slightly to narrow the channel and shift band interactions earlier.
Two practical starting presets to test:
- Conservative Keltner Channel scalping: EMA 20 / ATR 10 / Multiplier 2
This is a standard, reliable baseline, but it may feel slow on M1. - Faster Keltner Channel scalping: EMA 10-14 / ATR 10-14 / Multiplier 1.2-1.6
The channel reacts faster, but noise and false touches increase as well.
A quick tuning rule
- If touches become frequent and low-quality, increase the multiplier slightly.
- If the channel reacts too slowly, reduce the EMA period by one step.
Keltner Channel price action filters for scalping
Scalping without a price action filter often turns into “more trades, lower quality”. The filters below are simple and do not require additional indicators.
Filter 1: Align with the Keltner Channel slope
- Only take longs when the middle line slope is rising.
- Only take shorts when the middle line slope is falling.
Filter 2: Pullback to the Keltner Channel middle line
- In an uptrend, wait for the price to pull back towards the middle line and show a constructive response.
- In a downtrend, wait for the price to test the middle line and reject it.
Filter 3: A real break, not just a wick
For band-based entries, a close matters more than a brief wick. On lower timeframes, fast wicks are common and can be misleading.
Keltner Channel execution: Managing spread, slippage, and high-risk market hours
In scalping, costs can neutralise your entire edge. If spread and slippage are high, even a good setup can be executed poorly.
Three execution rules:
- If the spread is large relative to your target, that instrument is not suitable for scalping.
- Around major news releases, prices can jump, and slippage typically increases.
- During low-liquidity hours, breakouts are more likely to be “fake,” and reversals are more frequent.
Q: When are MT5 alerts worth using?
A: Alerts are worthwhile when your rule is fully mechanical, such as “a candle closes outside the band” or “price re-enters the channel”.
In MT5, you can enable alerts and push notifications. This can help scalpers because reaction time is limited.
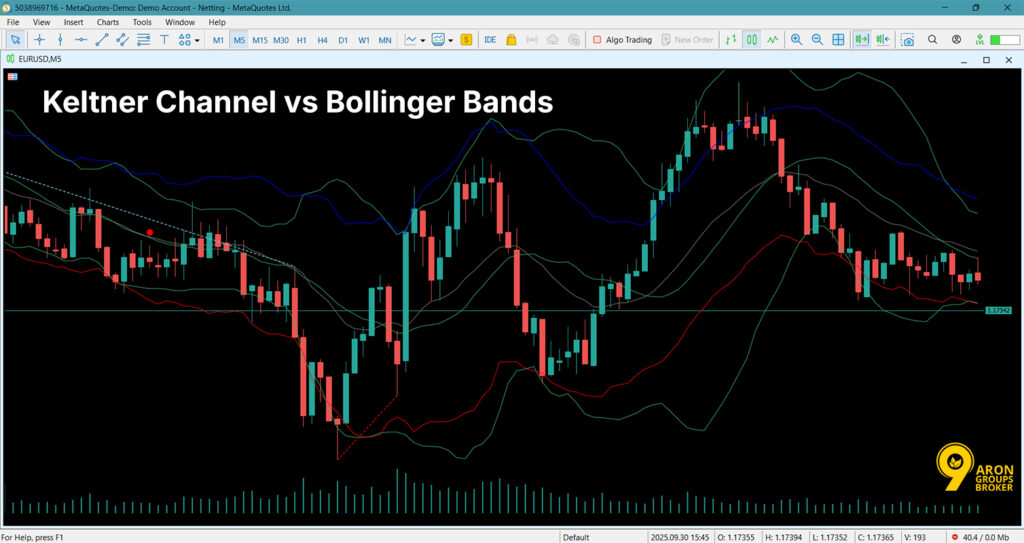
Keltner Channel vs Bollinger Bands
Both the Keltner Channel and Bollinger Bands are volatility channels, but they are built on different calculations. That difference is exactly why their on-chart behaviour and signal characteristics differ.
ATR in the Keltner Channel vs Standard Deviation in Bollinger Bands
In the Keltner Channel, the channel width is derived from ATR. ATR measures volatility based on the range of price movement and typically changes in a smoother, more stable way.
In Bollinger Bands, the width is determined by standard deviation. Standard deviation is sensitive to how widely prices disperse around the average, so it often reacts faster to short-lived spikes.
What does this mean in practice?
- Bollinger Bands tend to expand and contract more quickly during shocks and brief price spikes.
- The Keltner Channel usually produces a smoother envelope and often generates less noise when you are reading trend conditions.
When does the Keltner Channel perform better, and when are Bollinger Bands more useful?
The Keltner Channel often performs better when your focus is on trend reading and clean pullbacks. Because it is smoother, it can be more practical for identifying a trend phase and following it with fewer false cues.
Bollinger Bands are often more useful when your focus is on volatility intensity and contraction/expansion behaviour. Because the width is driven by standard deviation, they tend to display squeezes and volatility changes more clearly.
A simple way to choose:
- If your strategy is primarily trend-following with pullbacks toward the average, start with the Keltner Channel.
- If you want to analyse relative volatility and build setups around squeezes, Bollinger Bands are usually clearer.
A common mistake: Applying identical entry rules to the Keltner Channel and Bollinger Bands
A frequent error is applying the same fixed rule to both tools.
For example: “sell when price hits the upper band” or “buy when price hits the lower band”.
Why is this risky?
- The two channels widen and narrow for different reasons, so a “band touch” does not carry the same meaning in both cases.
- In strong trends, price may remain near a band for an extended period, which can indicate trend strength rather than a reversal point.
A practical rule:
- Define rules based on the behaviour of the specific tool you are using.
- With both indicators, prioritise the close, the average slope, and the price structure rather than relying solely on band contact.
What Is a Bollinger Band Keltner Channel Squeeze, and Why Does It Matter?
A Bollinger Band Keltner Channel Squeeze is a low-volatility condition on the chart. In this phase, the market is effectively “building pressure”, and price swings become tight and compressed.
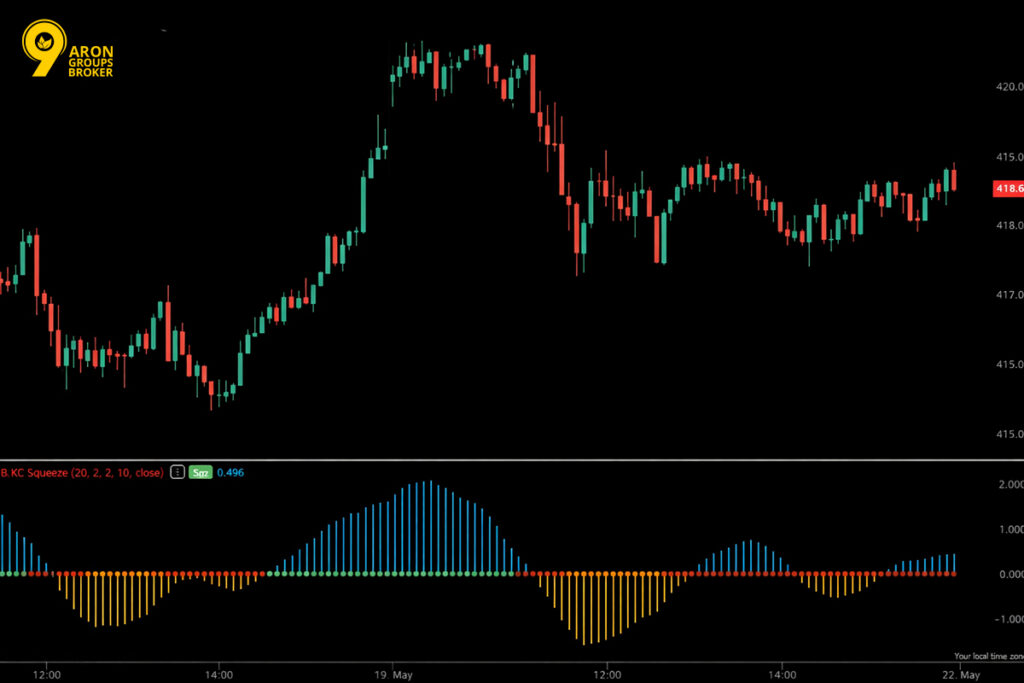
The value of a squeeze is that it signals the market may be preparing for a larger move. However, it does not guarantee the direction of that move. A squeeze is best treated as a warning that volatility expansion may be near, not as a definitive entry signal.
Price Action Squeeze: Volatility Compression and the Expectation of a Larger Move
A price action squeeze means candles trade within a smaller-than-usual range. Highs and lows converge, and the daily trading range narrows. In practical terms, this reflects a temporary balance between buyers and sellers. When one side gains control, the price often starts moving faster.
Important point:
A “larger move” does not always mean a new trend. Sometimes it is only a brief breakout followed by a reversal.
Bollinger Bands Inside the Keltner Channel: A Practical Definition of the Squeeze
The practical definition is straightforward: when Bollinger Bands sit inside the Keltner Channel, the market is in a low-volatility phase.
Bollinger Bands typically tighten and widen more quickly in response to short-term changes. The Keltner Channel is usually smoother and provides a more stable volatility envelope.
So, when Bollinger Bands become even tighter than the Keltner Channel, it is strong evidence that volatility has genuinely compressed. That is why many traders watch this zone for a potential breakout.
Exiting the Squeeze: Confirm the Breakout with Price Structure
A common mistake is entering immediately when a squeeze appears. A squeeze only tells you that “conditions are set”, not that “now is the moment to enter”.
To trade the exit from a squeeze, look for confirmations such as:
- A clear close outside the range, not just a brief wick.
- A break of a structural high or low formed during the compression phase.
- No rapid return into the range over the next few candles.
A simple rule:
If the breakout reverses and closes back inside the range, treat it as a weak break. In squeeze scenarios, breakout quality matters more than trade frequency.
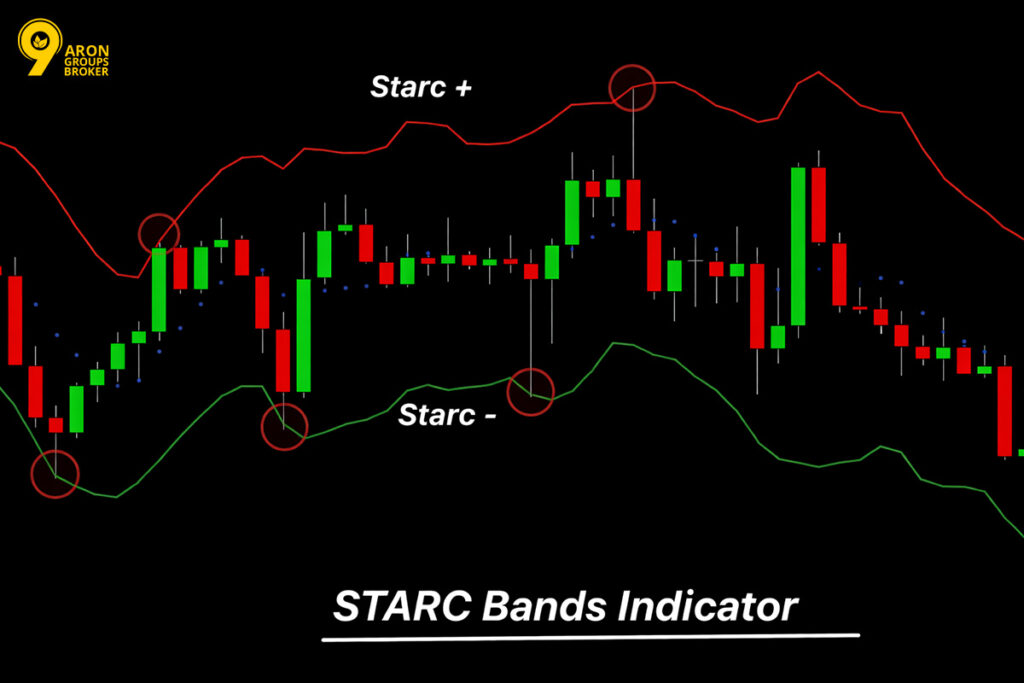
STARC Bands vs Keltner Channels: Choosing a Tool for Mean Reversion
If your goal is mean reversion, you aim to trade price returning towards its average level. Tool choice matters because different bands respond to volatility differently.
STARC Bands and Keltner Channels are both volatility bands, but they do not behave identically. Before defining entries and exits, understand how each band is calculated and how it reacts to them.
Computational Differences and Band Behaviour: STARC vs Keltner Channels
Keltner Channels are typically built around a moving average, often an EMA. The upper and lower bands are placed using ATR, which measures the typical trading range.
STARC Bands also use a middle moving average line, usually a simple moving average. Their outer bands are set at a chosen multiple of ATR above and below that average. In practice, STARC is often used as a “price extreme” framework.
When the price reaches an outer band, it flags potential overextension from the average. That does not confirm reversal, but it highlights stretched conditions.
Key distinction:
Both tools are volatility-based, but their typical use differs. Keltner Channels are commonly used for trend reading and pullback structure. STARC Bands are more often used to judge whether the price is unusually far from the mean.
When STARC Bands Are Better Suited to Mean Reversion
STARC tends to be more useful when you are looking for overextension, not trend continuation. You are trying to identify points where price has moved too far, too fast, from its average. Those conditions often precede a snap-back towards the midline.
STARC is usually more appropriate in these scenarios:
- Range-bound or semi-range markets, where reversals happen repeatedly.
- Sharp moves that fade quickly, rather than trending in one direction.
- Strategies that target a return to the middle line, not breakout continuation.
Put simply, if “touching an outer band” is your first alert for a reversal setup, STARC can look clearer. However, it remains a necessary condition, not a sufficient signal. You still need a trigger, such as a close back inside or a structural reversal.
How to Choose Between STARC and Keltner Channels?
Ask three questions before you decide.
Q1: What is your timeframe?
A1: Lower timeframes contain more noise and microstructure distortion. A smoother tool, such as Keltner Channels, is often easier to interpret. Higher timeframes can make STARC’s “extreme zones” more meaningful and less random.
Q2: What is your exact objective?
A2: If you want trend phase clarity, pullbacks, and continuation structure, choose Keltner Channels. If you want to spot overextension and trade faster mean reversion, consider STARC Bands.
Q3: What does your market typically do?
A3: In persistent trends, STARC can pull you into counter-trend trades too early. In range-driven, mean-reverting markets, STARC can be more reliable for extreme events. Keltner Channels can still support mean reversion, but often with a trend filter.
A practical rule:
Match the tool to market behaviour, not preference. Backtest both on the same asset and timeframe, using identical risk rules. Choose the one that marks “true extremes” more consistently for your method.
Trading CFDs involves the risk of loss of capital. Consider whether you understand how CFDs work.
Risk Management When Trading with Keltner Bands
With Keltner Bands, a “signal” is only the starting point. Your trade outcome is shaped by three decisions: stop loss, take profit, and position size.
Your priority should be risk management, not chasing every move.
Stop loss in Keltner Bands: Outside the band, or behind the price structure?
There are two common ways to place a stop loss. The right choice depends on the trade scenario, not personal preference.
1) Stop loss behind price structure
This approach is usually more robust across most strategies. “Structure” means beyond the latest swing high or swing low. It can also mean behind a key support or resistance level. It may also refer to a broken level that should now hold.
- In trend following, place the stop behind the most recent pullback low.
- In a pullback strategy, the pullback low is often the invalidation point.
- Benefit: you are less likely to be stopped out by band noise.
2) Stop loss outside the band
This works when the band itself defines the boundary of your scenario. You are saying: “If price holds outside the band, my idea is wrong.”
- In mean reversion, a renewed close outside the band can invalidate the re-entry thesis.
- In that case, the stop can sit slightly beyond the band and past the trigger candle.
- Drawback: In high volatility, random spikes can hit the stop more often.
Simple rule:
If your analysis is structure-based, your stop should sit behind the structure.
If your analysis is channel re-entry based, your stop can sit outside the channel.
Take profit in Keltner Bands: Target the opposite band, or scale out?
Your take-profit plan must align with your strategy. A good target is executable, not just attractive on paper.
1) Targeting the opposite band
This is common in channel-based moves and mean reversion setups.
- In mean reversion, the first target is often the EMA middle line.
- A second target can be the opposite band if momentum remains supportive.
2) Scaling out (partial exits)
This often works better in volatile markets and fragile trends. It reduces regret and improves consistency when reversals are frequent.
- Take partial profit near the middle line or near a band.
- Hold the remainder with a trailing exit behind the structure or behind the middle line.
- Benefit: you lock profit while still participating in a larger move.
Execution note:
If your risk-to-reward is below 1:1, the trade often lacks a margin of safety. Focus on setup quality, not trade frequency.
Position sizing with ATR: Keep risk constant as volatility changes
The biggest mistake is trading the same size when volatility rises. ATR helps you keep risk stable when markets become more aggressive.
The logic is straightforward:
- When ATR increases, stop distances usually need to widen.
- Therefore, position size must decrease to keep risk constant.
A practical framework:
- Define a fixed risk amount, such as 1% of equity per trade.
- Set your stop distance using a structure or an ATR-based measure.
- Adjust position size so the loss at the stop equals that fixed risk.
Conclusion
Keltner Bands work best when they shape your decisions, not when they replace them. Used correctly, the channel helps you adapt to volatility, choose the right execution style, and avoid forcing trades. If your rules remain simple, testable, and cost-aware, Keltner Bands can stay useful long after market conditions change.


