


Market cycles are the key to understanding shifts in financial markets. They help traders efficiently identify phases such as accumulation, markup (uptrend), distribution, and markdown (downtrend).
In this article, you’ll learn what a market cycle is and how to use a blend of market sentiment analysis and technical indicators to anticipate the next leg of price action and optimize your trading strategy.
If that’s what you’re after, stick with me to the end.

- The market cycle consists of four primary phases: accumulation, markup, distribution, and markdown; and recognizing them helps traders make better decisions.
- Indicators such as the VIX are highly useful for analyzing market sentiment and anticipating phase shifts.
- It’s best to use price action, volume, and moving averages to pinpoint where the market sits within the four phases before entering a trade.
What Is the Market Cycle and Why Does It Matter?
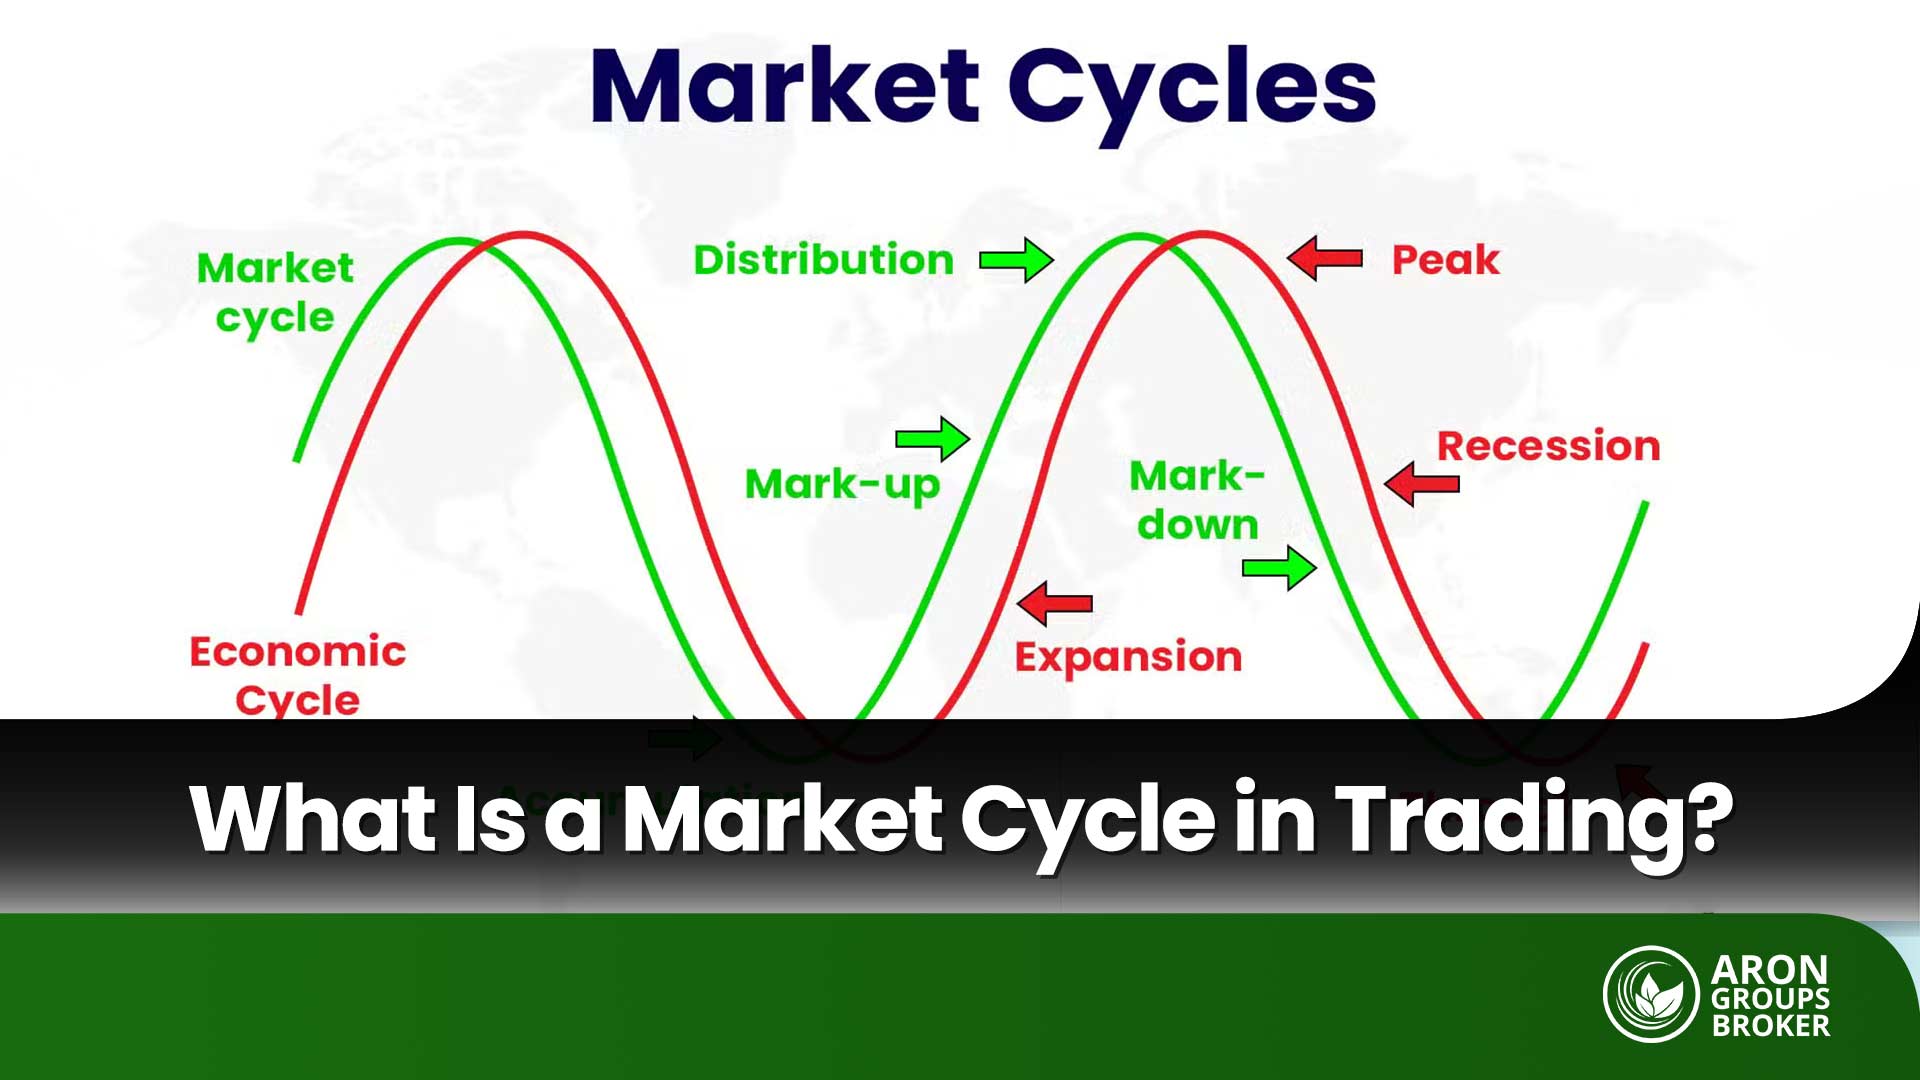
A market cycle is a recurring pattern of price behavior and collective market sentiment that appears across all asset classes and on multiple timeframes. A complete cycle typically includes four stages: Accumulation, Mark-Up, Distribution, and Mark-Down.
The concept rests on two pillars:
- the psychological cycle of investors—including fear, greed, hope, and capitulation which drives order flow and the balance of supply and demand; and
- the rhythm of the economy and monetary policy, which provides the fundamental backdrop for market volatility.
Put simply, the market cycle recognizes an enduring truth: after every peak comes a decline. Prices oscillate as markets transition between periods of buying pressure and selling pressure. Understanding where we are in this cycle helps traders align strategy, risk, and timing with the prevailing phase.
Why is it important to understand the market cycle?
Understanding the market cycle helps traders see the bigger picture of price trajectory and tailor their strategy to each phase. If you recognize the market is likely in consolidation/accumulation, scaling in with a structural stop-loss makes more sense than chasing short-lived spikes. Around overbought extremes, adopting a defensive stance (such as reducing position size or tightening entry criteria) improves the odds of protecting open profits.
Put simply, the market cycle is a framework that tells you where the market is on its path and how to align your actions with that phase.
Difference Between the Market Cycle and the Business Cycle
According to WallStreetMojo, the market cycle and the business cycle are related but distinct concepts. The market cycle refers to price behavior and market psychology, typically described in four stages (Accumulation, Mark-Up, Distribution, and Mark-Down) a classification rooted in the Wyckoff method and widely used in technical analysis.
By contrast, the business cycle describes fluctuations in aggregate economic activity through the phases of expansion, peak, recession/contraction, and trough.
Market cycles are shaped primarily by trader/investor sentiment and liquidity flows, and they often lead the business cycle. Tools such as price action, technical indicators, and volume analysis are commonly used to analyze market cycles.
The business cycle is driven more by changes in fiscal and monetary policy, aggregate demand and supply, and interest rates, and typically lags market turning points. Analysts assess the business cycle using macroeconomic data such as GDP, unemployment, and production indexes.
| Feature | Market Cycle | Business Cycle |
|---|---|---|
| Domain | Price behavior and market psychology in financial markets | Fluctuations in macroeconomic indicators (GDP, employment, inflation) |
| Phases | Accumulation, Mark-Up, Distribution, Mark-Down | Expansion, Peak, Recession/Contraction, Trough |
| Lead–Lag | Often leading (not always) | More reactive, typically lags market turning points |
| Drivers | Liquidity flows, sentiment, news shocks, monetary policy | Government fiscal policy, aggregate demand/supply, interest rates |
| Measurement Tools | Price action, momentum indicators, volume | GDP, unemployment rate, CPI/PPI, PMI |
| Use Case | Short- to medium-term trading decisions | Assessing macro cycles and long-term policy/investment decisions |
Key Drivers of Market Cycles
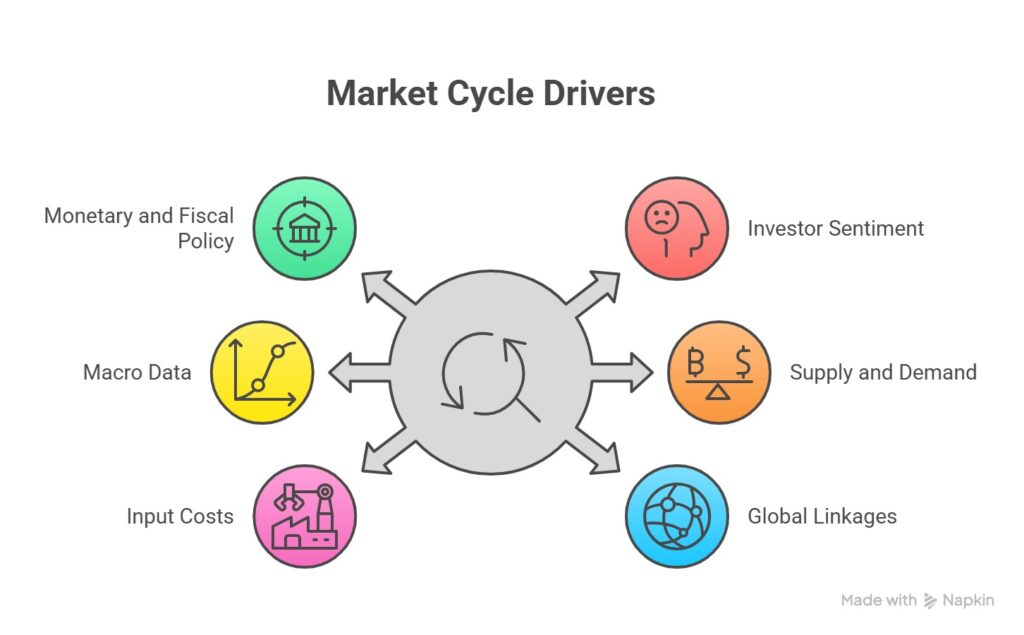
Market cycles are shaped by several core forces that can spark or extend bullish and bearish phases. The key drivers include:
- Monetary and fiscal policy: Central-bank monetary policy (e.g., interest rates, balance-sheet actions) and government fiscal policy (e.g., taxation, spending) can reset the cadence of cycles.
- Investor sentiment and positioning: Fear and greed (captured in sentiment and positioning) act as powerful short-term catalysts for price swings.
- Macro data and news flow: Releases such as GDP, unemployment, inflation (CPI/PPI), and PMI shape expectations about the economy’s phase and steer market narrative.
- Industry and commodity-level supply–demand: Shifts in supply and demand (especially in commodities) often produce longer-dated cycles due to slower capacity and inventory adjustments.
- Input costs and cost shocks: Movements in raw-material prices and broader cost shocks affect corporate margins and inflation expectations, feeding back into market cycles.
- Global linkages and FX spillovers: Interconnected global markets and currency moves can synchronize cycles across asset classes and regions through capital flows and trade channels.
Core Stages of Market Cycles
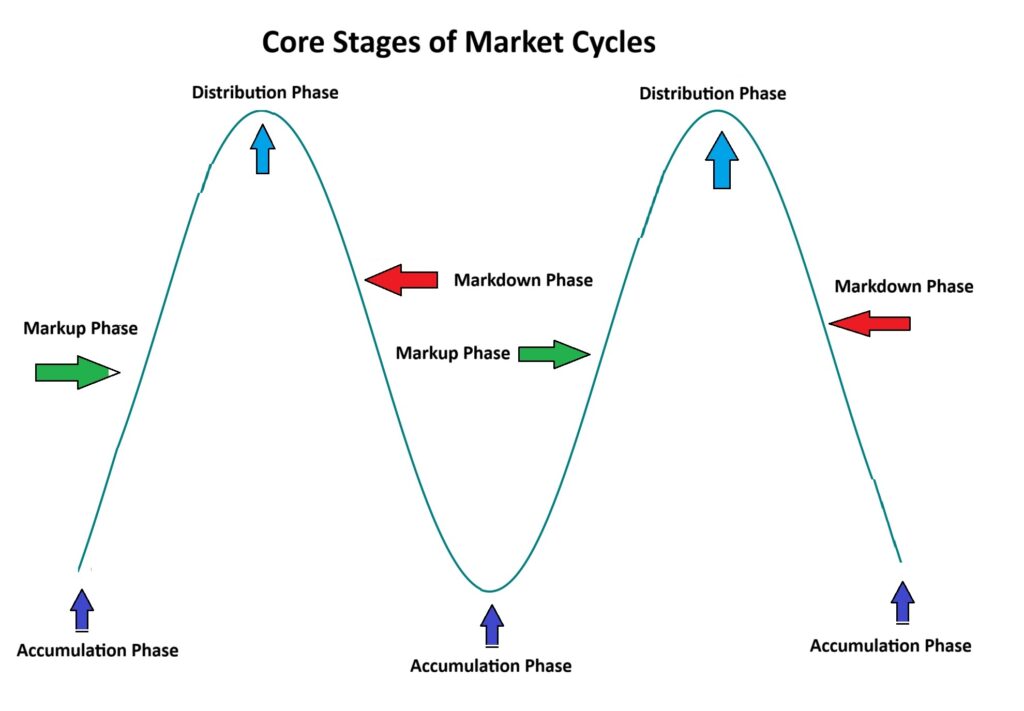
Market cycles are typically segmented into four primary phases:
- Accumulation Phase;
- Markup Phase;
- Distribution Phase;
- Markdown Phase.
Accumulation Phase: A Quiet Start to the Cycle
The accumulation phase emerges after a prolonged downtrend. Prices stabilize and often move sideways with limited upside momentum. This period is typically viewed as an opportunity for long-term investors to acquire undervalued assets as smart money begins to re-enter. Underlying demand gradually improves, yet headline prices may show little meaningful change.
Markup Phase: Broad Participation and Rising Prices
Following accumulation, the market transitions into a markup phase, usually accompanied by higher trading volumes and sustained price advances. More participants begin buying, injecting fresh demand. Positive catalysts (such as constructive macro data or company-specific developments) often support sentiment, propelling prices into a persistent uptrend.
Distribution Phase: Market Saturation and Profit-Taking
During distribution, prices reach elevated levels and the market shows signs of saturation. Investors who accumulated earlier begin to take profits. Volatility typically increases while the buying pace slows, as a larger share of participants are selling into strength rather than initiating new long positions.
Markdown Phase: Declining Prices and Capital Outflows
The markdown phase (sometimes associated with recessionary or crisis conditions) features sharp price declines and accelerating outflows. Negative sentiment and risk aversion dominate, leading to capitulation-like selling. The downtrend typically persists until prices approach a durable floor, after which a new accumulation phase can begin and the cycle resets.
The Role of Human Emotions Across the Market Cycle
In every phase of the market cycle, human emotions and cognitive biases meaningfully shape price behavior and trend dynamics. The dominant emotions and biases in each stage are:- Accumulation Phase: Skepticism prevails and investors re-enter cautiously. Common biases include Optimism Bias (selective hope about recovery) for some, and Anchoring Bias (fixation on prior prices, slow to update to new conditions) for others.
- Markup Phase: Greed and momentum-chasing intensify. Overconfidence (excess risk-taking based on recent wins) and Confirmation Bias (seeking information that supports bullish views) often drive increased buying and higher prices.
- Distribution Phase: Fear and doubt surface as markets feel saturated. Many participants take profits. Loss Aversion (stronger reaction to potential losses than equivalent gains) encourages defensive selling into strength.
- Markdown Phase: Panic becomes dominant and forced liquidations accelerate declines. Recency Bias (overweighting the latest down moves) deepens pessimism, fueling panic selling and broad capital outflows.
| Market Cycle Phase | Prevailing Emotions | Key Cognitive Biases |
|---|---|---|
| Accumulation | Caution, skepticism | Optimism Bias, Anchoring Bias |
| Markup | Greed, euphoria | Overconfidence, Confirmation Bias |
| Distribution | Anxiety, doubt | Loss Aversion, (continued) Confirmation Bias |
| Markdown | Fear, capitulation | Recency Bias, Panic Selling |
Understanding these emotional currents and how they interact with price action, helps traders contextualize signals, avoid crowd traps, and align risk management with the true phase of the cycle.
Types of Market Cycles and How They Differ
A full market cycle can last anywhere from a few minutes to several years, depending on the timeframe you analyze and the asset class you’re trading. Beyond duration, market cycles can also be viewed through other lenses such as macroeconomic conditions or the way price patterns form. Below are the main types of cycles and how they differ.
Short-Term Market Cycle
These cycles unfold on lower timeframes (e.g., minute or hourly charts) and are driven by breaking news and short-run technical developments. In short-term cycles, price swings can be sharp and frequent while the broader trend often remains intact. This perspective is best suited to day trading or scalping.
Medium-Term Market Cycle
Medium-term cycles are visible on daily or weekly charts and are typically shaped by economic releases and evolving trend dynamics. This horizon where prices shift more gradually, aligns well with swing trading.
Long-Term Market Cycle
Long-term cycles play out on monthly or multi-year timeframes and are influenced by macro conditions and policy regimes. Fundamental analysis carries the most weight here. Long-horizon investors (such as those allocating to real estate or long-only equity portfolios) often anchor decisions to yearly cycles.
Economic Market Cycle
The economic (business) cycle segments markets into periods of expansion and contraction, which in turn shape asset pricing. During expansion, markets tend to trend higher; in recessions, they often trend lower. Understanding where the economy sits in this cycle helps contextualize risk, sector rotation, and return expectations across asset classes.

According to Investopedia, different industries react differently to market cycles. For instance, during bull markets, luxury/consumer discretionary sectors tend to outperform, while in economic downturns, consumer staples sectors generally show more resilience.
Technical Market Cycle
A technical market cycle refers to price movements and patterns identifiable through technical analysis. For example, the formation of double bottoms or descending triangles (often interpreted as base-building ahead of a potential uptrend) can align with the accumulation phase. Conversely, double tops and ascending triangles, which are often seen before downtrends, can correspond to the distribution phase within the technical market cycle.
Market Cycles in Forex
The forex market, like other financial markets, moves in cycles that shape price trends and investor decision-making. Understanding these cycles helps traders refine their decisions and time entries and exits more effectively. Below, we explore how to identify market cycles in FX, their impact on currency pairs, and the technical tools that can help analyze these rhythms.
The Impact of Market Cycles on Currency Pairs
Each cycle in the forex market can drive meaningful shifts in currency valuations. For example, during the markup (bullish) phase, pairs quoted against major reserve currencies (such as the U.S. dollar) may appreciate; in markdown (bearish) phases, those same pairs can weaken.
Practical example: In economic downturns, demand for the U.S. dollar as a safe-haven typically rises, while currencies like the euro, pound sterling, or many emerging-market currencies may depreciate against the USD.
Using Economic News and Macro Data to Anticipate FX Market Cycles
A core method for anticipating forex market cycles is monitoring macro releases and central bank policy. Data and events that shape rate expectations and growth outlooks often set the tone for the next phase.
Practical example: If the Federal Reserve raises interest rates, the U.S. dollar generally strengthens versus other currencies, signaling the potential start or extension of a bullish phase for the USD.
How to Use Technical Indicators to Identify the Current Phase
Select indicators can flag trend shifts and hint at the next stage of the cycle:
- MACD: In an existing uptrend, a bearish signal-line crossover can warn of momentum loss and a potential transition into distribution or a bearish phase.
- RSI: A move above 70 followed by a rollover can signal overbought conditions and the possibility of a new downward phase; conversely, an RSI near 30 that turns up can hint at accumulation and a forthcoming upswing.
By aligning macro context with technical confirmation, forex traders can better map where the market sits within the cycle and position with greater confidence.
Best Risk Management Strategies by Market Cycle in Forex
Risk management should adapt to the market phase you’re trading. In each stage of the cycle, tailor your approach as follows:
- Accumulation Phase:
Focus on buying near key support after extended declines and keep tight stop-losses to protect capital against short-term volatility. - Markup (Bullish) Phase:
Use trailing stops to lock in profits as the trend advances, allowing room for the move while guarding against abrupt pullbacks. - Distribution Phase:
Conditions are often choppy and uncertain. Consider scaling out of longs, exploring short setups where appropriate, and keep protective, tight stop-losses to manage false breakouts and reversals. - Markdown (Bearish) Phase:
Prioritize identifying the downtrend with technical analysis and look for short positions aligned with momentum. Avoid counter-trend entries, and maintain dynamic (trailing) stops to manage risk as price extends lower.
Commodity market cycles are typically long-dated, often spanning many years or even decades. These cycles are shaped by large macroeconomic swings (such as periods of expansion and recession) whose effects on supply and demand and on global supply chains unfold gradually over time rather than all at once.
Crypto Market Cycles
According to Changelly, crypto market cycles also consist of four phases:
- Accumulation Phase: Occurs after a major sell-off, when prices are low and relatively stable and trading volumes are subdued.
- Markup Phase: Prices rise rapidly and positive newsflow reinforces the uptrend. In this phase, Bitcoin often leads—rallying earlier and faster than most altcoins.
- Distribution Phase: “Smart money” begins to exit positions while latecomers who missed the rally start buying.
- Markdown Phase: Declines in crypto tend to be swift and steep, inflicting heavy losses, especially on newcomers. Fear dominates and negative headlines amplify bearish sentiment.
Why Are Crypto Cycles Shorter and Sharper?
A key reason is the high volatility of digital assets, which allows prices to move significantly in short windows. In addition, crypto markets react quickly to rumors, news, and global events, accelerating both up- and down-swings.
The Role of Bitcoin Halving in Crypto Market Cycles
Bitcoin halving (which occurs roughly every four years) cuts the block reward in half. This slows the issuance of new BTC, tightening supply growth. The reduced flow of new coins can set the stage for a bullish cycle, as supply dynamics meet rising demand. Historically, periods following each halving have often seen stronger demand for Bitcoin, higher prices, and the subsequent formation of new bullish and bearish phases.
Tools and Methods for Identifying Market Cycles
In financial market analysis, pinpointing where we are in the cycle is essential. Accurately mapping the accumulation, markup, distribution, and markdown phases helps traders design more effective strategies. Below are widely used methods and tools to improve cycle identification:
No single tool can identify market-cycle phases with 100% accuracy; the best results come from combining technical analysis with complementary methods to improve the reliability of your forecasts.
How to Identify Market-Cycle Phases with Technical Analysis
Each phase of the market cycle (Accumulation, Markup, Distribution, and Markdown) has distinct characteristics that can be identified using technical analysis tools such as price patterns, indicators, and support/resistance levels. For example:
- Classical chart patterns can help flag potential phase shifts. In the Accumulation phase, you might see a symmetrical triangle, signaling price compression and priming the market for an impulsive move.
- Volume-based indicators can reveal the presence of smart money either entering or exiting. During Markup, elevated volume typically reflects strong demand and validates the trend’s strength.
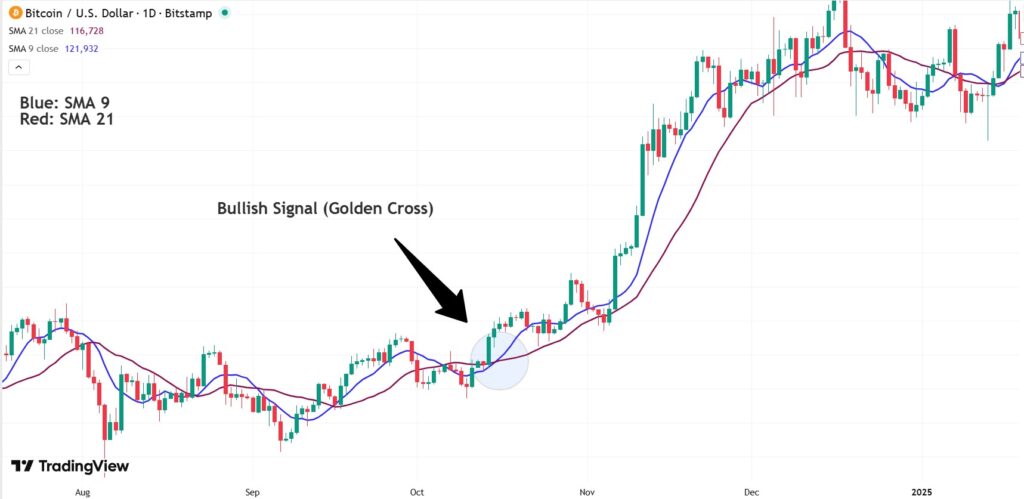
- Trend indicators such as moving averages are especially effective for spotting Markup or Markdown phases. MA crossovers and the position of price relative to key averages can indicate the start or exhaustion of a phase.
- Key support and resistance levels help pinpoint entry and exit around phase transitions. A decisive breakout above resistance or breakdown through support can serve as a signal that the market is shifting from one phase to the next.
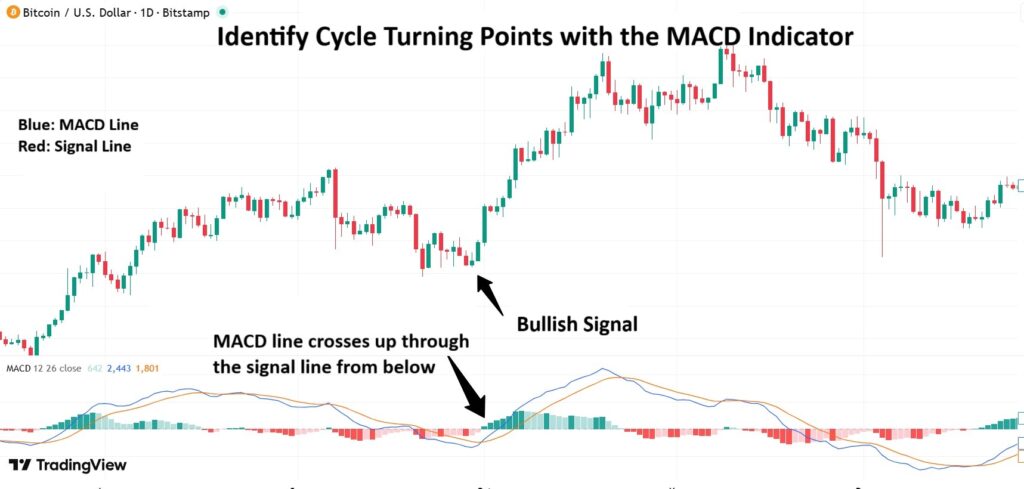
How to Identify Cycle Turning Points with the MACD Indicator
The MACD (Moving Average Convergence/Divergence) is a staple of technical analysis used to spot bullish and bearish trends as well as potential market reversals. Through crossovers and divergences, it can highlight areas where a phase shift is likely. For example:
- Signal-line crossover of the MACD line:
When the MACD line crosses up through the signal line from below, it may indicate the start of a bullish phase (a potential transition into Markup). - Divergence:
When price and the MACD move in opposite directions—e.g., price makes a lower low while MACD makes a higher low (bullish divergence), or price makes a higher high while MACD makes a lower high (bearish divergence)—it can foreshadow a price reversal and a change in the market phase.
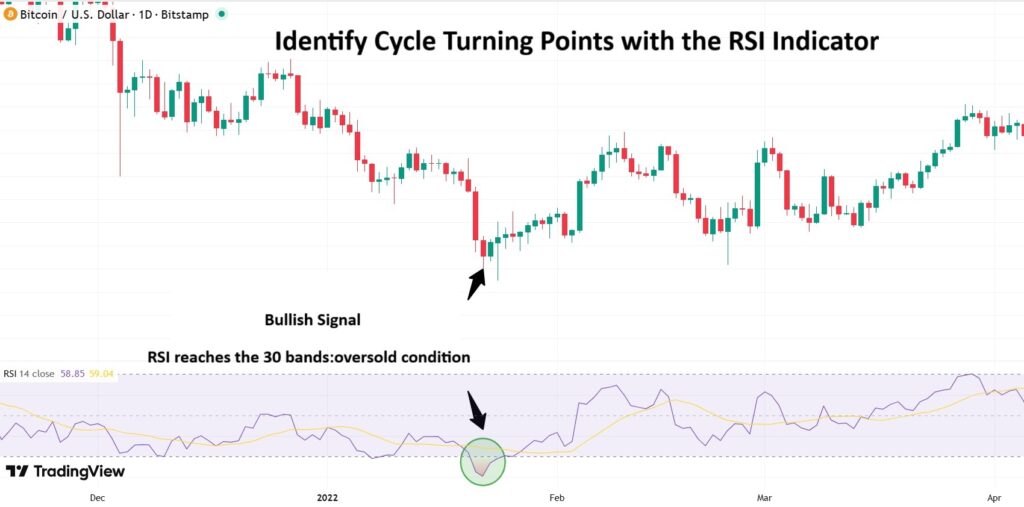
How to Identify Cycle Turning Points with the RSI Indicator
The Relative Strength Index (RSI) is also a valuable tool for pinpointing market phase shifts and identifying stages within the market cycle. For example:
- Overbought/Oversold Zones (70/30):
When RSI reaches the 70 or 30 bands, it signals overbought or oversold conditions, respectively areas where a price reversal becomes more likely. - Divergences:
RSI divergence can foreshadow turning points. For instance, if price is rising while RSI is falling (bearish divergence), it suggests weakening momentum and a potential reversal. Conversely, if price is falling but RSI is rising (bullish divergence), it may indicate mounting strength and an upcoming turn.
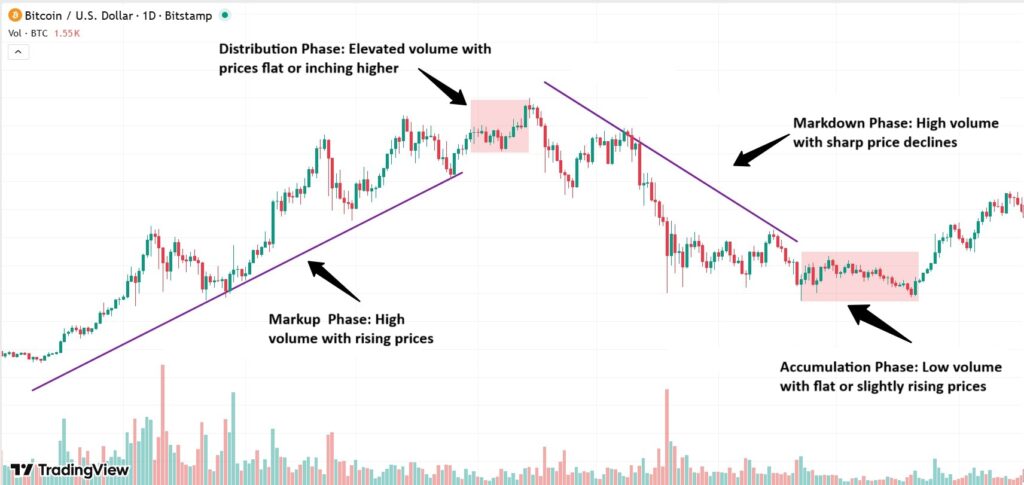
How to Identify Phase Shifts in the Cycle Using Volume
Market cycles can be analyzed with volume data as follows:
- Low volume with flat or slightly rising prices → Accumulation Phase
- High volume with rising prices → Markup Phase
- Elevated volume with prices flat or inching higher → Distribution Phase
- High volume with sharp price declines → Markdown Phase
Combining Price Action and Market Psychology to Spot Major Turns
Price action shows what price is doing; market psychology explains why. When you read them together, raw price movement turns into a narrative of fear, greed, and collective expectations and that narrative is what makes major inflection points identifiable.
For example, a clean breakout through resistance followed by acceptance and consolidation above it usually signals that the bullish narrative has been endorsed by the market. A false breakout (fakeout), by contrast, implies the crowd isn’t convinced yet (the dominant motif is skepticism) and a reversal becomes more likely.
Likewise, as the illustration below suggests: long upper wicks near resistance often betray profit-taking and fear of giving gains back, producing a bearish signal (the shooting star pattern). Long lower wicks at support, on the other hand, reflect dip-buying and hope for a rebound, generating a bullish signal (the hammer pattern).
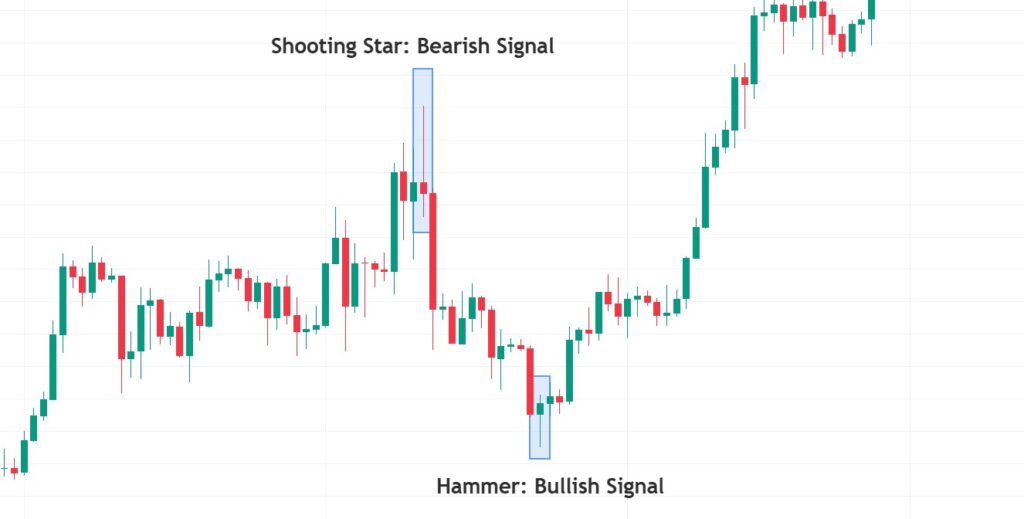
Therefore, combining price action with market psychology is precisely what separates true turning points from noise, and helps you time your entries and exits more effectively.
The Different Approaches of Short-Term Traders vs. Long-Term Investors to Analyzing Market Cycles
Short-term traders and long-term investors use distinctly different lenses to read market cycles. Short-term traders typically focus on technical analysis and price action over short windows (from one minute up to a day), seeking trading opportunities driven by rapid market swings. They rely heavily on indicators and price-action patterns to pinpoint precise entry and exit levels.
By contrast, long-term investors lean on fundamental analysis; such as the overall health of the economy, corporate financials, and major macro events. They tend to deploy capital across different phases of the market cycle and aim to benefit from multi-quarter or multi-year trends. For example, a long-term investor might build positions during a recessionary phase and scale out during expansion or distribution phases.
Trading Strategies and Capital Management Across Market Cycle Phases
Understanding the distinct phases of the market cycle and aligning your trading strategy and capital management with each phase, is fundamental to trading success. Below are selected trading approaches and money-management methods tailored to different stages of the market cycle.
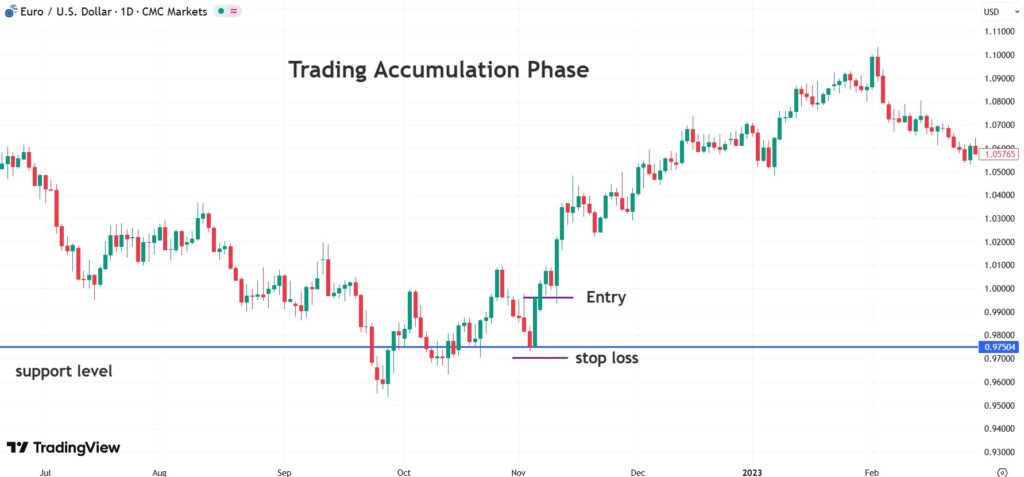
Best Buy Strategies in the Accumulation Phase and at the Onset of an Uptrend
Buying during this stage typically revolves around identifying favorable entry points and taking advantage of short-term pullbacks.
To execute this approach:
- First, identify an accumulation phase that follows a markdown (decline) in the market.
- Then wait for the price to dip below the support line.
- Next, wait for the price to recover and pull back to that same support level for a second time.
- At this point, after a bullish reversal candle closes, enter a long position.
- Set the stop-loss slightly below the support level.
- Set your profit target according to a defined risk-to-reward ratio.
How to Identify Exit Signals in the Distribution Phase and the Start of a Downtrend
In the distribution phase, the market reaches a point where prices are nearing overbought levels. This window can be appropriate for long-term investors or swing traders to scale out of positions and book profits.
How to Set Stop-Losses and Manage Risk for Each Market-Cycle Stage
Risk controls and stop placement matter in every phase of the market cycle.
- Entering during Accumulation or Distribution: Place your stop-loss just below key support (for long entries) or just above key resistance (for short entries).
- During Uptrends or Downtrends: Consider trailing stops or gradually reducing position size, especially as price approaches overbought/oversold zones. This helps lock in gains and limit downside if momentum fades.
Using Market Sentiment Analysis to Locate the Current Market-Cycle Phase
By evaluating investor and trader sentiment via positioning, commentary, and sentiment gauges such as the VIX (Volatility Index) or the Fear & Greed Index, traders can pinpoint the prevailing phase more accurately.
- For example, a rising VIX typically signals heightened fear and a greater likelihood of market weakness, while a falling VIX points to calmer conditions consistent with an uptrend.
- In bullish phases, sentiment is usually positive, encouraging additional buying. If technical indicators and price action also align to the upside, that confluence can justify entries.
- In bearish phases, fear dominates and market participants often begin to sell or de-risk.
Incorporating sentiment analysis alongside technicals helps you judge whether the market is at a turning point or merely experiencing a routine pullback within the prevailing trend.
Common Mistakes Traders Make When Using Market Cycles
Below are some of the most frequent pitfalls traders encounter when applying market-cycle analysis:
Buying at Peak Euphoria and Selling in Fear
One of the biggest mistakes is buying into peak hype. When most investors are excited and prices are surging, some traders jump in—often near the top—only to face losses. Likewise, panic selling during drawdowns is another widespread error.
Ignoring Macro Data and Structural Market Shifts
Another common misstep is overlooking macroeconomic analysis and structural changes in the market. To forecast cycles more accurately, traders need timely reads on factors such as interest rates, GDP, and employment conditions.
Misidentifying the Phase of the Market Cycle
Misclassifying the market phase can lead to poor entry and exit decisions. For instance, when the market is experiencing a temporary correction, some traders mistake it for a full downtrend phase and position incorrectly.
Overreliance on a Single Indicator or Timeframe
Many traders rely on just one indicator or one timeframe to make decisions, which can cause missed opportunities or ill-timed trades. For better accuracy, evaluate a confluence of indicators and multiple timeframes before acting.
Start your analysis from the higher timeframe to establish the market’s dominant trend; then drop down to lower timeframes to hunt for entry signals. Multi-timeframe alignment (confluence) materially improves signal quality.
Conclusion
Understanding market cycles is crucial for traders because it helps them pinpoint entry and exit timing with greater precision. This insight enables market participants to capitalize on sharp price swings while sidestepping major risks. By recognizing each phase of the market cycle and applying phase-appropriate strategies, traders can manage risk more effectively and improve their odds of success.


