icon icon Home
icon icon Accounts
icon icon Quick start
icon icon Symbols

What is a Market Structure Indicator and How Does it Analyse Market Structure?

Author
Abe Cofnas
Abe Cofnas
calendar Last update: 15 December 2025
watch Reading time: 10 min

The Market Structure Indicator is an advanced technical analysis tool designed to help traders gain a deeper understanding of price movement. This indicator provides a clearer picture of market structure by identifying key points such as highs, lows, breakouts, and trend shifts.

When you know which stage of the market cycle the price is currently in, you improve your chances of spotting profitable trades. This knowledge allows you to make decisions with greater confidence.

bookmark
Key Points:
  • Simultaneously analysing market structure across different timeframes can enhance the strength of signals.
  • Market structure analysis can identify potential areas of order accumulation, which are often the starting points for strong price movements.
  • Using market structure to more accurately pinpoint entry and exit points can improve the risk-to-reward ratio.

What is Market Structure and Why is it Important?

Market structure is a framework that illustrates how prices move and which side (buyers or sellers) holds control over the market. It helps traders understand whether the market is in an uptrend, a downtrend, or a neutral phase. 

By examining key price behaviours such as highs and lows, market structure allows traders to assess when trends may continue or reverse.

Why is market structure important for traders?

For traders, understanding market structure means:

  • Quickly recognising the dominance of buyers or sellers.
  • Identifying optimal entry and exit points based on trend changes or breakouts.
  • Minimising the impact of temporary fluctuations.
  • Setting stop-losses logically behind key levels to better protect capital.

These factors contribute to enhanced decision-making accuracy, improved risk management, and better capital protection.

Q: Can market structure signal potential reversals before they happen?
A: Yes, analysing breakpoints like higher highs or lower lows can provide early clues of trend weakening or reversal opportunities.

What is a Market Structure Indicator?

A market structure indicator is an analytical tool. It automatically marks key price highs and lows on the chart. It provides insights into the current market condition, whether bullish, bearish, or neutral.

This indicator acts like a map, clearly showing the price movement. Instead of manually identifying and marking each point yourself, the indicator performs this task automatically. It also highlights events such as Break of Structure (BOS) or Change of Character (CHoCH).

market structure indicator (9)

How to Use the Market Structure Indicator

This indicator can be activated on platforms like TradingView

Once the TradingView Market Structure Indicator is activated, marks will appear on the chart for highs, lows, breakouts, and trend changes. You simply need to match these markers with market conditions and your own strategy to make more accurate decisions.

Identifying Highs and Lows (HH, HL, LH, LL) with the Market Structure Indicator

  • Higher High (HH): A high that is above the previous high, indicating buyer strength.
  • Higher Low (HL): A low that is above the previous low, confirming an uptrend.
  • Lower High (LH): A high that is below the previous high, indicating seller strength.
  • Lower Low (LL): A low that is below the previous low, confirming a downtrend.
What is a Market Structure Indicator and How Does it Analyse Market Structure?
sms-star


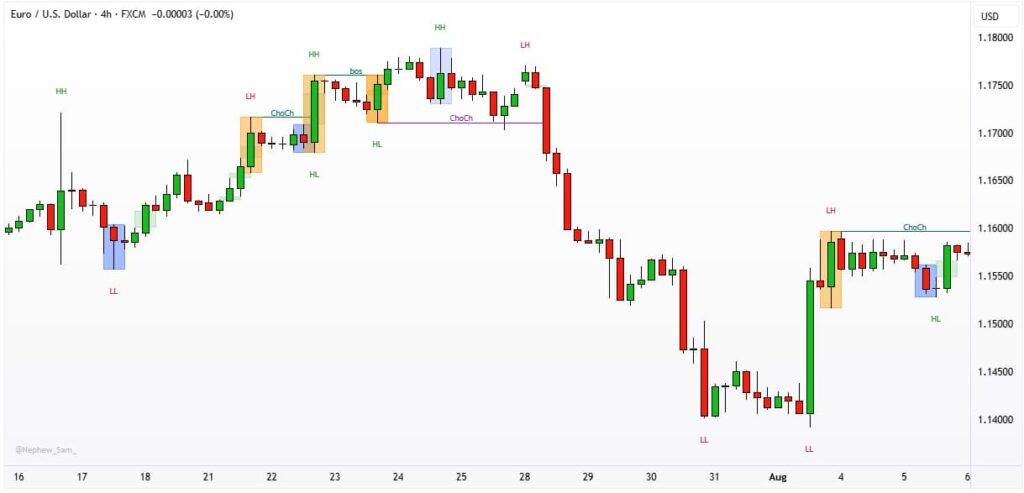
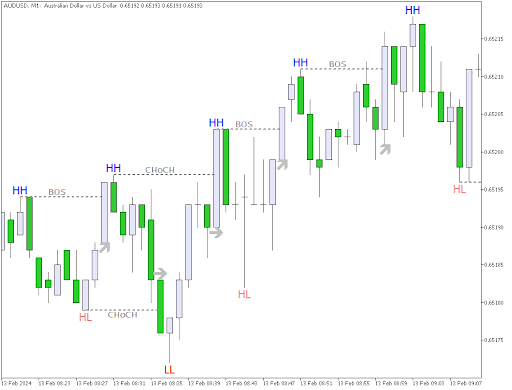
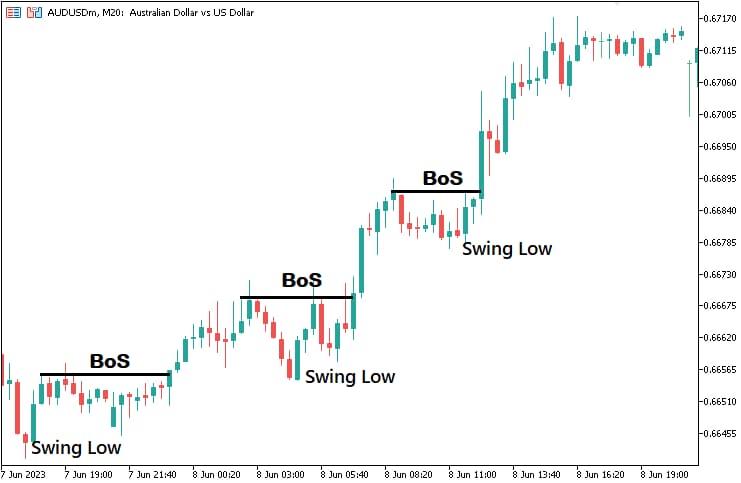
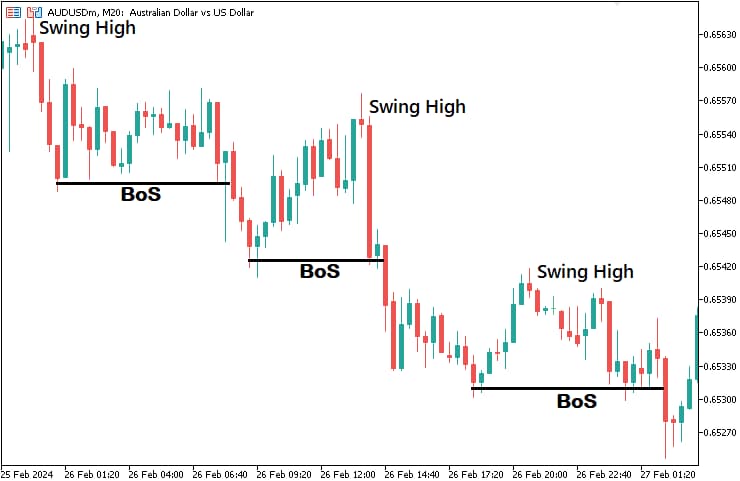
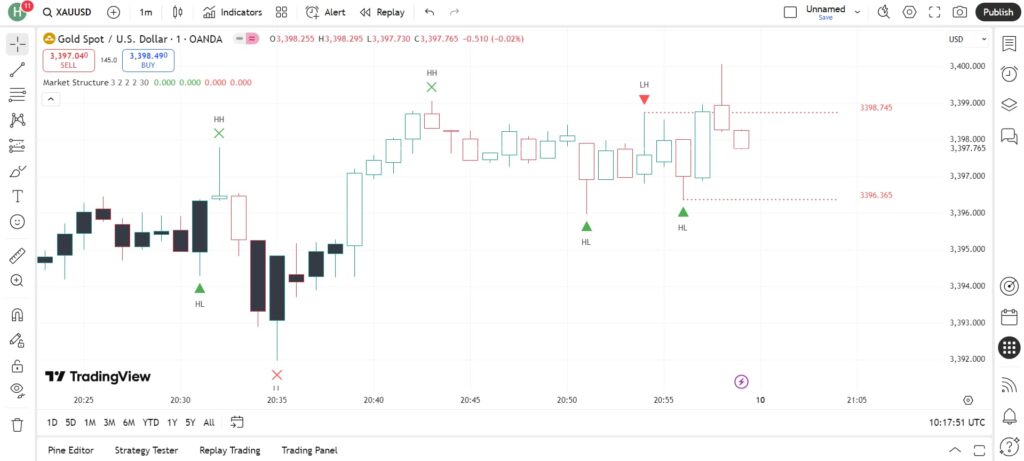
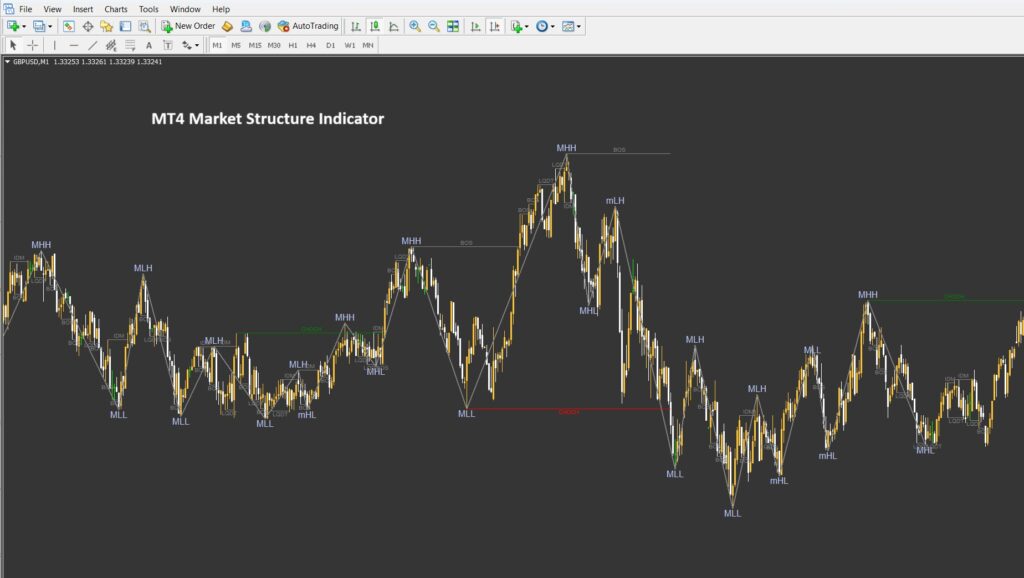
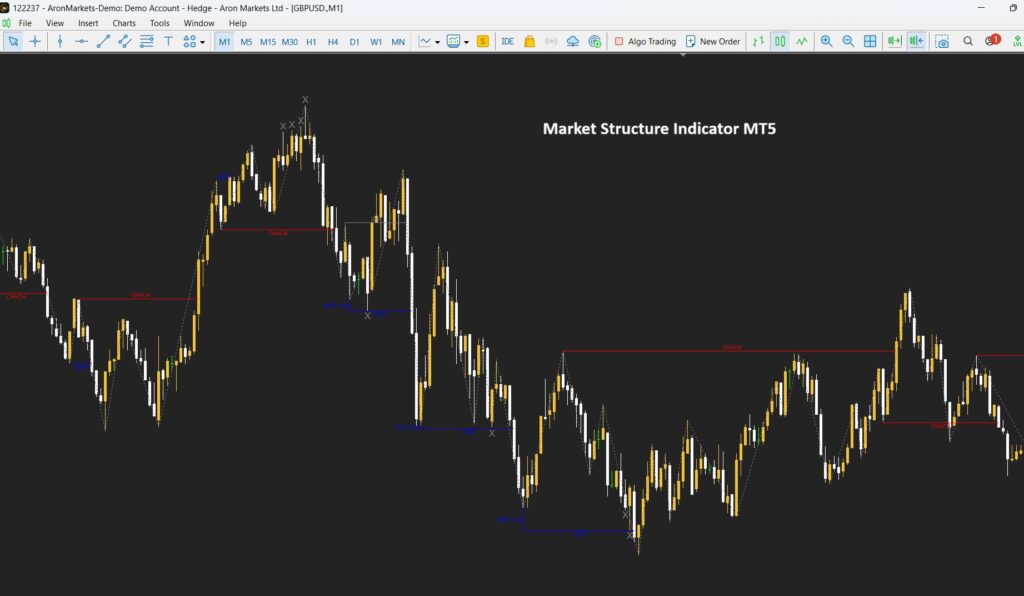
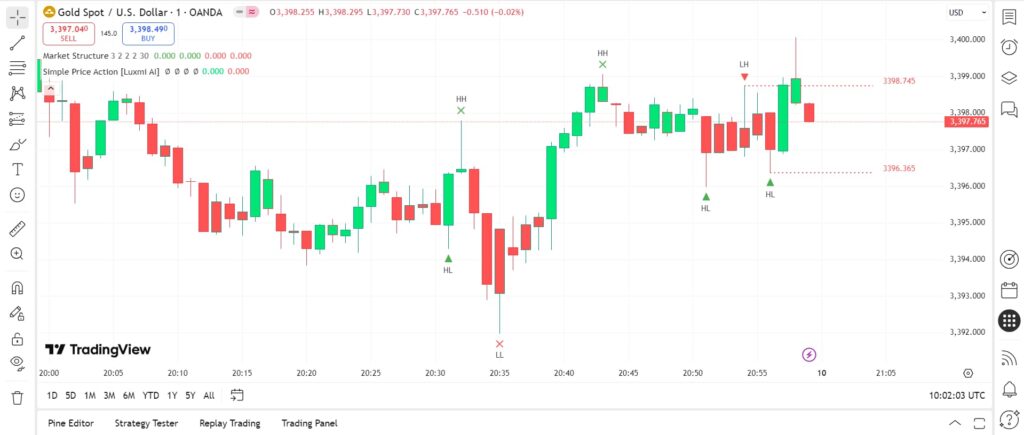
The Market Structure Indicator enables traders to identify the overall market trend based on High and Low marks on the chart.

How to Identify a Break of Structure (BOS) with the Market Structure Indicator

BOS occurs when the price breaks through the last significant high or low in the direction of the trend.

  • In an uptrend, a Price breaking above the last high (HH) signals the continuation of the bullish trend.
What is a Market Structure Indicator and How Does it Analyse Market Structure?
  • In a Downtrend, a break below the last low (LL) signals the continuation of the bearish trend.
What is a Market Structure Indicator and How Does it Analyse Market Structure?

The Market Structure Indicator highlights BOS with a distinct label or colour on the chart, making it easier to spot.

How to Identify a Change of Character (CHoCH) with the Market Structure Indicator

A Change of Character (CHoCH) occurs when the price moves in the opposite direction of the current trend. It happens when the price breaks a significant high or low in the reverse direction.

sms-star

The Market Structure Indicator includes tools for identifying Breaker Blocks and Mitigation Blocks, levels that are used in advanced strategies by financial institutions and are typically not easily visible to the naked eye.

Example:

In an uptrend, if the price breaks below the last higher low (HL), this can signal a potential trend reversal. The higher lows (HL) typically indicate sustained upward momentum. A break below one of these levels suggests that sellers may be gaining strength.

This shift in the price action indicates a weakening of the bullish trend and a possible transition to a downtrend. It suggests that the balance of power between buyers and sellers has shifted, and it may be time to reassess your position.

market structure indicator

Installing and Configuring the Market Structure Indicator in TradingView

To install and configure the Market Structure indicator in TradingView, simply follow the steps below:

  • Select the Trading Symbol
    In the Symbol Search section, type the name of the currency pair or asset you wish to analyse (e.g., XAUUSD for gold), and select your desired symbol from the list of results. 
market structure indicator
  • Adding the Market Structure Indicator

Go to the Indicators menu and search for “Market Structure.” Then, from the Community Scripts section, select one of the popular versions and click on it to add it to your chart.

market structure indicator
  •  Viewing and Interpreting Signals

After installation, the indicator marks important highs and lows (HH, HL, LH, LL) on the chart and labels events such as BOS and CHoCH. Using this information, you can clearly identify the overall trend and changes in market structure.

market structure indicator

Installing and Configuring the Market Structure Indicator in Metatrader 4 and Metatrader 5

The Market Structure indicator is not included by default in any version of MetaTrader 4 or MetaTrader 5. However, it can be easily accessed for free from reputable websites, such as TradingFinder.

 Here’s a step-by-step guide to help you download and install the MT4 Market Structure indicator and Market Structure indicator MT5.

Market structure indicator in MetaTrader 4

  1. Download the Indicator

Go to TradingFinder Website and download the .ex4 file for MT4.

market structure indicator
  1. 2. Install the Indicator 
  2.  
  • Copy the downloaded file.
  • Open the MetaTrader 4 (MT5) platform.
  • Click on File / Open Data Folder / MQL4 (MQL5) / Indicators folder.
  • Paste the downloaded .ex4 file into the Indicators folder.
  • Close the window and restart the MetaTrader platform.


3. Apply the Indicator to Your Chart in Metatrader 4

  • After restarting MT4, open a chart for the asset you wish to analyse.
  • From Insert/Indicators/Custom find ICT market structure indicator 
What is a Market Structure Indicator and How Does it Analyse Market Structure?
  • Now, double-click to apply it.
What is a Market Structure Indicator and How Does it Analyse Market Structure?

Market structure indicator in MetaTrader 5


Just as with MT4, you’ll need to find a trusted source to download the Market Structure indicator. Look for .mq5 or .ex5 files compatible with MetaTrader 5.

For Installing the Indicator:


  • Copy the downloaded file
  • Open the MetaTrader 5 platform.
  • Click on File / Open Data Folder / MQL5 / Indicators folder.
  • Paste the downloaded file into the Indicators folder.
  • Extract the zip file and double-click the .ex5 file
  • MetaTrader will open, and you can see the indicator’s name in the Navigator
  • Right-click and select Attach to a chart, or drag and drop it onto your chart.
  • You can configure the settings for optimal performance based on your trading strategy.
What is a Market Structure Indicator and How Does it Analyse Market Structure?

Key Differences Between Market Structure and Classic Price Action

The main difference between market structure and classic price action lies in the level of detail and the objective of each analysis.

Classic Price Action focuses on interpreting price behaviour through candlestick patterns, trendlines, and support/resistance levels, often combined with tools like Fibonacci. It aims to identify entry and exit points based on price reactions.
Market Structure provides a more structured framework, focusing on the sequence of highs and lows (HH, HL, LH, LL) and key events, such as BOS and CHoCH.

sms-star

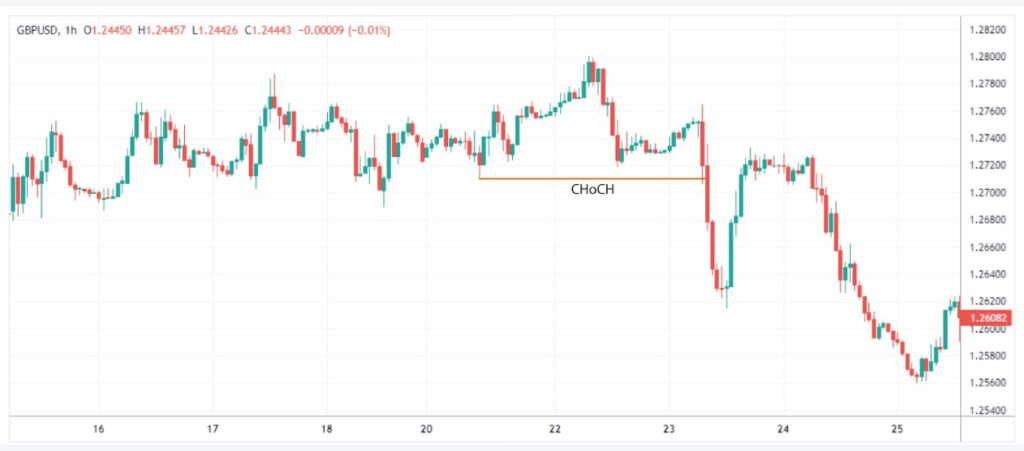
Overall, market structure provides a deeper understanding of market behaviour compared to classic price action.

Combining the Market Structure Indicator with Price Action


When you combine the Market Structure Indicator with Price Action, the result is like having a roadmap with detailed directions. 

market structure indicator

Example:

If the indicator shows an upward Break of Structure (BOS), Price Action can help you assess whether the breakout is genuine or a false breakout.

During a Change of Character (CHoCH), candlestick analysis and trading volume can confirm whether the trend reversal is legitimate or just a temporary correction.

 This combination provides a broader market view (using the Market Structure Indicator) while also offering precise entry or exit details (with Price Action).

Main Advantage: It reduces the likelihood of signal misinterpretation, allowing for trades with a higher probability of success.

sms-star

The Market Structure Indicator is capable of identifying liquidity gaps, areas where the market, due to a lack of orders, typically returns to fill them in the future.

Combining the Market Structure Indicator with OBV

Combining the Market Structure Indicator with OBV (On-Balance Volume) is a powerful method for confirming signals and reducing errors in trades. The Market Structure Indicator helps identify the stage of the trend and highlights events such as BOS or CHoCH.

 On the other hand, OBV shows the cumulative volume of trades, indicating whether the price movement is supported by strong volume or not.

What is a Market Structure Indicator and How Does it Analyse Market Structure?

Example:

  • If the Market Structure Indicator shows an upward BOS and the OBV is also moving upwards simultaneously, this confirms the bullish trend and indicates increased buying strength.
  • Conversely, if during a bearish CHoCH, the OBV is also decreasing, the likelihood of a trend reversal to the downside increases.
  • However, if there is a price break or trend change but the OBV shows no significant change, you may be facing a false signal.
sms-star

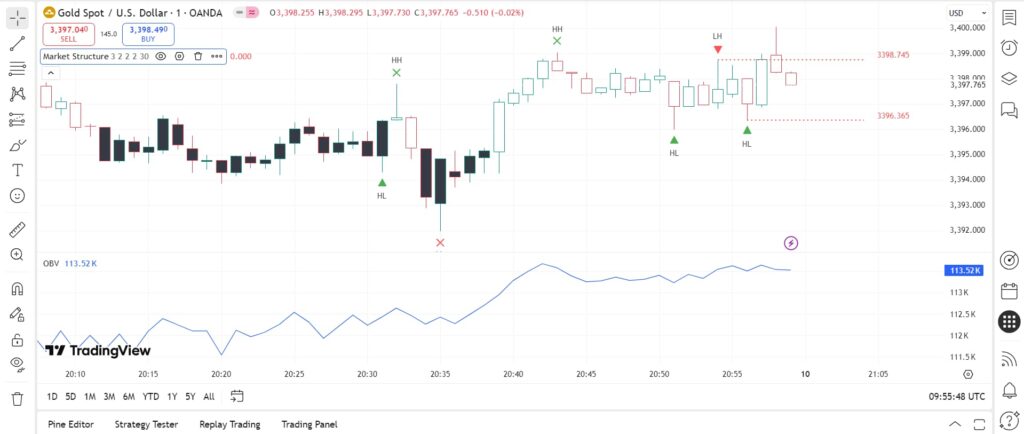
Combining the Market Structure Indicator with OBV helps to ensure that the price movement is supported by real market volume before entering a trade.

Advantages and Disadvantages of the Market Structure Indicator

Advantages of the Market Structure Indicator

The benefits of using the Market Structure Indicator include:

  • Quick Identification of Trend and Market Phases: It automatically identifies highs, lows, breaks, and structural changes in the market. 
  • Time-Saving in Analysis: You no longer need to manually mark all key points. 
  • Reduced Human Error: By accurately labelling HH (Higher High), HL (Higher Low), LH (Lower High), and LL (Lower Low), it minimises the risk of misidentifying trends. 
  • Compatibility with Other Tools: It can be combined with other tools, such as Price Action, OBV, or RSI indicators, to confirm signals. 
  • Suitable for All Timeframes: It is applicable to both intraday trading and long-term analysis.
sms-star

Unlike conventional tools, the Market Structure Indicator has the ability to "adapt to market conditions" and can redefine the structure based on the current market environment, providing a more accurate analysis.

Disadvantages of the Market Structure Indicator

The disadvantages of the Market Structure Indicator include:

  • Potential for false signals: In highly volatile markets, the BOS or CHoCH strategy might be misinterpreted. For a better understanding, refer to the article on the difference between BOS and CHoCH.
  • Dependence on settings: The results may vary depending on the parameter settings.
  • No certainty in predictions: This indicator only analyses the past and present market conditions, offering no guarantees for the future.
  • Requires correct interpretation: Without a solid understanding of market structure, using the indicator could lead to incorrect conclusions.


Conclusion

The Market Structure Indicator is an efficient tool for identifying trends and key highs and lows. It also recognises pivotal points such as BOS and CHoCH, helping traders understand the flow of market power.

Using this indicator saves time, reduces analysis errors, and improves decision-making. However, it is not advisable to rely solely on it. Combining it with tools like Price Action, the OBV indicator, or RSI can enhance signal accuracy. This combination increases the likelihood of successful trades.

Continue Reading
not-found
calendar 15 December 2025
Rate this article
Plugin not installed

Leave a Reply

Your email address will not be published. Required fields are marked *

No thanks