icon icon Home
icon icon Accounts
icon icon Quick start
icon icon Symbols

Powerful Indicators for Identifying Order Blocks and Breaker Blocks in TradingView

Author
Abe Cofnas
Abe Cofnas
calendar Last update: 20 December 2025
watch Reading time: 10 min

In financial market analysis, spotting high-quality entry and exit zones can make a meaningful difference in your results. Two of the most important zones, especially in advanced price action strategies, are Order Blocks and Breaker Blocks. These areas can act as potential turning points, and recognising them can support more precise decision-making.

So the real question is: how do you find these zones and use them effectively?
In this article, we’ll introduce some of the best TradingView order block and breaker block indicators and show how to use them for market analysis. If you’re looking to refine your strategy and improve the accuracy of your analysis, this guide can help you level up your trading process. Stay with us until the end.

bookmark
Key Points:
  • Order blocks and breaker blocks help traders pinpoint high-probability entry and exit areas with lower risk by highlighting order accumulation zones and structural breaks.
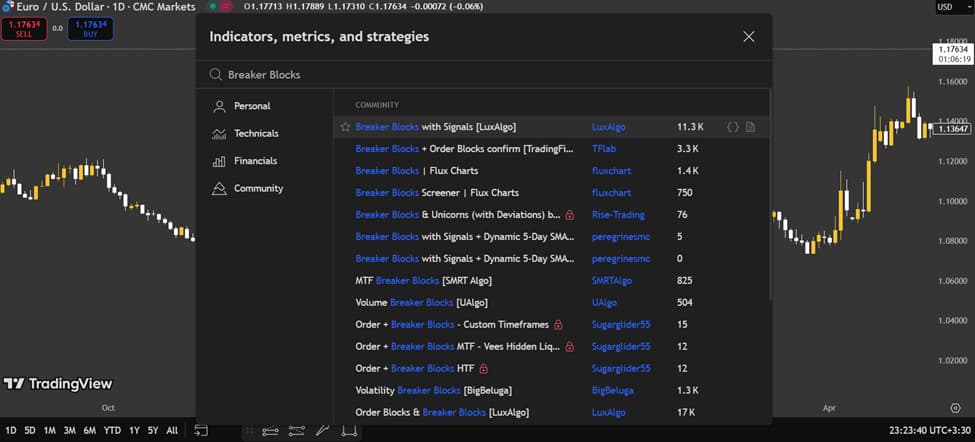
  • Professional order block indicators typically consider a zone “valid” only when it is confirmed by a Break of Structure (BOS).
  • Breaker block accuracy tends to improve when used alongside hidden liquidity zones and imbalance areas.
  • Combining ICT price action with order block and breaker block indicators can strengthen trading strategies and surface more precise trade opportunities.

What is an Order Block, and how is it identified in price action?

An Order Block refers to areas on a price chart that suggest large institutional orders or activity from major market participants. These zones, often identified using ICT price-action concepts, can serve as key levels where price is likely to react.

In the ICT framework, order blocks typically form as:

  • The last bearish candle before a bullish move (for a bullish order block), or
  • The last bullish candle before a bearish move (for a bearish order block).

These candles represent areas where institutions concentrated orders, which is why they’re often treated as strong support or resistance zones.

In ICT-style price action, traders study behaviour such as impulsive candles and consolidation zones to mark these areas without complex tools manually. 

For example, a bullish order block often appears after a consolidation phase followed by an upward breakout, signalling strong buying. Because these areas often contain substantial liquidity, they can offer attractive entry or exit points. With practice, identifying them on the chart becomes far easier.

order and breaker blocks
sms-star

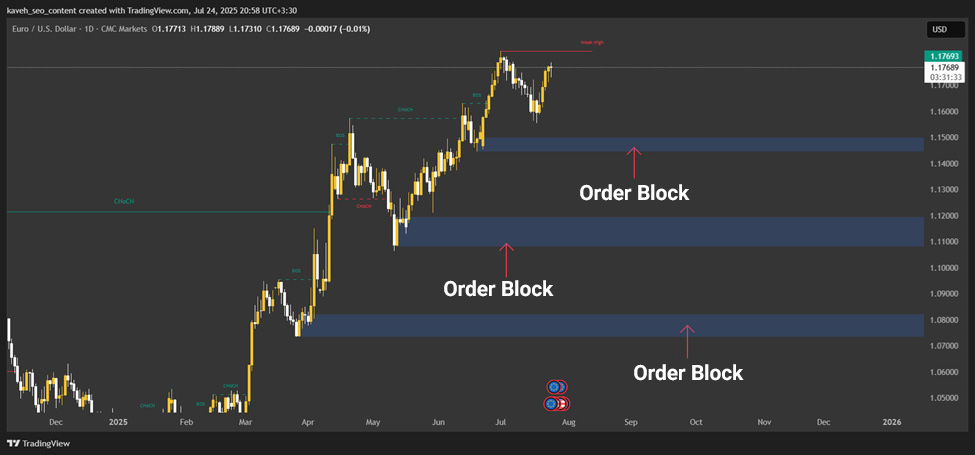
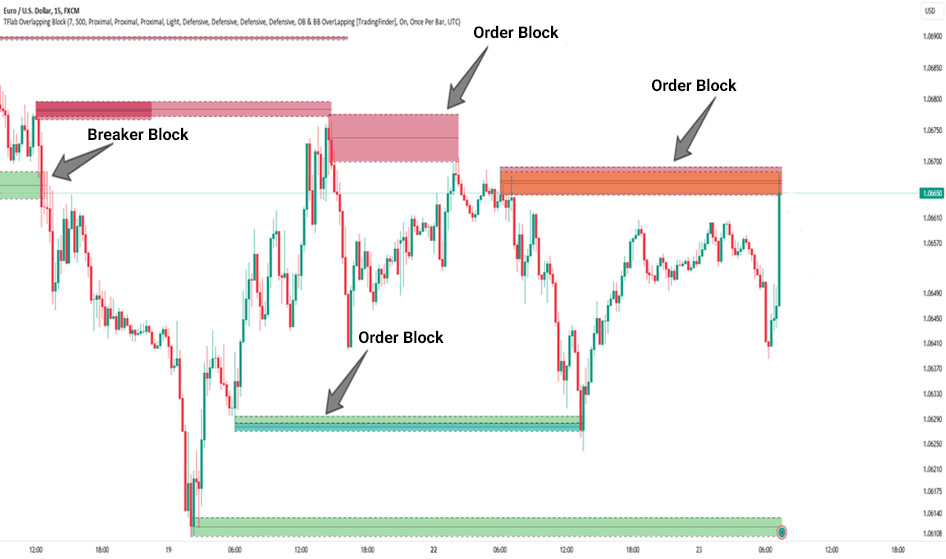
In ICT price action analysis, order blocks act as key zones for identifying market entry and exit points. These areas typically form after a strong price move followed by consolidation, and they indicate the accumulation of large orders by institutional participants.

What Is a Breaker Block, and How Is It Different From an Order Block?

A Breaker Block is a zone on the price chart that forms after an order block is broken and then starts acting as a new support or resistance level. When a price breaks a bullish order block to the downside or breaks a bearish order block to the upside, that zone can effectively become a breaker block.

Unlike an order block, which signals institutional order accumulation, a breaker block results from a Market Structure Shift (MSS) and typically appears after a strong move and a Liquidity Grab. The best breaker block indicators, such as the ICT Breaker Block Indicator, identify these zones automatically by analysing price action and help traders find more precise entry and exit points. If you want a deeper explanation, you can refer to Aron Groups’ article titled “What is a Breaker Block?”

In trading strategies, breaker blocks are used to spot reversal or trend-continuation opportunities. 

For example, in a bullish breaker block, traders often wait for the price to return to the level and confirm support, then enter a buy trade with a stop loss placed slightly below the zone.

FeatureOrder BlockBreaker Block
DefinitionA zone where large institutional orders are placed and a price move begins.A zone that forms after an order block is broken; price later revisits it, and it acts as a new support/resistance.
Role in the marketSignals early entry zones.Signals a market shift and new entry zones.
Price behaviourAfter forming, the price often reacts from the zone and moves away.After the break, the price revisits the zone, and a new move may start.
Use in strategyUsed to identify initial entries.Used to identify trend shifts and re-entry opportunities.
sms-star

The distinction between a breaker block and an order block comes down to their role. An order block marks the starting point of a price move, while a breaker block forms after the break when the level flips its role and is used to confirm the new trend.

The Role of Order Blocks in Market Structure

Market structure, in simple terms, is the way price moves on a chart. Sometimes price advances in an uptrend or downtrend, and sometimes it oscillates within a defined range. TradingView order block detection tools help us identify the key zones within this structure. These zones, called order blocks, are areas where banks and large institutions place their orders in the market.

Order blocks are part of the broader Smart Money concept, meaning areas where major market players step in. When the price reaches an order block, you’ll often see one of these outcomes:

  • Trend reversal: price changes direction from the zone.
  • Trend continuation: price reacts and continues the current move with stronger momentum.

Tools like TradingView order block indicators highlight these areas automatically and make the process easier. By using them, you can anticipate when prices may bounce or reverse, helping you trade more like a professional and benefit from the market’s bigger moves.

Powerful Indicators for Identifying Order Blocks and Breaker Blocks in TradingView
sms-star

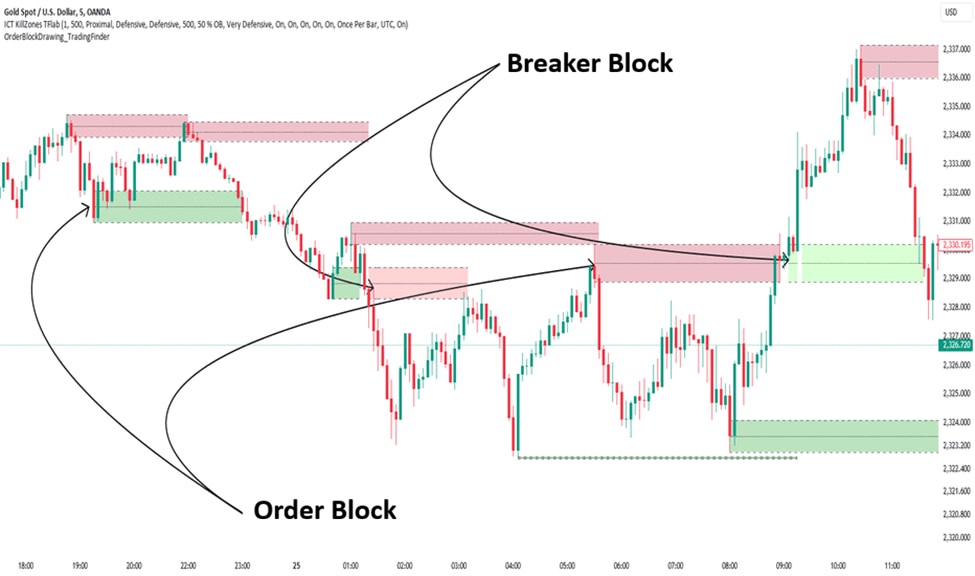
To identify valid breaker blocks, pay attention to strong confirmation candles (such as engulfing candles) after the break of structure, to reduce the risk of false signals.

Why Do ICT Traders Use Order Blocks and Breaker Blocks?

1) ICT focuses on what actually moves price

ICT is popular among professional traders because it’s simple and built around real price behaviour. Instead of relying on complex indicators, it focuses on price action and institutional activity (Smart Money).

2) These zones act like a roadmap

Order blocks and breaker blocks help traders spot key areas where banks and large institutions likely placed significant orders. When the price reaches these zones, it often does one of two things:

  1. Reverses from the level;
  2. Continues with strong momentum.

3) Why indicators help

ICT indicators can highlight these zones more precisely:

  • Order blocks: Often act as strong support/resistance and may signal the start of a major move.
  • Breaker blocks: Form after an order block is broken, helping spot reversal or trend-continuation entries.

A practical benefit is risk control, because traders can often place a stop-loss close to the zone.

4) Why professionals like it

The ICT method doesn’t require complicated tools. With a clear focus on price behaviour and these repeatable concepts, traders can make more structured decisions and improve their probability of success.

Best Breaker Block Indicators in TradingView

LuxAlgo Breaker Block Indicator

LuxAlgo’s Breaker Block Indicator automatically detects breaker blocks and lets you adjust sensitivity. It’s designed for fast decision-making with clear visual zones and alerts.

Key features:

  • Custom alerts for quicker entry/exit spotting;
  • Clean visual marking on the chart;
  • Adjustable lookback period;
  • Highlights premium and discount zones to improve context and accuracy.

ICT Breaker Block Finder

The ICT Breaker Block Finder is strong across multiple timeframes (short-term to long-term). It focuses on Break of Structure (BOS), making it a natural fit for the ICT trading style.

Key features:

  • BOS-driven detection for higher precision;
  • Timeframe flexibility;
  • Option to display a specific number of blocks.

How to use them for better accuracy

For more reliable trades, combine these indicators with price action:

  • Wait for the price to retest the breaker block.
  • Confirm with candlestick patterns before entering.

This filters many false signals and typically leads to more confident entries. Using a strong breaker block indicator alongside price action can significantly improve your trading accuracy in financial markets.

order and breaker blocks
sms-star

When using breaker block indicators, test the default settings on historical market data to find the sensitivity level that best fits your strategy.

Best Order Block Indicators in TradingView

TradingView order block indicators are simple tools for finding key market zones where large institutional (bank) orders tend to cluster. Order Block Detector [LuxAlgo] is one of the best options. By analysing trading volume, it automatically identifies these areas. For better results, set the analysis period to 10 and enable alerts. This tool works well across forex, stocks, and cryptocurrencies.

Order Blocks W/ Realtime Fibs [QuantVue] combines order blocks with Fibonacci levels to deliver more precise entry and exit points. It’s recommended to focus on the 50% and 61.8% Fibonacci levels. This indicator performs especially well in highly volatile markets like crypto.

order and breaker blocks

Reviewing the ICT Killzones Indicator and Smart Money Order Structure

The ICT indicator, especially the Killzones tool, helps traders identify high-activity market windows such as the London session (10:30-13:30 Iran time) and the New York session (16:30-19:30 Iran time). These time windows, known as Killzones, are periods of elevated institutional (Smart Money) activity, when prices can experience significant moves. 

ICT tools often connect these windows with order blocks (zones where large orders cluster) and breaker blocks (levels that form after an order block is broken), showing where major institutions may be entering the market.

For example, imagine you’re analysing EUR/USD on the 1-hour timeframe. During the New York session, the price moves higher and breaks an order block. After that break, the price retraces lower, indicating the formation of a breaker block. These zones can offer strong opportunities for market entry.

sms-star

When trading during Killzones, use an economic calendar to avoid entering positions around major news releases, so you can reduce the risk of unexpected volatility.

Should You Use Free Indicators or Premium Indicators?

Choosing between free and premium indicators on TradingView depends on your needs and trading style.

Free indicators

Free tools such as order block indicators or breaker block indicators are easy to access and quick to use. They’re a strong starting point for beginners who are still learning the basics. In many cases, they offer solid accuracy and are enough for straightforward analysis.

Premium indicators

Premium indicators usually provide more advanced features, such as:

  • Customizable settings,
  • Real-time alerts,
  • Integration with other tools,
  • Better support and updates.

They’re generally better suited for professional traders who rely on deeper, more complex analysis. The downside is the monthly subscription cost, which may not be cost-effective for everyone.

How to choose

To choose the right indicator, first define your strategy. If you’re a beginner, start with free indicators and use practice to understand what you actually need. Professional traders may prefer premium order block or breaker block indicators on TradingView to improve analysis speed and accuracy. Ultimately, your budget and trading style will determine the best choice.

How to Install and Enable Breaker Block and Order Block Indicators in TradingView

To use TradingView order block indicators and breaker block indicators, you first need to add them to your TradingView chart. Follow these steps:

  • Log in to your account: Go to the TradingView website or open the app. If you don’t have an account, create a free one.
  • Open a chart: Start a new chart and select the currency pair or asset you want to analyse.
Powerful Indicators for Identifying Order Blocks and Breaker Blocks in TradingView

Search for the indicator: Click “Indicators” at the top of the chart. In the search bar, type terms like “Order Block” or “Breaker Block.” You’ll find popular options such as “Order Blocks [LuxAlgo]” or “Breaker Blocks [TradingFinder].”

order and breaker blocks
  • Add to chart: Click the indicator you want to apply.
Powerful Indicators for Identifying Order Blocks and Breaker Blocks in TradingView

To optimise performance, align the settings with your timeframe and strategy. For example, if you trade intraday, try using the 1-hour timeframe. For a complete walkthrough of the platform, refer to the TradingView tutorial.

Conclusion

Using order block and breaker block indicators can significantly improve the accuracy of your analysis and reduce trading risk. By identifying key market zones, these tools help traders define more precise entry and exit points and take advantage of larger price moves.

By combining these indicators with ICT price action, you can refine your analysis and build stronger trading strategies. It’s recommended to test these tools on TradingView and, through consistent practice and ongoing learning, strengthen your market analysis skills. Trading success takes time, practice, and knowledge, so stay up to date and continually improve your skills.

Continue Reading
not-found
calendar 20 December 2025
Rate this article
Plugin not installed

Leave a Reply

Your email address will not be published. Required fields are marked *

No thanks