


In the past, surface-level price and volume analysis gave a general view of market behaviour. Today, high-frequency trading and rapid order shifts demand more precise tools for depth analysis.
To better understand the supply-demand balance and spot genuine market activity, traders use advanced tools such as order flow indicators. These tools show real-time buy and sell order details, enabling faster decisions with more accurate execution.
In this article, we first explain order flow trading, then introduce the most effective order flow indicators. These tools can offer deeper insight into market structure and the direction of prices that may develop next.

- Trading with order flow means analysing live buy and sell orders to forecast price direction more accurately.
- Concepts like order absorption, market exhaustion, volume profile, and order imbalance drive this analysis style.
- For stronger results, combine order flow analysis with methods like price action or broader technical analysis.
- Success requires professional platforms and strict trading discipline, making this approach well-suited to focused, detail-oriented traders.
What is the Order Flow indicator (Order Flow)?
Order flow trading is one of the most precise methods of market analysis. Instead of studying past prices, it focuses on real-time behaviour from buyers and sellers.
Unlike traditional tools such as moving averages or volume indicators that only show price changes, order flow shows who traded. It reveals when they traded, how much they traded, and exactly which price level they used.
In practice, this method is built on one simple principle:
Price moves when an imbalance forms between supply and demand.
If many buy orders enter the market and sellers cannot meet them, the price rises. Conversely, if selling pressure increases and buyers disappear, the price can fall sharply.
Today, platforms like TradingView provide professional order flow tools, making this analysis more accessible to all traders.

Key Insight
Order flow loses accuracy when participation drops. During holidays, late sessions, or thin Asian hours, order signals often look “clean” but lack follow-through. Low participation exaggerates small orders and creates false confidence, even when data appears technically sound.
What information does the Order Flow indicator provide?
Below are three important types of information you can gain from order flow analysis or an order flow indicator.
1) Order flow analysis
At the heart of order flow is one key concept: analysing the real-time interaction between buy and sell orders.
In the market, there are two main types of orders:
- Limit orders: orders waiting to be filled at a specific price, which collectively form market liquidity.
- Market orders: orders executed immediately at the best available price, which typically drive price movement.
Order flow analysis helps you see which side is more active in the market.
Are buyers in control, or are sellers dominating the tape?
2) Identifying liquidity and market maker behaviour
One useful capability of order flow indicators is spotting hidden liquidity zones. These are areas where large orders are placed by professional players such as market makers.
Imagine price approaches a support level and a surge of sell orders hits the market, yet the price does not drop. This often means large buyers are absorbing those sell orders, which can signal a likely rebound upwards.
By reading these signals, you can more closely track institutional activity and time entries alongside larger participants.
Better to Know
Absorption does not always mean reversal. Institutions may absorb orders simply to exit positions or rebalance exposure. Without follow-through in delta or continuation volume, absorption alone is neutral, not directional.
3) Viewing real-time traded volume
Unlike typical volume indicators that only display a candle’s total volume, order flow tools like Footprint Charts and Volume Delta show:
- How much volume traded at each price level?
- How many buy orders were executed at the ask price?
- How many sell orders were executed at the bid price?
This data is vital for scalpers and day traders because it shows where buyer-seller conflict is most intense. With that clarity, traders can choose more accurate entry points and cleaner exits.
Note: Combining Depth of Market (DOM) with order flow can provide a sharper view of dynamic support and resistance levels.
Q: Can order flow predict direction without price moving first?
A: Sometimes. Strong delta shifts, aggressive lifting, or sudden liquidity withdrawal often precede visible price movement, especially near key structural levels.
The most important visual and analytical tools in Order Flow analysis
To use an order flow indicator professionally, you need to understand several specialised visual and analytical tools. Below, we review the most widely used tools in order flow analysis.
| Tool | What it Shows | Best For |
|---|---|---|
| Footprint Chart | Buyers vs Sellers inside each candle. | Pinpointing entries & reversals. |
| Volume Profile | Volume traded at each price level. | Finding Support/Resistance zones. |
| Delta Volume | Net difference (Buyers - Sellers). | Confirming trend strength. |
| DOM (Depth) | Limit orders waiting in the queue. | Spotting liquidity walls (Spoofing). |
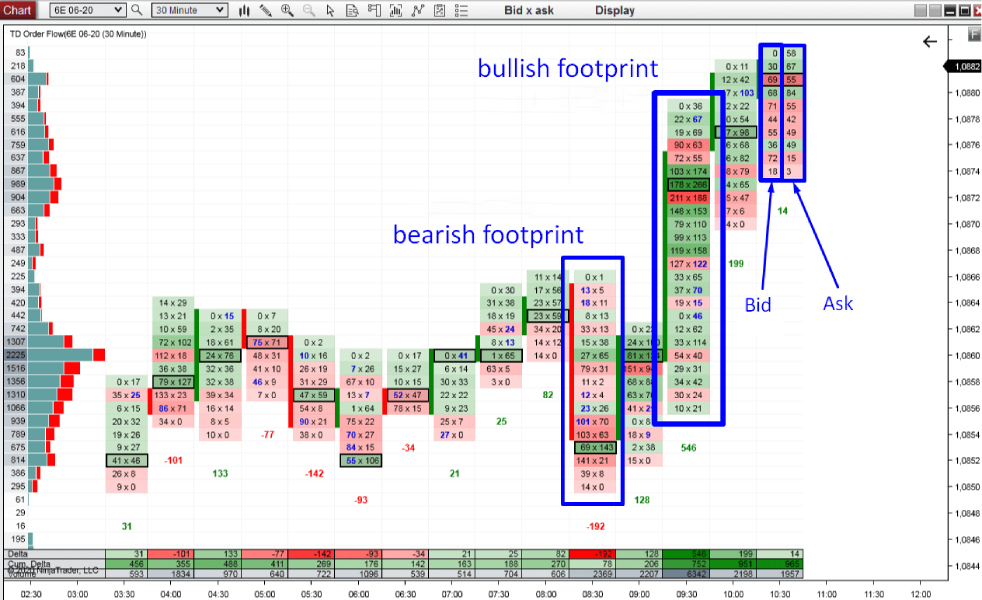
1) Footprint Chart
The Footprint Chart is one of the most popular order flow tools used by active traders.
Unlike standard charts that show only price and total volume, it displays bid and ask volume at each price level.
It shows exactly how much buying volume traded at the ask and how much selling volume traded at the bid. This detail helps you see who controlled each area: buyers, sellers, or a temporary balance between both sides.
Example:
In a typical footprint view, red numbers represent selling volume and green numbers represent buying volume inside each candle. This makes it easier to spot where control shifts and where one side starts to dominate.
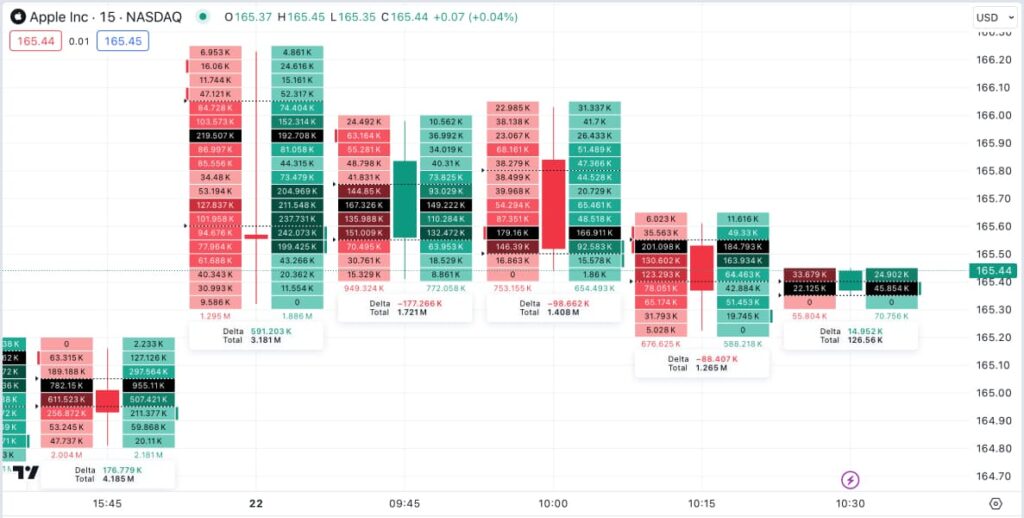
Main use:
Identifying levels where absorption or imbalance appears, especially for precise entries and exits in price action and scalping.
2) Volume Profile
The Volume Profile is a highly effective tool for identifying value areas, support and resistance zones, and market-maker behaviour. Unlike traditional volume, which is time-based, Volume Profile plots traded volume horizontally across price levels.
In most displays:
- Green zones: high-volume areas where trading is heavy, and the price often stabilises.
- Red zones: low-volume areas where price typically travels quickly with less resistance.
Main use:
Identifying where larger traders prefer to participate and where price is more likely to rotate and consolidate.
3) Delta Volume
Delta Volume is another key tool in order flow trading and short-term execution analysis. Delta measures the difference between volume executed at the ask and volume executed at the bid over a defined period.
Simple formula:
Bid volume − Ask volume = Delta
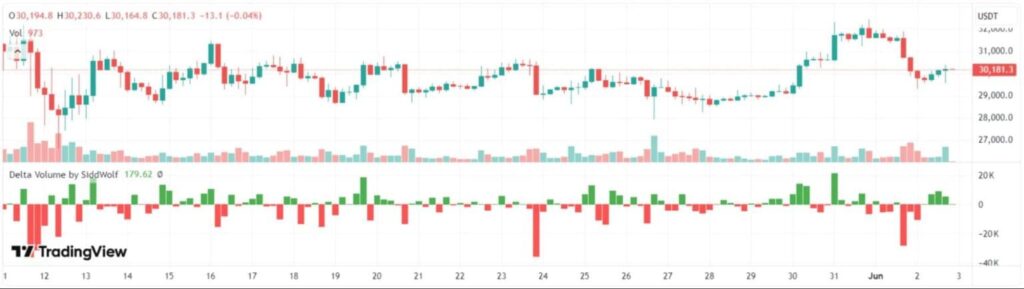
On many charts, green bars show positive delta, meaning stronger buying pressure during that period. Red bars show negative delta, meaning selling pressure was heavier and more aggressive.
Main use:
Measuring real buyer and seller strength behind candles, spotting hidden divergences, and confirming genuine breakouts.
4) Depth of Market (DOM)
Depth of Market, or DOM, shows the number of resting orders waiting to be filled at each price level. It reveals how many buy orders sit on the bid and how many sell orders sit on the ask.
Put simply:
The DOM is a window into the book that shows where other traders intend to buy or sell. This view helps you understand liquidity, queue size, and the likely reactions around key levels.
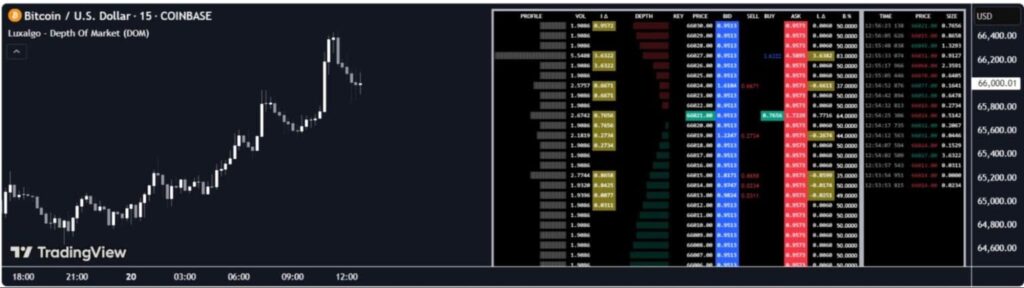
In many DOM screens:
- Red columns represent sell orders at the ask.
- Blue and green columns represent buy orders at the bid.
- Other columns show different price levels, arranged vertically around the current price.
- A side panel often shows Time & Sales, printing executed trades in real time.
Key uses of DOM:
- Identifying real support and resistance levels based on visible liquidity.
- Spotting hidden or refreshed orders that are often associated with larger participants.
- Observing market maker behaviour when sizeable orders hit the market.
If you want more precise entries and exits in price action or scalping, DOM can significantly improve decision quality.
5) Time & Sales (the live tape)
Time & Sales, also called the tape, shows each trade’s exact time, price, and traded size. It behaves like a live printer, displaying real transactions as they occur in the market.
This makes it easier to see whether buyers or sellers are actively hitting the book. Huge prints can signal smart money activity or the early start of a new market move.
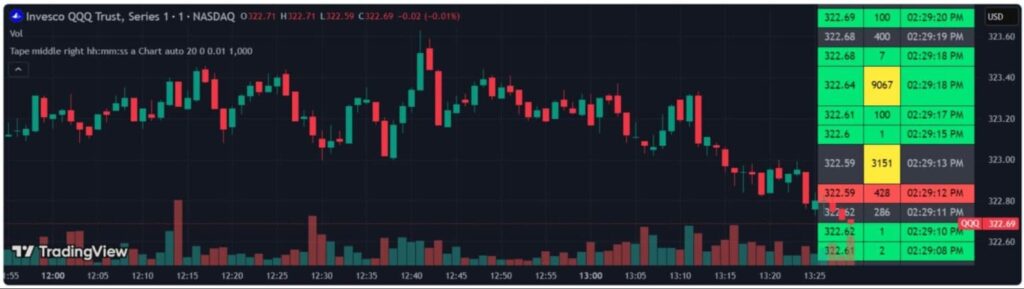
Example:
In a typical Time & Sales panel:
- The left column shows the trade price.
- The middle column shows the traded size at that price.
- The right column shows the exact execution time.
Large trades are often highlighted in yellow or red for quick recognition. Those abnormal volumes may indicate institutional participation or increased short-term momentum.
Key Point
Perfect order flow signals fail without context. Session timing, higher-timeframe bias, and nearby liquidity pools matter more than micro-level precision. Order flow should refine decisions, not replace directional context.
Q: Which order flow tool should beginners ignore first?
A: DOM. It updates too quickly for untrained eyes. Beginners gain more clarity starting with the footprint and delta before real-time depth data.
How do you use the Order Flow indicator in trading?
The order flow indicator helps a trader spot price moves before they happen, rather than reacting after the move begins.
By analysing live buy and sell orders, you can see where strong buyers step in, where sellers turn active, and which levels suit lower-risk entries or exits.
How to identify precise entry and exit levels using order flow
One of the most important uses of order flow analysis is identifying precise entry and exit levels with greater confidence. Instead of relying only on support and resistance, tools like the Footprint Chart or DOM verify whether strong orders exist there.
Example
Imagine price reaches a support zone, and on the footprint, you see heavy sell orders being absorbed at that level. At the same time, buy volume on the ask side rises sharply, and delta turns positive, showing buyers control the market.
In a footprint example, green and red numbers at each price show buying and selling volume. At a key support level, you may see sellers weakening as buyers absorb sell volume, confirmed by a positive delta.
How to confirm real breakouts and valid pullbacks with order flow
In volatile markets, one common reason traders fail is entering fake breakouts at the wrong moment and getting trapped. Fortunately, order flow tools like the Footprint Chart, delta volume, DOM, and Time & Sales can separate real breaks from deception.
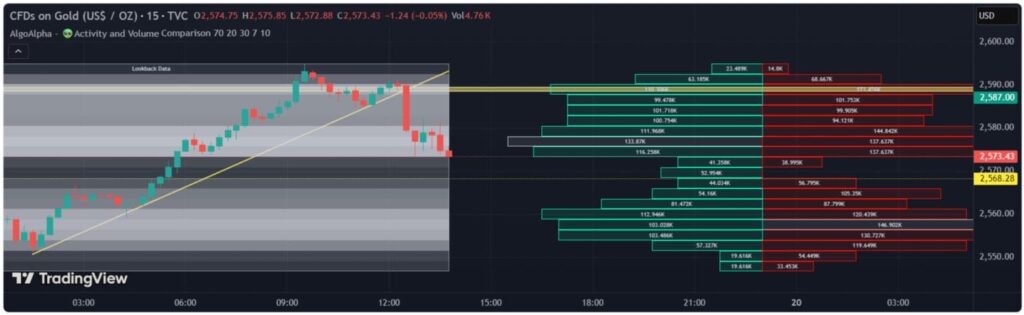
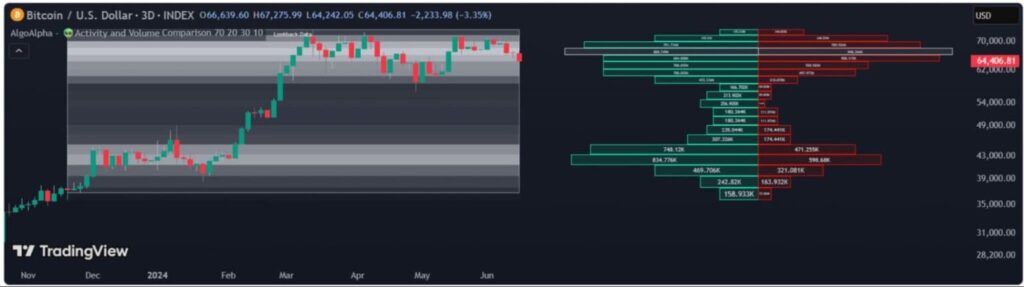
The image below shows an example of a genuine breakout, confirmed by supporting order flow data.
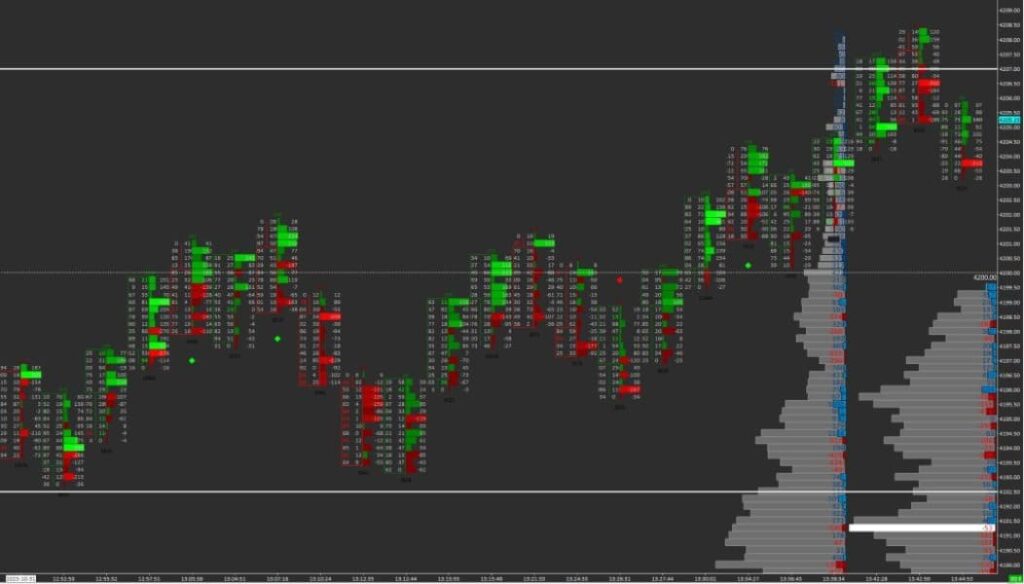
Image analysis:
- On the right side, the volume profile highlights the price levels where the most trading activity occurred.
- In the upper area of the chart, price breaks resistance, and strong green prints signal heavy buying in the right-hand columns.
- Alongside this, delta remains positive and buyer-side volume spikes sharply, reinforcing the strength of the move.
- There is no sign of aggressive selling or strong resistance in the DOM at those levels.
- These conditions clearly suggest a genuine breakout, with a high chance of continuation or a healthy pullback.
Combining order flow with price action to confirm signals
Combining price action with the order flow indicator, especially tools like the Footprint Chart and Volume Delta, often filters false signals effectively.
Price action shows where to consider entering, such as an order block zone, but order flow confirms whether it’s worth trading.
Example:
Imagine price action highlights a bullish order block, and price then returns to that zone:
- On the footprint chart, buying volume increases, shown by strong green prints on the ask side.
- Delta volume is positive, meaning buying pressure outweighs selling pressure at that moment.
- This setup suggests institutional buyers have become active at that level.
- In that case, you can enter with greater confidence and lower risk.
Image explanation (conceptual):
- Highlighted yellow zones or rectangles represent the order block area.
- After the price reaches the zone, ask-side buying volume rises significantly.
- Strong green prints and larger delta readings suggest decisive involvement from larger buyers.
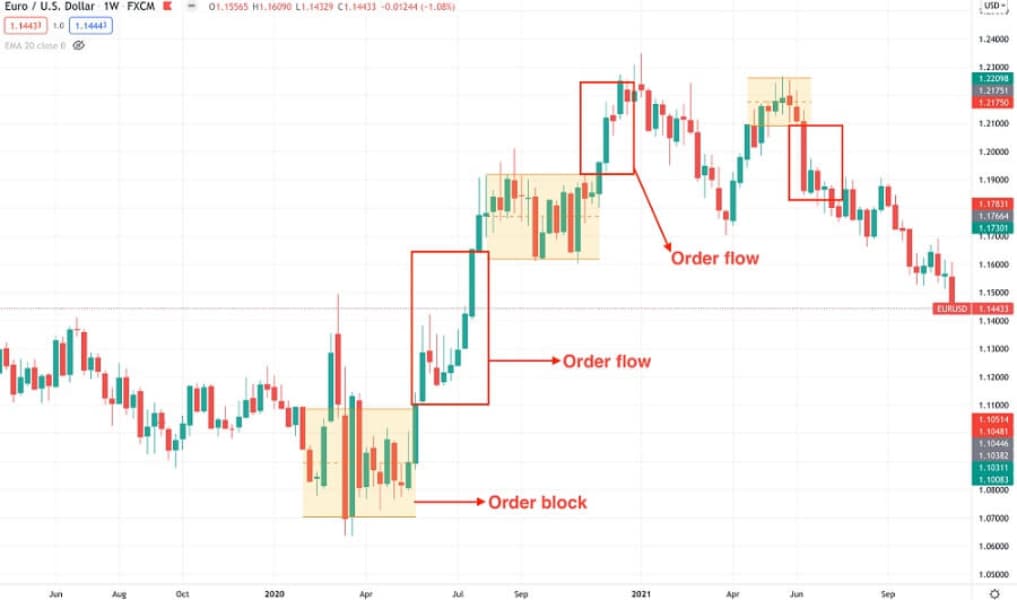
Image explanation:
This chart shows how a price action order block zone can be combined with live order flow data for confirmation:
- The highlighted areas, shown in yellow or boxed rectangles, mark the order block zones on the chart.
- Once the price reaches that zone, the chart shows ask-side buy volume rising sharply and decisively.
- Alongside this, strong green prints and large delta readings indicate significant influence from large buyers.
Q: Can order flow contradict a valid price action setup?
A: Yes. When order flow shows weak participation or opposite aggression, it often warns that a clean price pattern may fail.
Advantages and disadvantages of the Order Flow indicator (Order Flow)
Like other approaches in financial markets, order flow comes with strengths and weaknesses, which we review below.
Advantages of the Order Flow indicator
- Higher accuracy in anticipating price moves
One key benefit of order flow analysis is forecasting price behaviour more precisely using live market data. Because it focuses on real-time information, such as resting order volume, you can read genuine intent sooner. - Fast, low-lag decision-making
Unlike lagging indicators such as moving averages, order flow relies on real-time data rather than delayed calculations. This is especially vital for scalpers and day traders who operate on short timeframes and need rapid confirmation. - Usable on longer timeframes
Many assume order flow is only for short-term trading, but it can also support longer horizons like swing trading. In higher timeframes, you can identify larger imbalances and more stable trends that matter for position planning. - A strong complement to technical analysis
When you combine order flow with technical tools such as price action or RSI, you can confirm or reject signals. This blend gives a wider view of market conditions and reduces reliance on any single method.
Disadvantages and challenges of using order flow
- High costs
Platforms that provide accurate, real-time order flow data usually require a paid subscription. For retail or beginner traders, the cost can become a barrier to adopting this approach seriously. - Complexity and information overload
Order flow data is highly granular, from volume at each price level to separate bid and ask transactions. That detail can overwhelm beginners and make decision-making feel noisier without a clear framework. - Best suited to liquid markets
This method works best in highly liquid markets such as forex, futures, or major equity indices. In thin markets, order flow signals become less reliable because liquidity is patchy and order books distort. - Requires technical expertise
Effective use often involves specialist platforms like NinjaTrader, Bookmap, or ATAS for proper interpretation. Learning these tools and reading the data correctly is a real hurdle for many newer traders.
Conclusion
In summary, order flow analysis gives traders a precise, real-time view of genuine market behaviour. Unlike traditional methods that lean on past prices, it uses live data to support faster, more informed decisions.
With strong order flow pattern recognition, professional platforms, and confirmation from technical analysis or price action, risk improves. However, it still demands specialist training, disciplined execution, and advanced tooling to be used consistently.
Using this indicator, you can also identify more suitable levels for placing a buy stop limit order with better structure.


