


Financial markets rarely move at random. Behind every sharp rally or sudden stop hunt, there is usually a structured sequence driven by liquidity and institutional positioning. This is where the ICT Power of 3 concept becomes powerful.
The ict power of 3 (or ict po3) is a cornerstone of Smart Money concepts. It explains the core cycle of Accumulation, Manipulation, and Distribution. By understanding this framework, traders can identify where “Smart Money” is building positions and avoid getting trapped in false moves. Whether you trade Forex, Gold, or Crypto, mastering the power of three ict concept allows you to see the market’s true intent. This guide will break down the mechanics of the ict power of three and show you how to trade it with precision.

- ICT Power of 3 (PO3) explains market movement in three phases: Accumulation → Manipulation → Distribution.
- PO3 focuses on liquidity and institutional positioning, not random indicators.
Introduction to ICT Power of 3
The ICT Power of 3 (PO3) is a core concept inside the Smart Money methodology. It explains how institutions accumulate positions, manipulate prices to access liquidity, and then distribute into expansion. In simple terms, the power of three ICT concepts answers this question: Why does price move sideways, then sweep highs or lows, and only after that begin a strong trend? Instead of viewing markets as random waves, ict power of 3 treats price as engineered movement. Large participants need liquidity. Retail traders provide it. PO3 shows how that process unfolds in a repeatable structure.The Origin of the Power of Three Concept
The power of three ict model comes from Inner Circle Trader (ICT) teachings. It was developed by Michael J. Huddleston, the founder of ICT, as part of a broader framework focused on liquidity, dealing ranges, and institutional order flow. Based on the ict PO3 concept, every period of price action is separated into three phases:- Accumulation: Institutions build positions quietly.
- Manipulation: Price sweeps liquidity (stop losses).
- Distribution: Real directional move begins.
Why ICT Power of 3 Matters in Smart Money Methodology
Smart Money concepts focus on liquidity, order blocks, fair value gaps, and dealing ranges. The ict po3 model connects them into a sequence. Understanding what the Ict Power of 3 is helps traders avoid “The Messy Middle.” Without this framework, most retail traders buy breakouts that are actually part of the manipulation phase.- Precision: It tells you when to expect a move based on ICT Killzones.
- Risk Control: It provides clear areas for stop-loss placement below manipulation “wick” lows.
- Narrative: It explains the “Why” behind sudden market reversals.

Trading Quote:
"If you don't see the liquidity, you are the liquidity."
How PO3 Differs from Traditional Market Cycles
According to XS, while traditional market cycles like Wyckoff focus on long-term macro trends, the power of three ict is highly versatile. It can be applied to a 1-minute chart or a Monthly chart.
In addition, Traditional cycles focus on supply-and-demand imbalances; however, PO3 ICT looks at liquidity engineering first.
This makes the ict power of 3 strategy especially effective for intraday Forex and index traders who need precise entry timing rather than a broad macro structure.
Table: Traditional Market Cycles vs ICT PO3
| Feature | Traditional Cycles | ICT Power of 3 (PO3) |
|---|---|---|
| Primary Focus | Supply and Demand zones | Liquidity Engineering & Time |
| Duration | Can take weeks or months | Can form in a single day or session |
| Trigger | Volume and pattern breaks | Opening price and liquidity sweeps |
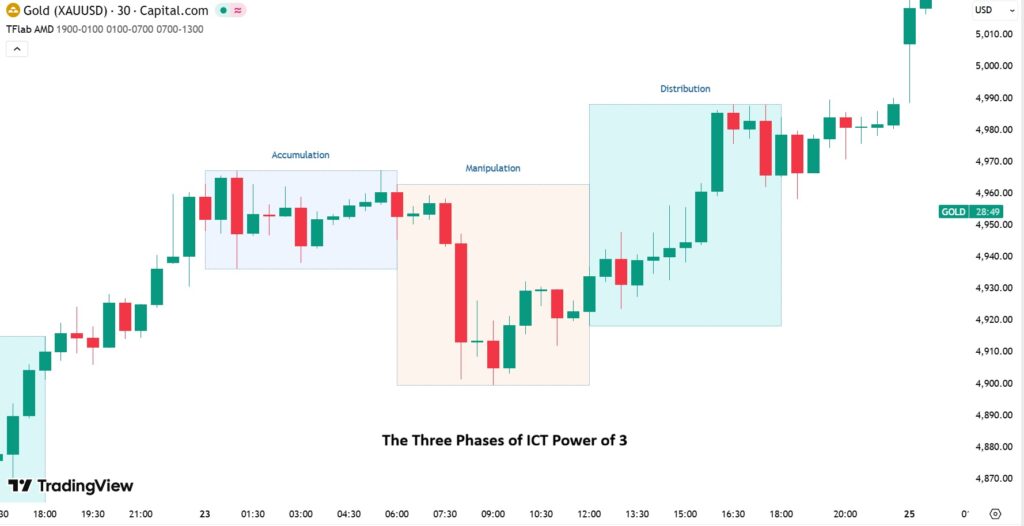
The Three Phases of ICT Power of 3
The ict power of 3 (PO3 ICT) breaks a market move into a simple sequence:
- build liquidity (Accumulation)
- grab it (Manipulation)
- Expand (Distribution)
By identifying these main phases, traders can decode the “footprints” of institutional players and avoid common retail traps.
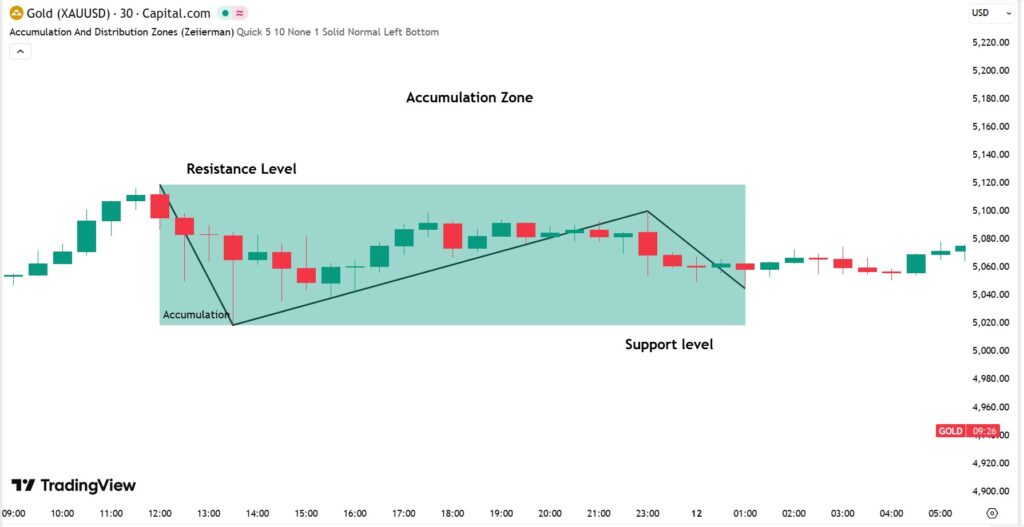
Accumulation
According to howtotrade, accumulation is the phase where the price moves in a tight range. This range action creates Equal Highs and Equal Lows (EQH and EQL).
During this time, Smart Money participants are building their positions around support and resistance levels. Retail traders place their stop-losses just above the resistance and below the support levels, effectively creating liquidity pools that the market will later seek to exploit.
In Po3 ict trading, this sideways movement is the “energy” being stored for the next move.
Accumulation usually occurs when the market is waiting for a specific time or news event or in off-peak trading sessions (like the Asian session).
Manipulation
The Manipulation phase is the heart of the power of three ict concept. It is a deliberate “Judas Swing“—a move in the opposite direction of the true intended trend.
The mechanism of manipulation is as follows:
- Market Engineering: Institutions drive price to sweep the liquidity pools created during Accumulation. If the day is meant to be bullish, the price will first drop aggressively to “grab” sell-side liquidity.
- False Moves: This move convinces retail traders that a breakout is happening in the wrong direction, forcing them into “trapped” positions right before the market reverses. This is the ultimate ict power play to find counter-parties for large orders.
Q: Why does manipulation happen?
A: Large institutions cannot enter the market without enough counterparty liquidity. They must trigger stop losses (sell orders) to fill their massive buy orders at a better price.
Distribution
The final phase is Distribution. This is where the true directional move occurs. Once liquidity has been captured during Manipulation, the market is “cleared” for a high-momentum expansion.
The mechanism of distribution is as follows:
- Price Expansion: This leg is typically the largest and fastest part of the ict power of 3 strategy.
- Imbalances: You often see large candles that leave behind Fair Value Gaps (FVGs). This is a sign of efficient Smart Money delivery, where price is “pushed” to its ultimate target (the profit-taking zone).
Market Liquidity in the ICT Power of 3 Framework
Liquidity is the “oxygen” of the financial markets. In the ict power of 3 framework, price does not move because of RSI crossovers or moving average touches; it moves to find pools of money. Large institutions require significant volume to fill their orders, and that volume is found where retail traders place their stop losses. Understanding where this liquidity sits is the secret to mastering the power of the three ICT concepts.
Buy-Side and Sell-Side Liquidity Pools
In ict power-of-3 logic, “liquidity” usually refers to where stop and breakout orders are placed. Those orders serve as fuel because they are easy to trigger and can create sudden volume.
- Buy-side liquidity (BSL) sits above obvious highs. It’s made of buy stops (shorts getting stopped), breakout buys, and pending buy orders.
- Sell-side liquidity (SSL) sits below obvious lows. It’s made up of sell stops (longs getting stopped out), breakdown sells, and pending sell orders.
As mentioned in TradingFinder, in an ict po3 setup, the Manipulation phase is specifically designed to run into one of these pools to “collect” the necessary orders for the real move.
Example (EURUSD, M15):
Price prints two equal highs at 1.1020 during Asia. Stops cluster at 1.1022–1.1028 (BSL). If London spikes to 1.1026 then snaps back under 1.1020, that’s often a liquidity raid — not “bull strength”.
Q: Is a stop run always manipulation?
A: No. But in ict po3, a sweep that fails to hold and quickly returns inside the range is a strong manipulation clue.
Internal vs External Liquidity Targets
Dealing range (DR) is the high-to-low box you’re using as the reference in ICT PO3 trading (for example, the Asia session high/low or a clear swing high/low).
Once you have a DR, liquidity targets are split into two types:
- Internal liquidity sits inside the dealing range. It includes the midpoint (EQ/50%), small swing highs/lows, minor imbalances, and small Fair Value Gaps (FVGs).
- External liquidity sits outside the dealing range. It includes stops above the range high or below the range low, as well as common magnets like PDH/PDL (prior day high/low) and major swing points.
Example (Gold): Assume the DR is $2,030–$2,040.
- Internal target: midpoint $2,035
- External targets: stops above $2,040 and below $2,030
In many ict power of 3 strategy setups:
- Internal liquidity is often tapped during accumulation,
- then manipulation raids an external pool first (e.g., $2,040.50) before distribution expands toward the opposite side.
How Liquidity Drives PO3 Phase Transitions
Each PO3 phase is basically a liquidity job.
1) Accumulation = liquidity builds
Institutions position quietly while price prints equal highs/lows. Liquidity pools become visible.
2) Manipulation = liquidity gets harvested
Price makes a false move to grab stops (BSL or SSL). That sweep creates the fuel and the fill conditions.
3) Distribution = liquidity gets delivered into
After the raid, the price expands toward the next target (often the opposing external pool), leaving displacement and imbalances.
Dealing Range, Timing, and Session Influence
The power of three ict does not happen in a vacuum; it is governed by the laws of time and price. Without the correct “Killzone” timing, a PO3 structure loses its high-probability status.
Mapping PO3 Within the Dealing Range
A dealing range (DR) is your anchor. Without it, “premium/discount” becomes guesswork and your ICT power read turns sloppy.
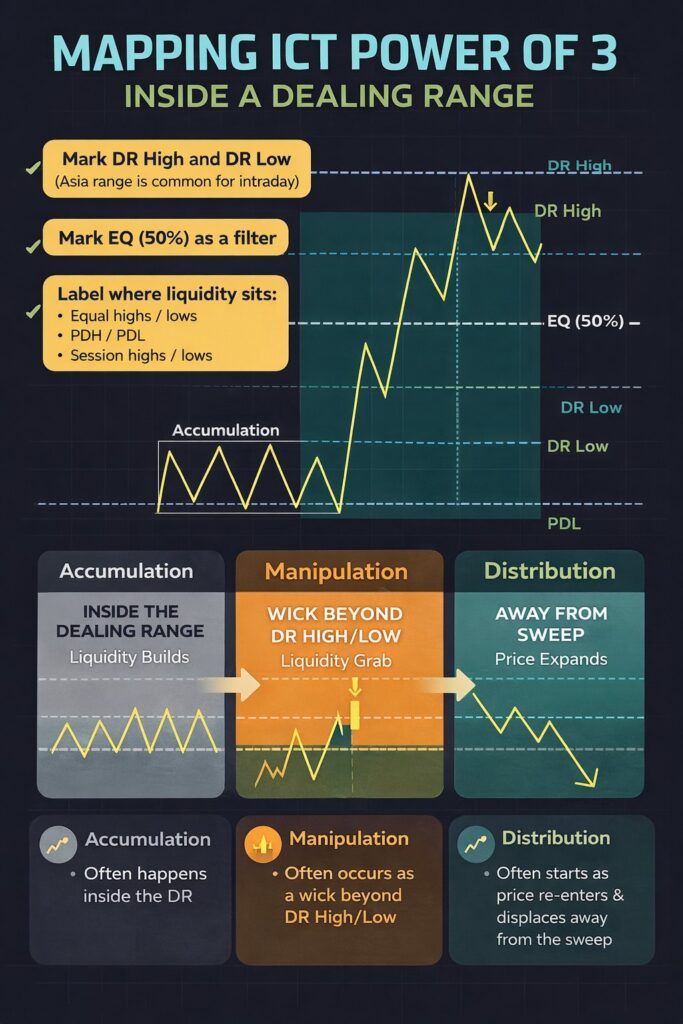
A practical way to map ict power of 3 inside a DR:
- Mark DR High and DR Low (Asia range is common for intraday).
- Mark EQ (50%) as a filter.
- Label where liquidity sits: equal highs/lows, PDH/PDL, session highs/lows.
Then watch how PO3 unfolds around the edges:
- Accumulation often happens inside the DR.
- Manipulation often occurs as a wick beyond DR High/Low.
- Distribution often starts when the price re-enters and displaces away from the sweep.
Example (GBPUSD):
Asia DR: 1.2680–1.2710, EQ 1.2695.
If London sweeps 1.2712 and quickly drops back under 1.2710, treat it as a manipulation event within the DR framework, not a breakout.
Q: How do I know the distribution started?
A: After the sweep, you need a strong close back inside the range + displacement away, not just a wick. If you don’t get that, it’s just noise, not po3 ict trading.
Trading Rule:
If you can’t define the dealing range, you can’t define the trade.
Premium vs Discount Pricing and Price Behaviour
In power supply ICT terms, premium/discount is not a slogan. It’s a pricing filter that keeps you from buying high and selling low. Once your DR is set:
- Discount = lower half of the DR (better risk for longs).
- Premium = upper half of the DR (better risk for shorts).
- EQ (50%) = balance point; price often reacts here.
Example (Gold DR: $2,030–$2,040):
- Discount: $2,030–$2,035
- Premium: $2,035–$2,040
If manipulation sweeps below $2,030 (SSL) and price reclaims the DR, a long taken from discount has cleaner logic than chasing it at $2,039.
Q: If I’m bullish, should I buy in the premium?
A: You can, but it’s usually trash risk. In PO3, the best longs often appear after a sell-side sweep and reclaim back into the DR (discount-to-expansion logic).
Session Timing, Killzones, and Phase Recognition
PO3 becomes easier when you respect time. Liquidity raids are not evenly distributed across the day. They cluster around session opens when volume spikes.
Common intraday pattern:
- Asia Session: Often acts as the Accumulation phase, creating the initial range.
- London Killzone: Typically hosts the Manipulation (the Judas Swing).
- New York session: Usually provides the Distribution expansion or a continuation of the London move.
Pro Tip:
If you see an accumulation range in Asia and a sweep of the Asia Low during the London Open, you are likely witnessing the start of a bullish ict po3 distribution.
How to Identify ICT Power of 3 on a Chart
Identifying the ict power of 3 on a live chart is the bridge between theory and profit. Many traders know what the ict power of 3 is, but they struggle to spot it before the move. The key is to stop looking at indicators and start looking at time and price signatures.
To spot a valid PO3 ict setup, look for a specific geometry:
- a box (range),
- a fake-out (wick),
- and a trend (expansion).
Visual Clues Across Accumulation, Manipulation, Distribution
Each phase leaves a distinct visual fingerprint on the chart.
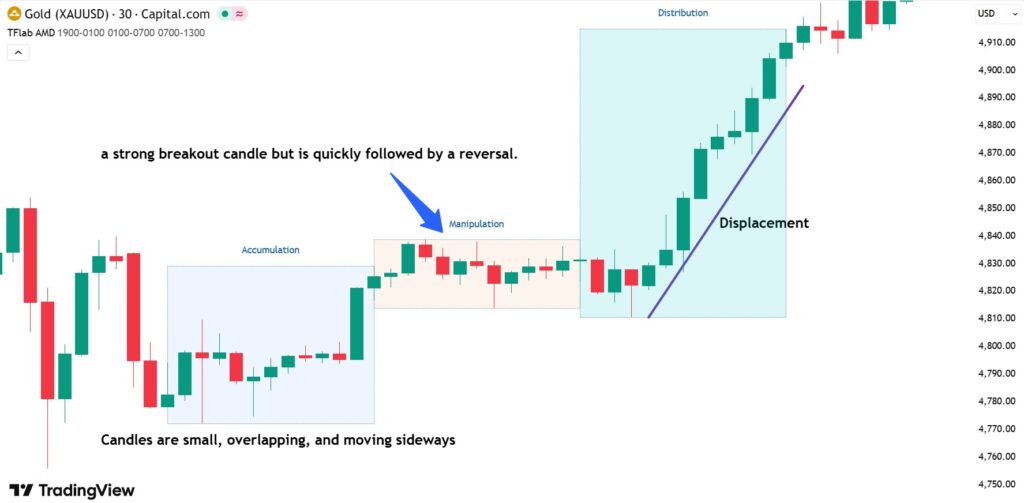
- Accumulation (The Box): Look for “dead” price action. Candles are small, overlapping, and moving to the side. This often creates a clear horizontal channel.
- Visual Tip: If the market looks boring, it is likely accumulating.
- Manipulation (The Trap): Look for a sudden, aggressive spike that breaks the accumulation box. According to FXopen, it often looks like a strong breakout candle in the opposite of the expected trend, but is quickly followed by a reversal.
- Visual Tip: On a higher timeframe, this phase often appears as a long wick or “shadow.”
- Distribution (The Trend): Look for Displacement. These are large, energetic candles that close near their highs or lows, often leaving behind Fair Value Gaps (FVGs).
Rule of Thumb:
"Consolidation tells you where orders are building. The Wick tells you when the move is starting."
Using Liquidity Levels for Confirmation
You cannot trade ict power of 3 in the middle of nowhere. You need a point of interest to confirm the manipulation is real.
The most reliable confirmations occur when price interacts with major liquidity levels:
- Previous Day High (PDH) or Low (PDL)
- Session Highs/Lows (e.g., Asian High)
- Equal Highs/Lows (EQH/EQL)
Numeric Example: Imagine GBPUSD is accumulating at 1.2500.
- Scenario A: Price breaks 1.2480, hits a random level, and stalls. (Low probability).
- Scenario B: Price breaks 1.2480, sweeps the Previous Day Low at 1.2475, and immediately reclaims 1.2500. (High probability ict po3 reversal).
The sweep of 1.2475 confirms that the move was a “Liquidity Raid,” not a breakout.
Multi-Timeframe PO3 Recognition Techniques
The power of the three ict concepts is fractal, meaning it happens on all timeframes simultaneously.
- The Daily Candle: A classic bullish daily candle consists of an Opening price, a drop to create the Low of the day (Manipulation), and a rally to the High (Distribution).
- The Intraday Chart: That “drop” on the Daily candle is actually a full Accumulation → Manipulation → Distribution cycle on the 15-minute chart.
A good strategy tip is as follows:
- Use D1/4H to find external targets (PDH/PDL, swing highs/lows).
- Use H1/M15 to define the dealing range.
- Use M5/M1 to time the sweep and displacement for entry.
Q: Can I trade PO3 against the higher timeframe trend?
A: It is risky. The strongest ict power distribution moves occur when the lower-timeframe PO3 aligns with the higher-timeframe direction.
ICT Power of 3 Trading Strategy
A strategy needs rules: where to enter, when to enter, what confirms, and where you’re wrong. PO3 gives you the sequence. Your job is to trade only the part with an edge: the transition from manipulation to distribution.
Entry Models Within Manipulation Phases
The manipulation leg is where most traders lose money because they either:
- trade the breakout
- or enter before confirmation.
In ict po3 strategy, you don’t buy the sweep; you buy the reversal after the sweep.
Three practical entry models:
1) Sweep + Reclaim (cleanest model)
- Price takes external liquidity (e.g., runs equal lows).
- Price closes back inside the dealing range.
- You enter on the first pullback toward the reclaim level.
2) Sweep into Discount Array (Order Block / FVG)
- Liquidity sweep drives into a discount zone.
- You enter a bullish order block or into a small FVG after displacement.
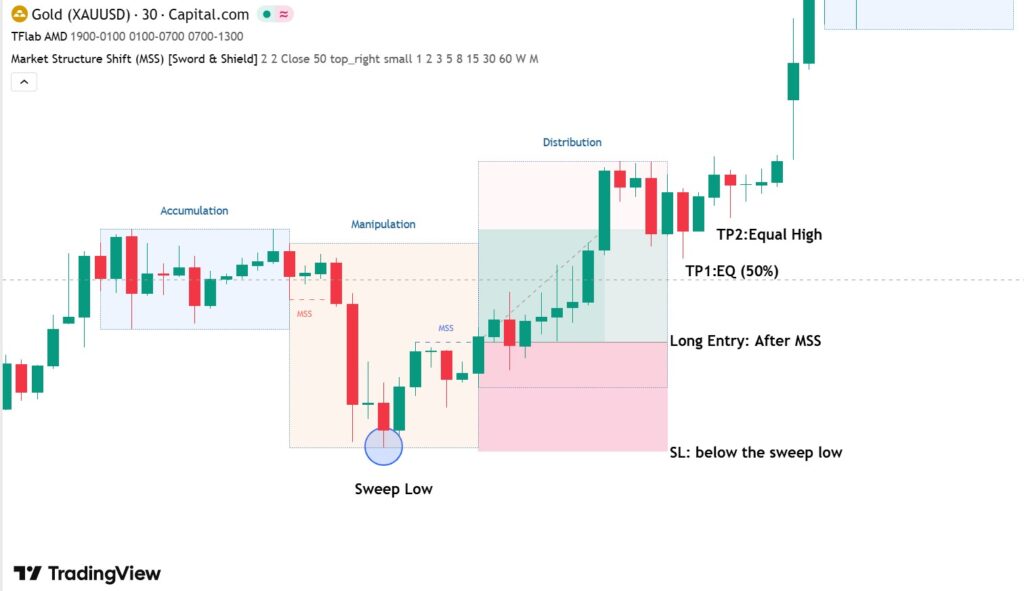
3) MSS (Market Structure Shift) confirmation
If you want extra safety, after the sweep, wait for a break of a minor swing high (bullish) or swing low (bearish). Then enter the retrace.
Executing Trades During Distribution
Distribution is where the money is, but only if you trade it like a professional: targets, partials, and liquidity objectives.
Common distribution execution plan:
- Entry: after sweep + reclaim, or after displacement into a PD array.
- Target 1 (internal): EQ (50%), internal swing, or small imbalance fill.
- Target 2 (external): opposite side liquidity — DR High/Low, PDH/PDL, equal highs/lows.
- Target 3 (optional): next higher-timeframe liquidity (weekly high/low, major swing).
Stop Placement Beyond Liquidity Sweeps
Stop placement in po3 ict trading is simple in theory and sloppy in practice. Your stop should sit where your setup is invalid, not where it “feels safe.”
Rules that actually work:
- If you’re long after an SSL sweep, your stop goes below the sweep low (below the liquidity raid).
- If you’re short after a BSL sweep, your stop goes above the sweep high.
Example (EURUSD long):
Sweep low = 1.0992. Your stop should be below 1.0992 (e.g., 1.0988), not randomly below the midpoint.
Two common stop mistakes (and they’re deadly):
- Too tight: stop inside the range → you get wicked out before distribution.
Too wide: stop far away → your R: R collapses, and one loss wipes multiple wins.
Practical filter:
If the stop beyond the sweep makes your trade risk-to-reward ratio less than 1:2, skip it. You’re not obligated to trade every PO3.
ICT Power of 3 Indicators
Most ict power of 3 indicator scripts are not “reading smart money.” They are pattern detectors.
How PO3 Indicators Attempt Detection
Most ict power of 3 indicator try to approximate PO3 by converting messy price action into simple rules, such as:
- Identify a range (often using a fixed lookback or session box) → label it “Accumulation”
- Detect a stop run beyond the range high/low → label it “Manipulation”
- Confirm a breakout with momentum (big candles / ATR expansion) → label it “Distribution”
Some tools also add extras:
- Highlight equal highs/lows as liquidity pools
- Mark PDH/PDL and session highs/lows
- Plot the EQ (50%) line of the dealing range
- Trigger alerts when price “sweeps and re-enters”
That’s useful as a checklist. But it’s not real PO3 understanding.
Limitations of Automated Tools
Here’s the hard truth: PO3 is context-dependent, and indicators hate context.
Common limitations of automated tools are as follows:
- False PO3 labels: a script calls any sideways chop “accumulation,” even in the middle of a trend.
- Wrong dealing range: the indicator uses a random box, not your session/swing dealing range.
- No liquidity intent: it can’t tell if a wick is a true raid or just volatility.
- Late signals: “distribution” often prints after the move is mostly done.
- Parameter dependency: changing the timeframe, volatility regime, or session breaks the “ict po3” detection.
Manual vs Indicator-Based Analysis
Both methods have their strengths:
Indicator-based analysis strengths
- Faster marking of ranges, PDH/PDL, EQ, and equal highs/lows
- Helpful alerts for “sweep + reclaim” events
- Good for scanning multiple pairs quickly
Manual analysis strengths
- You choose the correct dealing range (session or swing)
- You judge whether a sweep is meaningful (liquidity + timing + displacement)
- You align PO3 with higher timeframe targets and bias
- You avoid trading “pretty labels” that don’t match the market narrative
The best approach is a hybrid one. Use an indicator to mark your Reference Points (Midnight Open, 8:30 AM Open), but use your own analysis to identify the ict po3 structure.
Key insight:
If an indicator says “Distribution” but you don’t see real displacement and a clear liquidity objective, ignore it. The chart is the source of truth, not the script.
Table: ICT Power of 3 Indicators
| Topic | What PO3 indicators typically do | Why it’s useful | Where it fails (common traps) | Best practice |
|---|---|---|---|---|
| PO3 detection logic | Uses rules to label range = accumulation, sweep = manipulation, momentum breakout = distribution | Quick visual structure and alerts | Labels any chop as accumulation and any wick as manipulation | Treat labels as hints, not signals |
| Dealing Range (DR) | Auto-boxing via lookback or session windows | Saves time marking DR | Wrong DR = wrong premium/discount and wrong targets | Manually set DR (Asia range / swing DR) before trusting anything |
| Liquidity pools | Marks equal highs/lows, PDH/PDL, session highs/lows | Faster liquidity mapping | Can’t judge intent (real raid vs random volatility) | Use liquidity marks + require reclaim + displacement |
| Entry timing | Triggers on “sweep + re-entry” or “breakout” | Good for scanning and alerts | Often late; breakout entries get trapped in manipulation | Enter on retrace into FVG/OB after displacement, not on first break |
| Trend/context | May add MA/ATR filters | Helps avoid some noise | Still weak at HTF bias and regime shifts | Always confirm with HTF targets (PDH/PDL, swing points) |
| Parameter sensitivity | Lookback/session inputs | Customisable | Breaks when volatility/timeframe changes | Keep settings stable; don’t curve-fit |
| Manual analysis | You define DR, targets, and phase transitions using price action | Highest accuracy | Slower; requires skill | Combine: indicator for marking, manual for decision |
Combining ICT Power of 3 With PD Arrays
PO3 gives you the sequence. PD arrays give you the entry location. If you trade ict power of 3 without PD arrays, you’ll enter too early, too late, or in the middle of nowhere. If you trade PD arrays without PO3, you’ll “buy every order block” and get punished.
The clean workflow is: PO3 phase → liquidity raid → displacement → PD array retrace → entry
Order Blocks as PO3 Confluence Zones
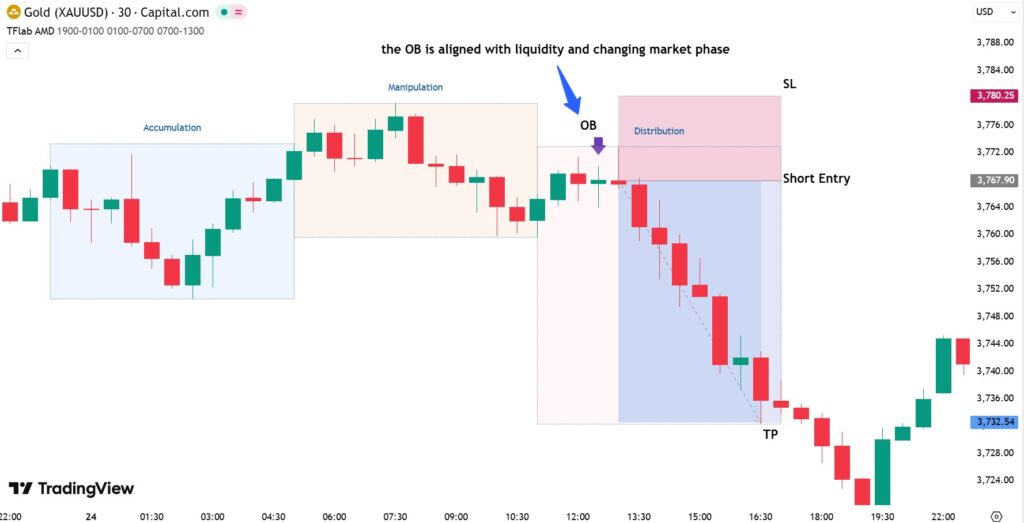
An order block (OB) is commonly treated as the last opposing candle before displacement. In PO3 terms, OBs matter most when they sit at the turning point between manipulation and distribution.
If the OB is not aligned with liquidity + phase, it’s just a rectangle on your chart.
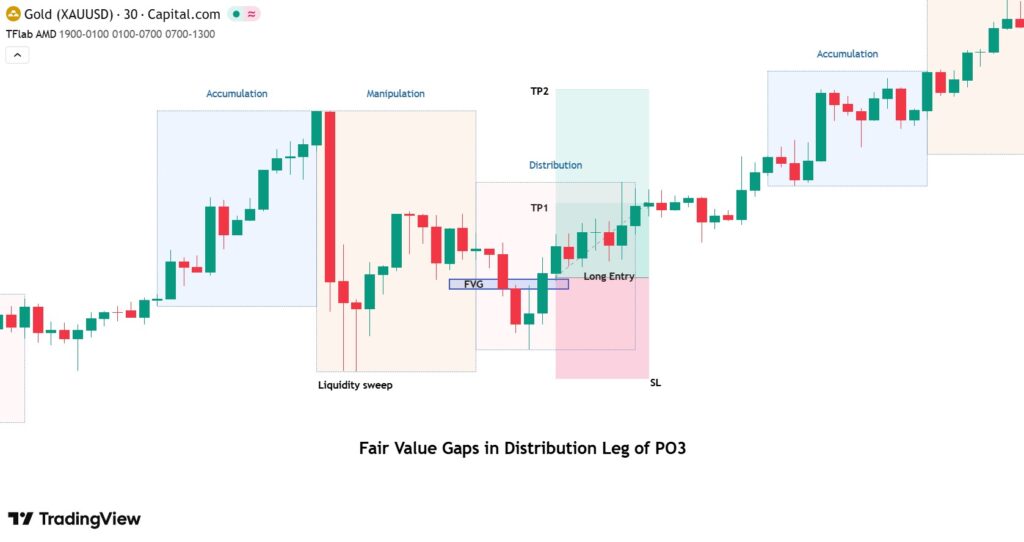
Fair Value Gaps in Distribution Legs
Fair Value Gaps (FVGs) usually appear during distribution because that’s when displacement occurs. They represent inefficiency created by aggressive buying/selling.
How to use them in ict po3 strategy:
- Wait for the sweep (manipulation)
- Confirm real displacement (distribution starts)
- Mark the FVG formed by the displacement candle(s)
- Enter the retrace into the FVG (often the 50% “mean threshold” is used, but keep it simple: first clean touch)
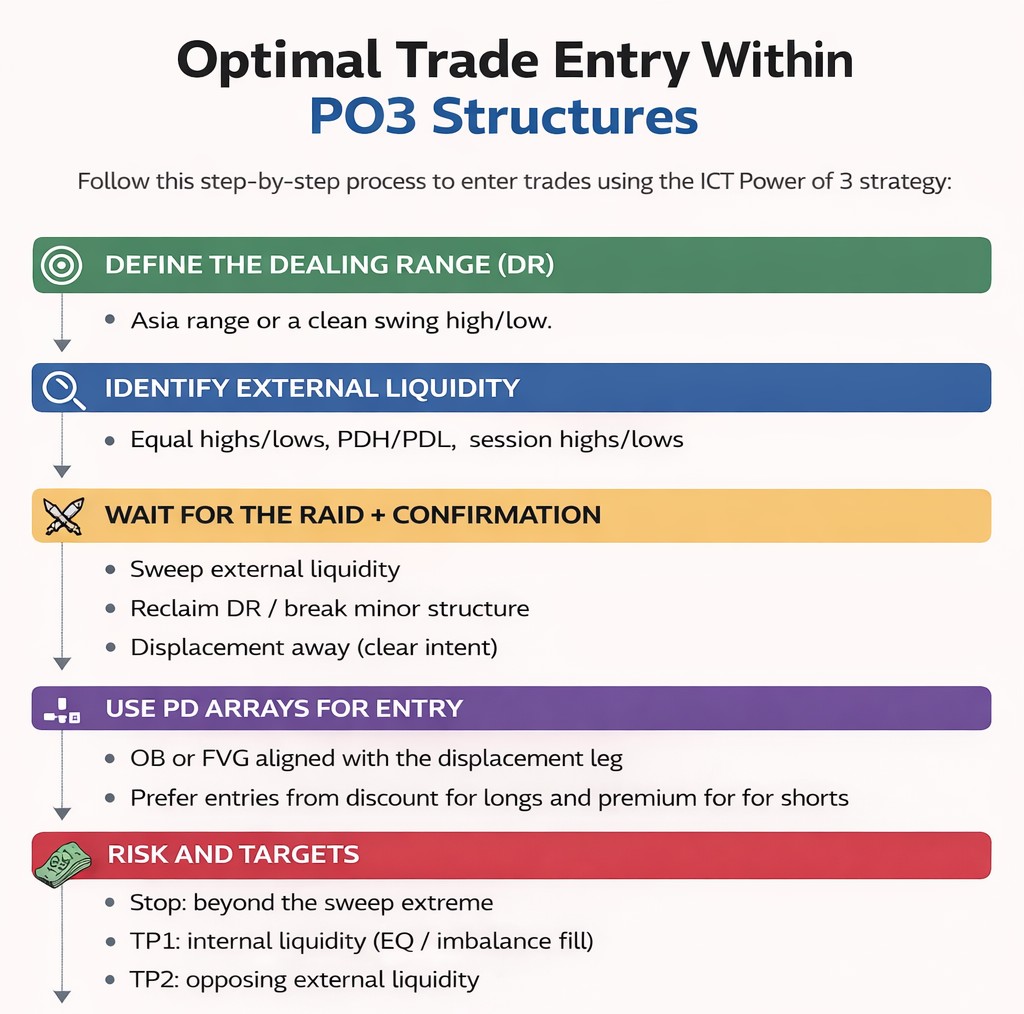
Optimal Trade Entry Within PO3 Structures
Here’s the entry model that doesn’t rely on hope:
1) Define the dealing range (DR)
Asia range or a clean swing high and swing low.
2) Identify external liquidity
Equal highs/lows, PDH/PDL, session highs/lows.
3) Wait for the raid + confirmation
- Sweep external liquidity
- Reclaim DR / break minor structure
- Displacement away (clear intent)
4) Use PD arrays for entry
- OB or FVG aligned with the displacement leg
- Prefer entries from discounts for longs and premiums for shorts
5) Risk and targets
- Stop: beyond the sweep extreme
- TP1: internal liquidity (EQ/imbalance fill)
- TP2: opposing external liquidity
Common Mistakes When Trading ICT Power of 3
Most traders don’t fail because ict power of 3 “doesn’t work.” They fail because they label everything as PO3 and then trade like amateurs. PO3 is a sequence, not a magic stamp you slap on random candles.
Misidentifying Accumulation Ranges
The first mistake is calling any sideways price action “accumulation.” That’s lazy, and it destroys your dealing range.
A valid accumulation range usually has:
- Clear boundaries (range high / range low)
- Multiple touches (equal highs/lows often form)
- A logical time context (Asia range, pre-news consolidation, pre-open compression)
Trading Manipulation Prematurely
In ict po3 strategy, you don’t trade the sweep. You trade the confirmation after the sweep.
Manipulation is designed to make you do something stupid. Most traders:
- Buy the breakout above the range high
- Sell the breakdown below the range low
…and then get reversed on.
If you enter during the wick, you’re guessing. And guessing is not a strategy.
Q: What if it sweeps and keeps going?
A: Then it wasn’t “manipulation” for reversal, it was continuation. That’s why confirmation matters.
Ignoring Higher-Timeframe Liquidity Context
This is the silent killer. A beautiful PO3 on M5 means nothing if you’re trading into a higher-timeframe liquidity wall.
Common mistakes:
- Shorting when the price is sitting on daily sell-side liquidity (major low)
- Longing directly into PDH/weekly high without a clear target beyond
- Ignoring that your “distribution” target is already filled on HTF
Best practice:
- Use 4H/D1 to mark major liquidity: PDH/PDL, weekly highs/lows, major swing points
Use M15/M5 to execute the PO3 entry
Key insight
If a lower-timeframe PO3 aligns with the higher-timeframe draw on liquidity, the move tends to have clean follow-through. If it doesn’t, you’re trading chopped leftovers.
Real-Market Examples of ICT Power of 3
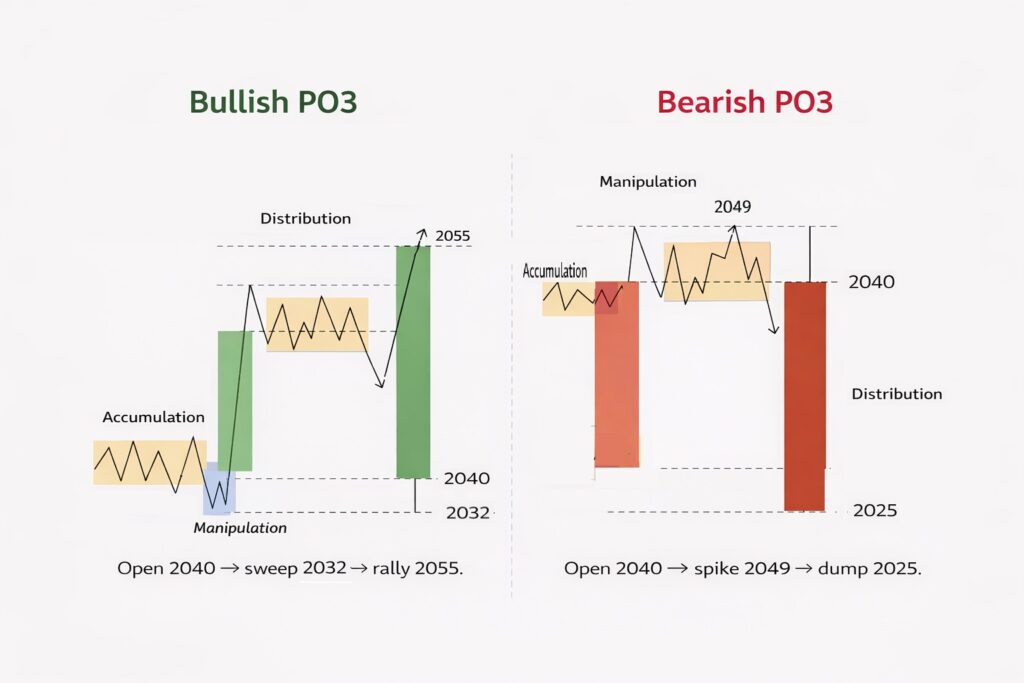
Bullish PO3 Formation Breakdown
According to Innercircletrader, in a bullish ICT Power of 3 (AMD) day:
- The daily open acts like a reference point. Price often ranges near the open first. That’s the accumulation.
- Next comes the trap: price drives below the open and targets an obvious old low. That downside push pulls in breakout sellers and triggers stops. This is the manipulation leg.
- Then the real move starts. Price reverses and expands higher in distribution, often aiming for old highs / buy-side liquidity, and the daily candle may print a lower wick as evidence that the sell move was rejected.
Simple numbers (example):
Open 2040 → sweep 2032 → rally 2055.
Bearish PO3 Market Structure
Bearish PO3 is the mirror image:
- Price first consolidates near the open (accumulation).
- Then manipulation runs above the open into an old high, triggering buy stops and attracting breakout buyers.
- After liquidity is taken, the price expands lower in distribution toward old lows/sell-side liquidity, and the daily candle can leave an upper wick as the “failed rally” signature.
Simple numbers (example):
Open 2040 → spike 2049 → dump 2025.
Intraday vs Swing Trading Applications
The ict power of three is framed primarily as an intraday approach: build a daily bias, then drop to lower timeframes like 15-minute and 5-minute to catch the distribution leg.
So if you’re “swing trading” PO3, you’re usually doing this:
Use a higher-timeframe bias, but still time entries intraday using the AMD sequence — then manage the position for longer.
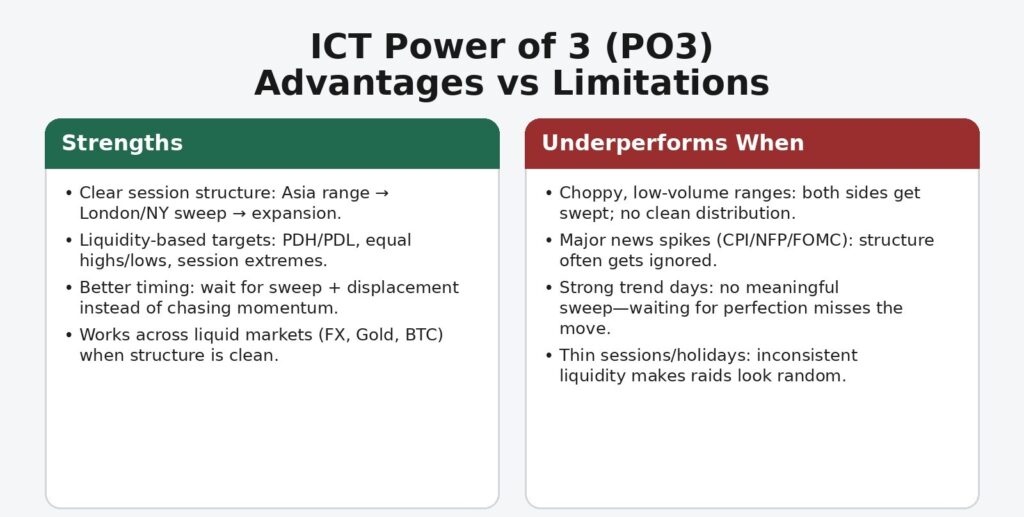
Advantages and Limitations of ICT Power of 3
Like any strategy, the ICT Po3 has its own limitations and advantages.
Strengths in Predicting Institutional Moves
The biggest advantage of ict power of 3 is that it forces you to think like liquidity. Institutions need size. Size needs liquidity. PO3 provides a clear narrative of how that liquidity is built and harvested before the real move.
Where it shines:
- Clear session structure: Asia range → London/NY sweep → expansion is a common pattern in FX and indices.
- Liquidity-based targeting: it naturally points you toward logical magnets like PDH/PDL, equal highs/lows, and session highs/lows.
- Better timing: it helps traders avoid entering during “random momentum” and instead wait for sweep + displacement, where the best R:R usually shows up.
- Works across markets: the logic transfers well from EURUSD to XAUUSD to BTC when markets are liquid and moving with a clean structure.
Market Conditions Where PO3 Underperforms
PO3 can look perfect on charts and still fail because the market environment is wrong.
PO3 tends to underperform when:
- Choppy, low-volume ranges: price keeps sweeping both sides, never delivering a clean distribution leg.
- Major news volatility: CPI/NFP/FOMC can blow through liquidity levels with zero respect for clean phase transitions.
- Strong one-direction trend days: sometimes there is no meaningful accumulation or manipulation — price just trends. If you sit waiting for a “perfect sweep,” you miss the move.
- Thin liquidity sessions: during late NY or holidays, liquidity is inconsistent, so “raids” can be random rather than engineered.
Warning:
Many traders cause their own failure: they label any three-part move as PO3. That’s not edge. That’s pattern addiction.
Risk Management Considerations
If your risk rules are weak, PO3 won’t save you. It will just give you nicer-looking losses.
Practical PO3 risk rules:
- Stops go beyond the sweep extreme (below sweep low for longs, above sweep high for shorts).
- Position sizing must match the stop: fixed % risk (e.g., 0.5%–1%) is smarter than “same lot size every trade.”
- Demand R:R: if your stop beyond the sweep gives you less than 1:2 to the next liquidity target, skip it.
- Scale targets logically: TP1 internal liquidity (EQ/imbalance), TP2 opposing external liquidity (PDH/PDL/range edge).
- Avoid revenge trading after a failed sweep: multiple sweeps on both sides usually means chop — reduce risk or stand down.
Conclusion
ICT Power of 3 (PO3) simplifies market behaviour into a repeatable cycle: Accumulation builds liquidity, Manipulation raids it, and Distribution delivers the real move. Once you stop chasing indicator signals and start tracking liquidity pools, dealing ranges, and session timing, PO3 becomes a practical framework for cleaner entries, tighter invalidation points, and more logical targets. The edge comes from trading after the sweep, not during it—especially when lower-timeframe PO3 aligns with higher-timeframe liquidity objectives.