


The PVI indicator (Positive Volume Index) is a volume-based tool that measures bullish trend strength by analysing price behaviour during sessions of increasing trading volume.
Built on the premise that volume reflects market sentiment, particularly retail participation, the PVI indicator helps traders assess trend reliability and identify potential entry points.

- The PVI indicator tracks the behaviour of retail and emotionally driven investors who are most active on high-volume trading days.
- PVI indicator updates only when trading volume increases compared to the previous session; otherwise, the indicator remains flat.
- By design, the PVI indicator excludes smart money activity, which typically occurs during low-volume periods and is commonly analysed using the NVI indicator.
What Is the PVI Indicator?
The PVI indicator (Positive Volume Index) is a cumulative indicator that tracks price changes on sessions where trading volume rises relative to the previous session.
In other words, the PVI indicator operates only during high-volume market conditions, with its movements reflecting the strength of buying and selling pressure on a given session.

How Is the PVI Indicator Calculated?
The PVI indicator is calculated using a rule: when today’s trading volume exceeds the previous session’s, the index updates according to the percentage price change.
According to TradingTechnologies, the PVI indicator formula is:

In this formula:
- PVI Today: The newly calculated value of the PVI indicator.
- PVI Yesterday: The indicator’s value from the previous trading session, used as the calculation base.
- Today’s Closing Price: The asset’s closing price for the current trading day.
- Previous Closing Price: The asset’s closing price from the prior trading session.
- (Previous Closing Price − Today’s Closing Price ) / Previous Closing Price: This ratio measures the percentage change in price compared to the previous day.
However, if today’s trading volume is lower than or equal to yesterday’s volume:

This formula shows that the PVI indicator changes only on days when trading volume increases. If volume does not rise, the indicator simply carries forward its previous value.
Example
Assume we want to calculate the PVI for a stock over three consecutive trading days, starting with an initial PVI value of 1,000.
Day 1 (Base Day)
- Closing price: 2,000
- Trading volume: 100,000
- PVI today: 1,000 (initial value)
Day 2
- Closing price: 2,100 (+5%)
- Trading volume: 120,000 (higher than Day 1)
Since trading volume has increased, we apply the first formula:
- Price change = (2,100 − 2,000) / 2,000 = 0.05
- PVI today = 1,000 + (0.05 × 1,000) = 1,050
Day 3
- Closing price: 2,150 (+2.38%)
- Trading volume: 90,000 (lower than Day 2)
As trading volume has declined, the second formula applies, and the PVI remains unchanged:
- PVI today = PVI yesterday = 1,050
As this example illustrates, although the price increased on Day 3, the PVI indicator remained flat because trading volume was lower than on the previous day.

Key Insight:
The PVI indicator tends to be more adaptable than price-based indicators in markets with structural interventions, such as price limits or minimum trading volume requirements.
Difference Between the Positive Volume Index (PVI) and the Negative Volume Index (NVI)
The Negative Volume Index (NVI) works oppositely to the PVI indicator. While the PVI focuses on high-volume trading days, the NVI measures price movements on days when trading volume declines.
| Feature | PVI (Positive Volume) | NVI (Negative Volume) |
|---|---|---|
| Trigger | Volume Increases | Volume Decreases |
| Who it Tracks | The Crowd (Retail Investors). | Smart Money (Institutions). |
| Market Phase | High Emotion / News Events. | Accumulation / Quiet Trends. |
| Best Use | Confirming a public trend. | Spotting hidden accumulation. |

How the PVI Indicator Works in Volume Analysis
In this section, we explain how the PVI indicator confirms the strength of a bullish trend and highlights periods when retail investors are actively entering the market.
Analysing Market Behaviour During Rising Volume
An increase in trading volume does not automatically indicate a strong or sustainable trend. In many cases, elevated volume simply reflects a short-term market reaction to new information rather than a structural shift in trend dynamics. The key analytical challenge is distinguishing between trend-confirming volume and reactive, event-driven volume.
The PVI indicator helps address this challenge by focusing on sessions in which trading volume expands relative to the previous period. When the PVI rises steadily over multiple sessions, it suggests that new and sustained participation is entering the market, reinforcing the existing trend. This type of volume expansion typically supports trend continuation.
In contrast, sharp but short-lived movements in the PVI often point to emotional or news-driven activity rather than durable market commitment. In such cases, volume spikes may create temporary price momentum without providing a reliable foundation for a longer-term move.
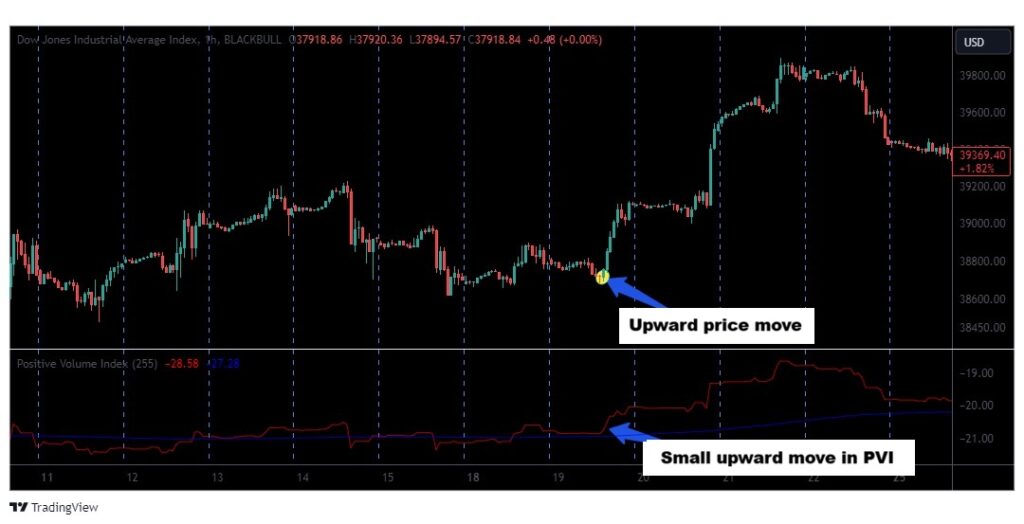
Example:
If a stock price jumps following positive news while the PVI shows only a brief increase and then flattens, the volume surge is likely reactive. This behaviour indicates that the market has not yet absorbed sufficient sustained participation to support a prolonged upward trend.
Why Is the PVI Indicator Important for Identifying Retail Investor Entry?
Retail investors typically enter the market after a trend has already become visible. Their decisions are often influenced by recent price performance, headlines, and broader market sentiment rather than early structural signals. As a result, large-scale retail participation usually occurs during the middle or later stages of a trend.
The PVI indicator provides insight into this behavioural timing by tracking activity on high-volume trading days. A consistent rise in the PVI following an established uptrend suggests that retail participation is expanding. While this may support short-term price movement, it also signals increased crowd involvement and elevated behavioural risk.
From a professional trading perspective, the PVI should not be viewed solely as a buy signal. Instead, it functions as a behavioural risk management tool. When price advances are accompanied by aggressive PVI growth, traders can interpret this as a sign of late participation and adjust position sizing, entry timing, or confirmation requirements accordingly.
Key Insight:
When the PVI and NVI indicators cross above their long-term moving averages simultaneously, the probability of a major structural trend forming increases markedly.
The Role of the PVI Indicator in Identifying Bullish Trends
Referring to Quantifiedstrategies, one of the primary applications of the PVI indicator is confirming bullish market trends. When the PVI line remains above its moving average—typically the 255-day moving average—it signals a strong bullish market environment. A breakout of the PVI line above this long-term average is often interpreted as a potential buy signal.
Example
In the chart below, you can see that once the PVI line moves above its moving average, the asset’s price also enters a strong upward trend.
Q: Can the PVI indicator be used to identify false breakouts in late-stage bullish trends?
A: In mature bullish trends, new price breakouts often occur with declining genuine market participation. If a significant rise in the PVI does not accompany a breakout, the likelihood of it being a false breakout increases considerably.
In these situations, a flat or weakening PVI indicates that high-volume buyers are not entering the market, and the price move is largely driven by short-term pressure or position covering.
Traders can use this insight to avoid entering positions at the late stage of a trend, reducing the risk of being trapped by false breakouts.
How to Use the PVI Indicator in Technical Analysis
To use the PVI indicator effectively and extract meaningful trading signals, two widely used and practical approaches are available: moving average crossovers and divergence analysis.
Trading Signals Using a Moving Average (Moving Average Crossover)
This is one of the most common and reliable methods for applying the PVI indicator. In this approach, a moving average—typically a one-year or 255-day moving average—is applied directly to the PVI line.
This moving average acts as a baseline or long-term trend filter, helping assess overall market sentiment.
Bullish Signal
A bullish signal is generated when the PVI line crosses above its moving average. This indicates a notable increase in buying pressure on high-volume days—often associated with heightened retail investor activity—exceeding its long-term average.
Such a move confirms the strength of the bullish trend and increases the likelihood of its continuation.
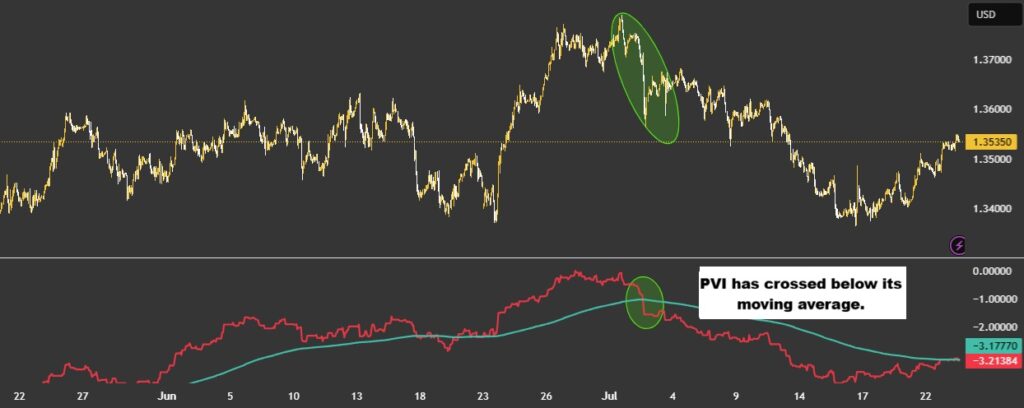
Bearish Signal
A bearish signal occurs when the PVI line crosses below its moving average. This suggests that buying interest on high-volume days has weakened and fallen below its long-term average.
As a result, this signal may indicate a loss of bullish momentum and a higher likelihood of a price reversal.
Divergence Analysis
Divergence occurs when the direction of price movement conflicts with the direction of an indicator. This phenomenon is considered one of the strongest leading signals for identifying potential market reversal points.
Bearish Divergence
Condition:
The asset’s price forms a new high, while the PVI indicator fails to confirm it and instead prints a lower high.
Interpretation:
This divergence indicates that the most recent upward price wave has been supported by weaker buying interest on high-volume days. In other words, despite prices moving higher, buyer strength—particularly from retail participants—has diminished.
This serves as a serious warning signal of a weakening bullish trend and an increased probability of a price decline.
Bullish Divergence
Condition:
The asset’s price records a new low, while the PVI indicator refuses to make a lower low and instead forms a higher low.
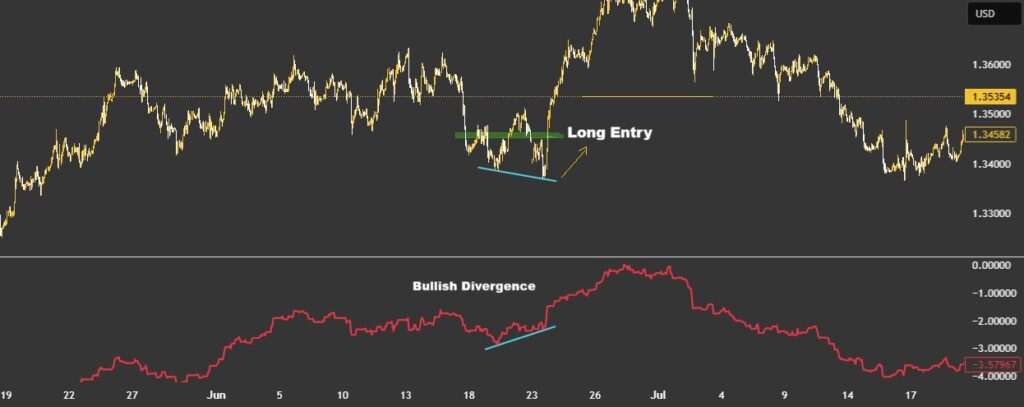
Interpretation:
This divergence suggests that despite the decline in price, selling pressure is weakening, while buyer strength on high-volume days has increased compared to earlier periods. This pattern may indicate the exhaustion of the downtrend and the beginning of a buying accumulation, thereby increasing the probability of a bullish price reversal.
Pro Tip:
Using the PVI indicator with asymmetric timeframes (e.g. 7 or 11 periods) improves signal accuracy during trend transition zones.
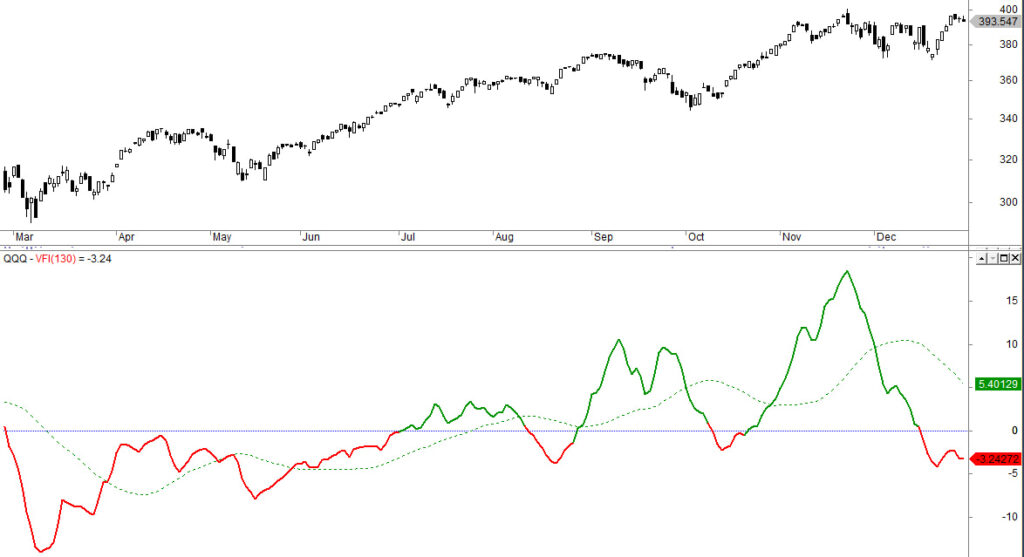
Comparing the PVI Indicator with OBV and VFI
In technical analysis, volume-based indicators are powerful tools for understanding liquidity flows and the strength behind price movements. Among the most widely used indicators in this category are the PVI indicator, On-Balance Volume (OBV), and the Volume Flow Indicator (VFI).
Although all three rely on volume data, they differ fundamentally in their underlying logic, calculation methods, and the type of signals they generate. Each indicator highlights a different dimension of market behaviour, making them complementary rather than interchangeable.
To clarify these differences, the key characteristics of PVI, OBV, and VFI are summarised in the table below.
| Feature | PVI Indicator (Positive Volume Index) | OBV Indicator (On-Balance Volume) | VFI Indicator (Volume Flow Indicator) |
|---|---|---|---|
| Core concept | Tracks retail investor activity on high-volume days | Volume moves ahead of price | Measures the quality and strength of money flow |
| Calculation logic | Adds the percentage price change only on days when volume exceeds the previous day | Adds total daily volume if price rises; subtracts it if price falls | Combines volume with price movement using Typical Price |
| What does it measure? | The health of an uptrend is based on crowd participation | The overall direction of volume flow (inflows vs outflows) | Trend strength and sustainability based on volume flow |
| Primary focus | Periods of rising volume | Price direction | Strength and quality of volume flow |
| Best use case | Confirming bullish trends and detecting weakening market enthusiasm | Confirming price trends and spotting basic divergences | Identifying trend strength and anticipating overbought/oversold conditions |
| Key signal | Crossing above or below the one-year moving average | Confirmation or divergence versus price | Zero-line crossovers and divergences |
| Strength | Strong focus on market psychology and retail participation | Simplicity and a clear view of the overall volume flow | Accounts for price intensity alongside volume |
| Limitation | Ignores information from low-volume days | A single-volume spike can permanently distort the indicator | More complex calculations and parameter sensitivity |
In Summary
- PVI Indicator (Positive Volume Index):
This indicator targets retail investor psychology by tracking price changes only on high-volume days, helping assess whether market enthusiasm genuinely supports an emerging bullish trend. - OBV Indicator (On-Balance Volume):
Based on the principle that volume precedes price, OBV offers a clear view of capital inflows and outflows by adding volume on rising days and subtracting it on falling days.

- VFI Indicator (Volume Flow Indicator):
This advanced indicator assesses the true quality and strength of money flow by combining volume, price direction, and price-change magnitude to evaluate overall trend sustainability.
Advantages and Limitations of the PVI Indicator
Like any analytical tool, the PVI indicator comes with clearly defined strengths and weaknesses. A solid understanding of these aspects helps traders recognise when its signals are reliable and when caution is required.
Advantages of the PVI Indicator
- Tracks retail investor psychology:
By focusing on high-volume days, the PVI indicator highlights collective buying enthusiasm and crowd participation in market trends. - Confirms bullish trends:
When price and PVI rise together, it signals strong market support and a healthy uptrend. - Provides early reversal warnings:
PVI divergences, especially bearish divergences, can signal weakening momentum and an increased likelihood of a trend reversal.
Limitations of the PVI Indicator
The PVI indicator has important constraints that traders must factor into their analysis:
- Overlooks smart money activity:
By focusing on high-volume days, PVI ignores institutional accumulation that often occurs quietly during low-volume sessions. This can cause it to miss key accumulation phases before major upward moves. - Ineffective in range-bound markets:
PVI is trend-dependent. In sideways markets, volume spikes are often random, producing conflicting and misleading signals. As a result, PVI performs poorly in non-trending conditions. - Not a standalone tool:
According to Howtotrade, PVI captures only crowd behaviour. Using it alone is risky. Its signals should be confirmed with price action, key support and resistance levels, and other volume indicators such as OBV or NVI.
Q: What structural market conditions reduce the informational value of the PVI indicator even during strong trends?
A: The PVI indicator loses informational edge in markets dominated by mechanical volume generation, such as algorithmic rebalancing, passive ETF flows, or exchange-driven volume incentives. In these environments, rising volume does not necessarily reflect discretionary retail participation.
As a result, PVI signals may appear technically valid while lacking behavioural significance. Advanced traders mitigate this by cross-referencing volume composition metrics, such as trade-size distribution or session-based volume clustering, before assigning weights to PVI-driven signals.
Who Is the PVI Indicator Best Suited For?
The PVI indicator is best suited to traders who aim to identify and trade strong bullish trends. It is particularly valuable for those interested in crowd behaviour and market psychology, as it helps interpret prevailing market sentiment through volume dynamics.
Conclusion
The PVI indicator is a powerful tool for volume analysis and understanding retail investor behaviour. By focusing on high-volume sessions, it helps traders can identify and confirm bullish trends and anticipate potential reversal points through divergence signals.
For optimal results, the PVI indicator should be combined with other analysis tools, including moving averages and volume indicators, rather than used in isolation.


