


Trading volume is one of the most important factors in revealing the real story behind price moves. But watching raw volume alone is not always enough, because you cannot judge today’s volume against normal conditions.
For that reason, traders use the Relative Volume (RVOL) indicator to compare current activity with its historical average.
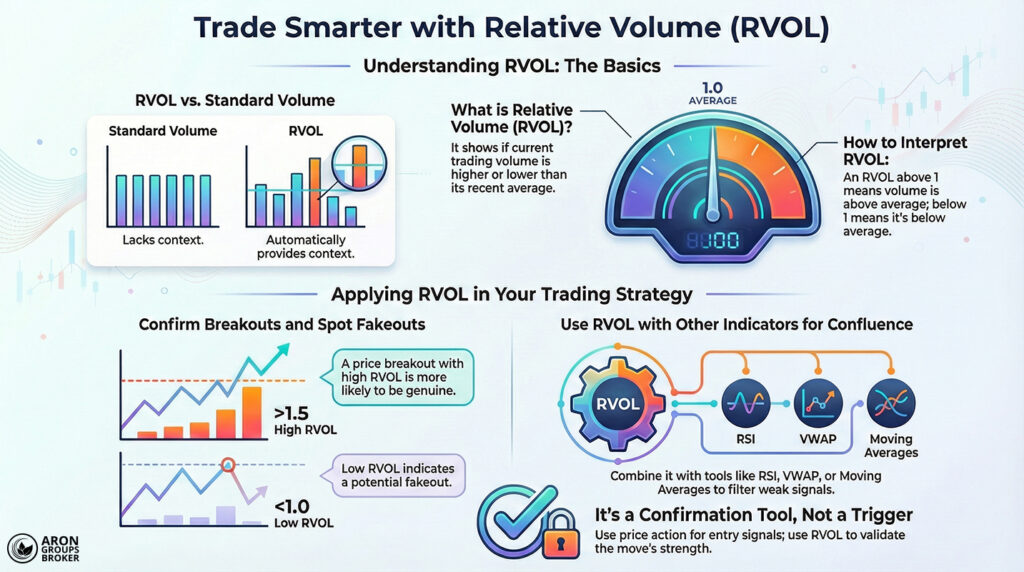
This indicator shows whether current volume is above or below its past average, and that simple comparison can confirm trend strength. In practice, RVOL helps you spot unusual market moves, validate breakouts, and find more reliable entry and exit points.
In the rest of this article, we explore how to use RVOL in a structured, risk-aware way.

- RVOL is naturally higher at the market open, so do not compare it directly with quieter hours.
- During major economic news or company earnings reports, RVOL can spike quickly and create short-term opportunities.
- Very high RVOL readings, for example, above 4, often signal intense fear or excitement, not necessarily trend continuation.
- In thinly traded shares or assets, RVOL may produce more false signals, so pair it with higher-liquidity markets.
What Is the Relative Volume (RVOL) Indicator?
According to chartschool, the Relative Volume (RVOL) indicator shows how much current trading volume differs from the market’s normal level. Put simply, it compares the current candle’s volume with the average volume of several previous candles.
This comparison shows whether today’s volume is higher, lower, or broadly similar to recent sessions.
Relative Volume Formula
RVOL = current volume ÷ average volume over the selected period
- If RVOL is above 1, current volume is above average, meaning the market is more active and attention has increased.
- If RVOL is below 1, the current volume is below average, meaning the market is quieter and interest has reduced.

Key Point
RVOL depends on your lookback length. Short windows react faster but whipsaw more, while longer windows smooth noise but lag.
Example
Assume a share’s average trading volume over the past 10 days is 200,000 units, and today’s volume is 300,000 units.
Using the formula, RVOL is:
RVOL = 300,000 ÷ 200,000 = 1.5
This means today’s volume is 1.5 times the average, so the market is more active than normal in this share.
Why Does Relative Volume Matter to Traders?
Relative volume matters to traders for the following reasons:
- Measuring market commitment to a price move: When price rises or falls, and RVOL is high, more traders are backing the trend strongly.
- Separating genuine breakouts from false breakouts: If price breaks key support or resistance but RVOL is low, reversal risk rises.
- Improving entry and exit timing: An unusual RVOL increase often signals a strong move starting, or an existing trend ending.
Must read: What is smart money?
The Difference Between Relative Volume (RVOL) and Standard Volume
The standard Volume indicator shows each candle’s trading volume as a raw figure, with no built-in context. To interpret it, you must manually compare the current volume with previous days or earlier candles.
Relative Volume (RVOL) goes one step further by running that comparison automatically in real time. It measures current volume against the average volume over a chosen lookback window and outputs a single ratio.
As a result:
- Standard volume is mainly used to review broad volume trends over time.
- RVOL shows exactly how far current volume is above or below normal, which helps identify abnormal activity.
How to Add and Configure the Relative Volume (RVOL) Indicator in MetaTrader and TradingView
This section explains how to add and configure the RVOL indicator in MetaTrader and TradingView.
MetaTrader
In MetaTrader, RVOL is not included by default, so you must install a custom indicator.
Installation steps
- Download the RVOL indicator file (ex4 or mq4 for MT4, and ex5 or mq5 for MT5).
- Open MetaTrader and follow this menu path from the top bar:
- File → Open Data Folder → MQL4 (or MQL5) → Indicators
- Copy the indicator file into the Indicators folder.
- Close MetaTrader and reopen it so the platform refreshes the indicator list.
- In Navigator → Indicators, drag RVOL onto your chart.
Settings
- Set the calculation period, for example, the most recent 20 candles.
- Set the baseline (threshold) to 1, so you can quickly spot above- or below-average volume.
TradingView
- Open your chart view.
- Click Indicators on the top toolbar.
- In the search box, type Relative Volume or RVOL.
- Choose Relative Volume from the results and add it to the chart.
- To adjust settings, click the indicator name above its panel and change the Period.
- Common periods are 50 or 20, depending on how smooth you want the average to be.
- You can also switch the average type between SMA and EMA.
- Adjust colours and chart style (histogram or line) based on your preference.
Key Point box
For intraday charts, align your RVOL period with your trading session. Mixing sessions can distort averages around opens and closes.
How to Identify Breakouts Using the RVOL Indicator
When price breaks through a key support or resistance level, and RVOL is above 1.5 or 2, the breakout is likelier to hold.
Q: What RVOL behaviour often signals a “breakout and hold” rather than a quick spike?
A: Look for RVOL staying elevated for several candles after the break, not just one volume burst.
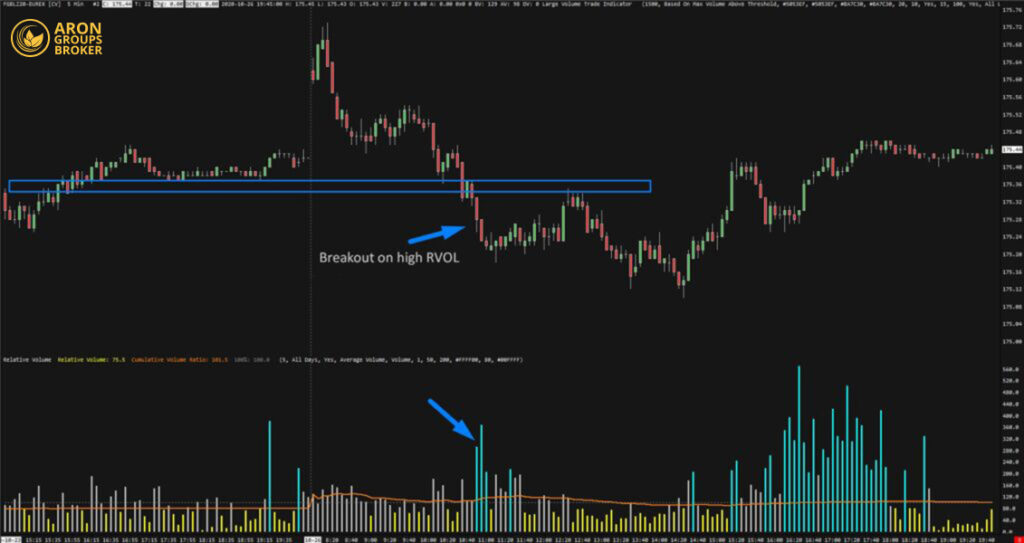
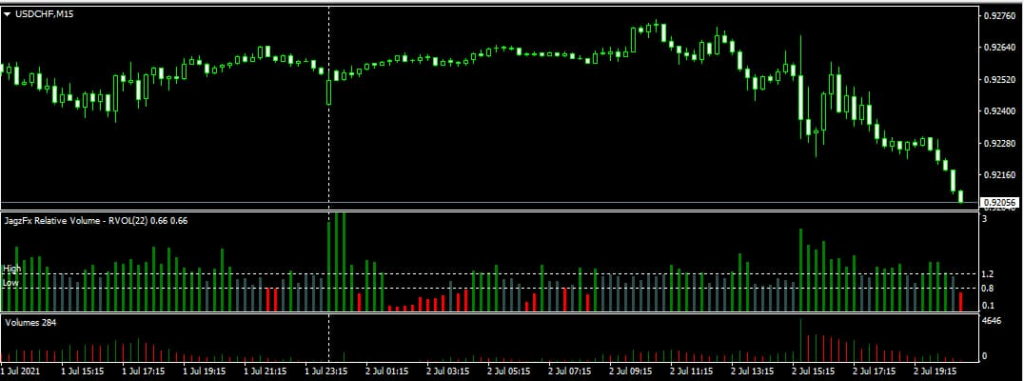
This image shows a support break that happens alongside a clear rise in Relative Volume (RVOL). The tall blue bars at the bottom indicate above-average volume, increasing the odds of breakout confirmation.
How to Spot Fakeouts by Comparing Relative Volume and Candlesticks
If a breakout appears on the chart but RVOL is below 1, the chance of a reversal is high.
This approach is especially useful for avoiding poor entries based on weak market participation.
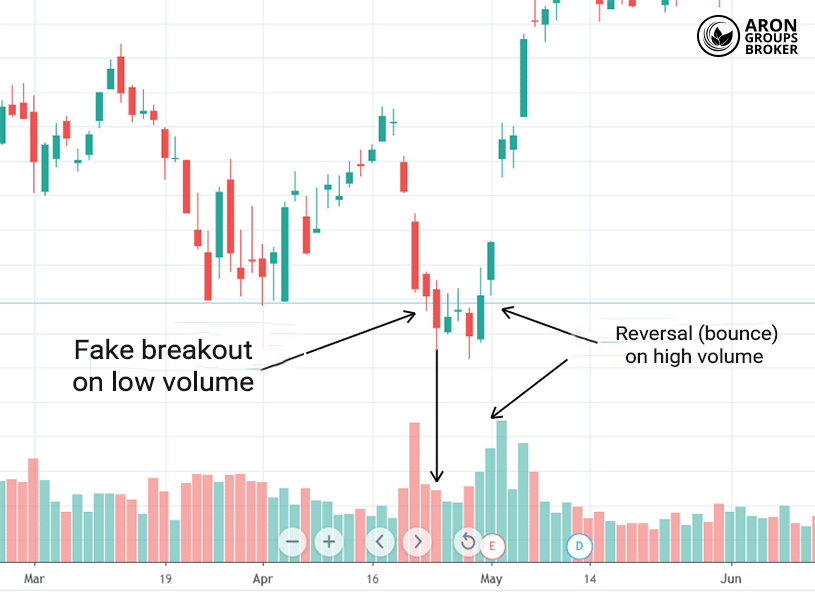
On the chart, the candle breaks the level, but low volume shows the market lacks conviction. As a result, the break is unlikely to sustain and is more likely to be a fakeout.
This example highlights that entering without strong RVOL confirmation can carry significant risk.
Combining Relative Volume (RVOL) with VWAP
Combining the Relative Volume indicator with VWAP can strengthen trend analysis and improve context around price moves. VWAP acts as a proxy for fair value, and price position versus it helps indicate the market’s likely direction.
Q: Why can VWAP + high RVOL sometimes be misleading right after the session opens?
A: Early prints can be price-discovery noise, so VWAP stabilises later; RVOL spikes early may overstate conviction.
When the price is above VWAP, and RVOL is high, it signals strong buying interest and a higher chance of trend continuation. Conversely, if the price is below VWAP and relative volume is elevated, it suggests heavy selling pressure and a greater downside risk.
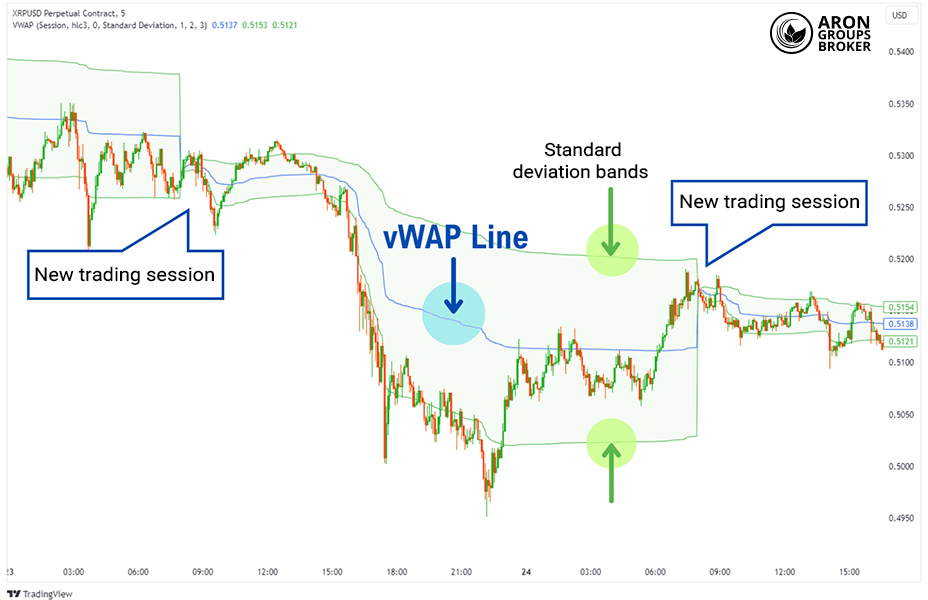
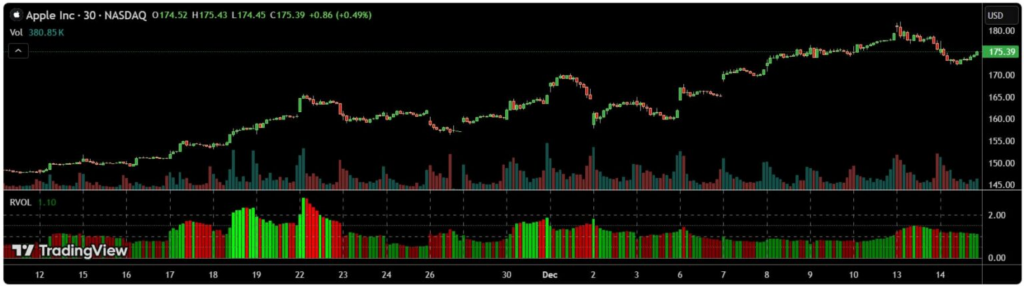
This chart shows VWAP’s role in trend analysis as a line price that often oscillates around, indicating a balance level. When combined with RVOL, a price above that line alongside high relative volume can support a bullish continuation view.
Combining Relative Volume (RVOL) with Price Action
Combining the Relative Volume indicator with price action can give a clearer read on the strength behind market moves. When large-bodied candles appear with high RVOL, it often indicates strong momentum and decisive participation from traders.
By contrast, small candles with low RVOL usually reflect a lack of conviction and insufficient pressure for meaningful movement.
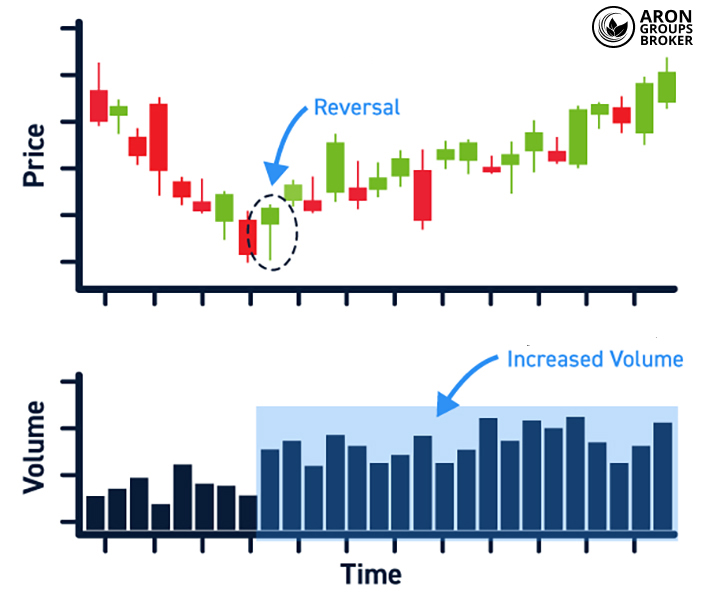
This image shows a trend reversal that occurs alongside rising volume, which is consistent with high RVOL conditions. Green candles after a downtrend, together with higher volume, confirm that the market direction is shifting.
Combining Relative Volume (RVOL) with the RSI Indicator
Combining Relative Volume with the Relative Strength Index (RSI) can produce stronger reversal signals in practice. When RSI is in overbought territory, and RVOL rises, the likelihood of a bearish reversal increases.
Conversely, RSI in oversold territory alongside high RVOL often signals the start of a strong upward move.
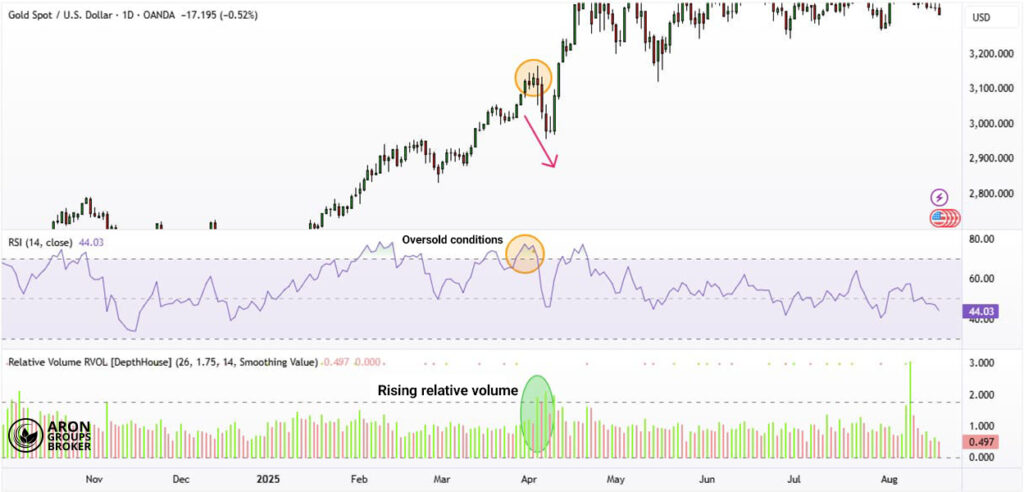
This image clearly shows RVOL combined with RSI: when RSI is high in overbought conditions, and RVOL increases, downside reversal risk rises.
Combining Relative Volume (RVOL) with Moving Averages
Combining Relative Volume with moving averages can improve signal reliability and reduce weak crossover entries.
- A bullish moving average crossover with high RVOL often signals strong buyer participation and a higher-confidence buy signal.
- A bearish crossover with high RVOL suggests heavy selling pressure and can act as a more credible sell signal.
Q: How can RVOL help you avoid “late” moving average crossovers?
A: If the crossover happens on average or low RVOL, it may be lagging; elevated RVOL supports stronger follow-through.
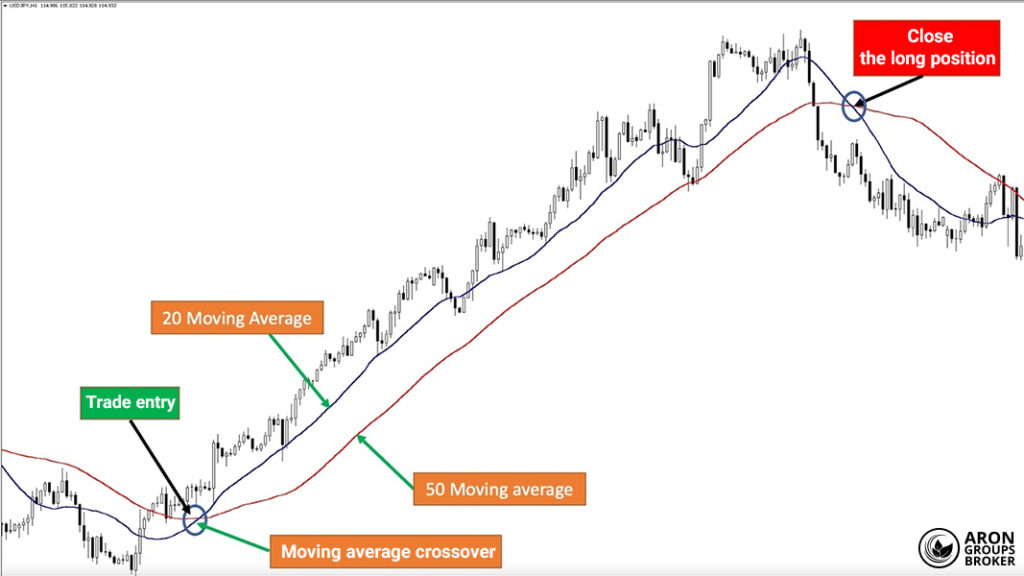
In this image, the 20-period moving average (short-term) clearly crosses above the 50-period moving average (long-term), signalling a buy. If relative volume is high at that point, you can confirm the signal with greater confidence. A valid crossover backed by elevated relative volume is a strong clue for trade entry.
Common Trader Mistakes When Using the RVOL Indicator
One reason some traders underperform is the incorrect use of the Relative Volume (RVOL) indicator.
The most serious mistakes include:
- Using RVOL without checking key technical levels: High volume alone is not enough; confirm the price is near support or resistance.
- Treating high volume as an entry signal without trend context: High volume in a downtrend may reflect selling pressure, not buying.
- Ignoring timeframe: A high RVOL on the one-hour chart can mean something different from the same reading on daily charts.
- Not using Confluence filters like VWAP or RSI: Combining RVOL with other tools helps filter weak signals and improve decision accuracy.
Key Point box
Treat RVOL like a “confirmation filter,” not a trigger. Your entry should come from structure, and RVOL should validate participation.
Conclusion
The Relative Volume (RVOL) indicator is a powerful tool for measuring market commitment behind a price move. RVOL is not sufficient on its own, but with VWAP, price action, and RSI, it can improve trade accuracy. This combination can also help you distinguish breakouts from fakeouts more effectively.


