icon icon Home
icon icon Accounts
icon icon Quick start
icon icon Symbols

How to Trade Smarter with the RSI Arrow Indicator

Author
Abe Cofnas
Abe Cofnas
calendar Last update: 12 April 2026
watch Reading time: 11 min

An RSI arrow indicator is a simplified version of RSI that prints buy/sell arrows when RSI meets a preset condition (most commonly, crossing out of oversold/overbought). It sounds convenient, but are those arrows giving you a clean decision framework, or are they hiding the RSI context you actually need to trade well?

bookmark
Key Takeaways
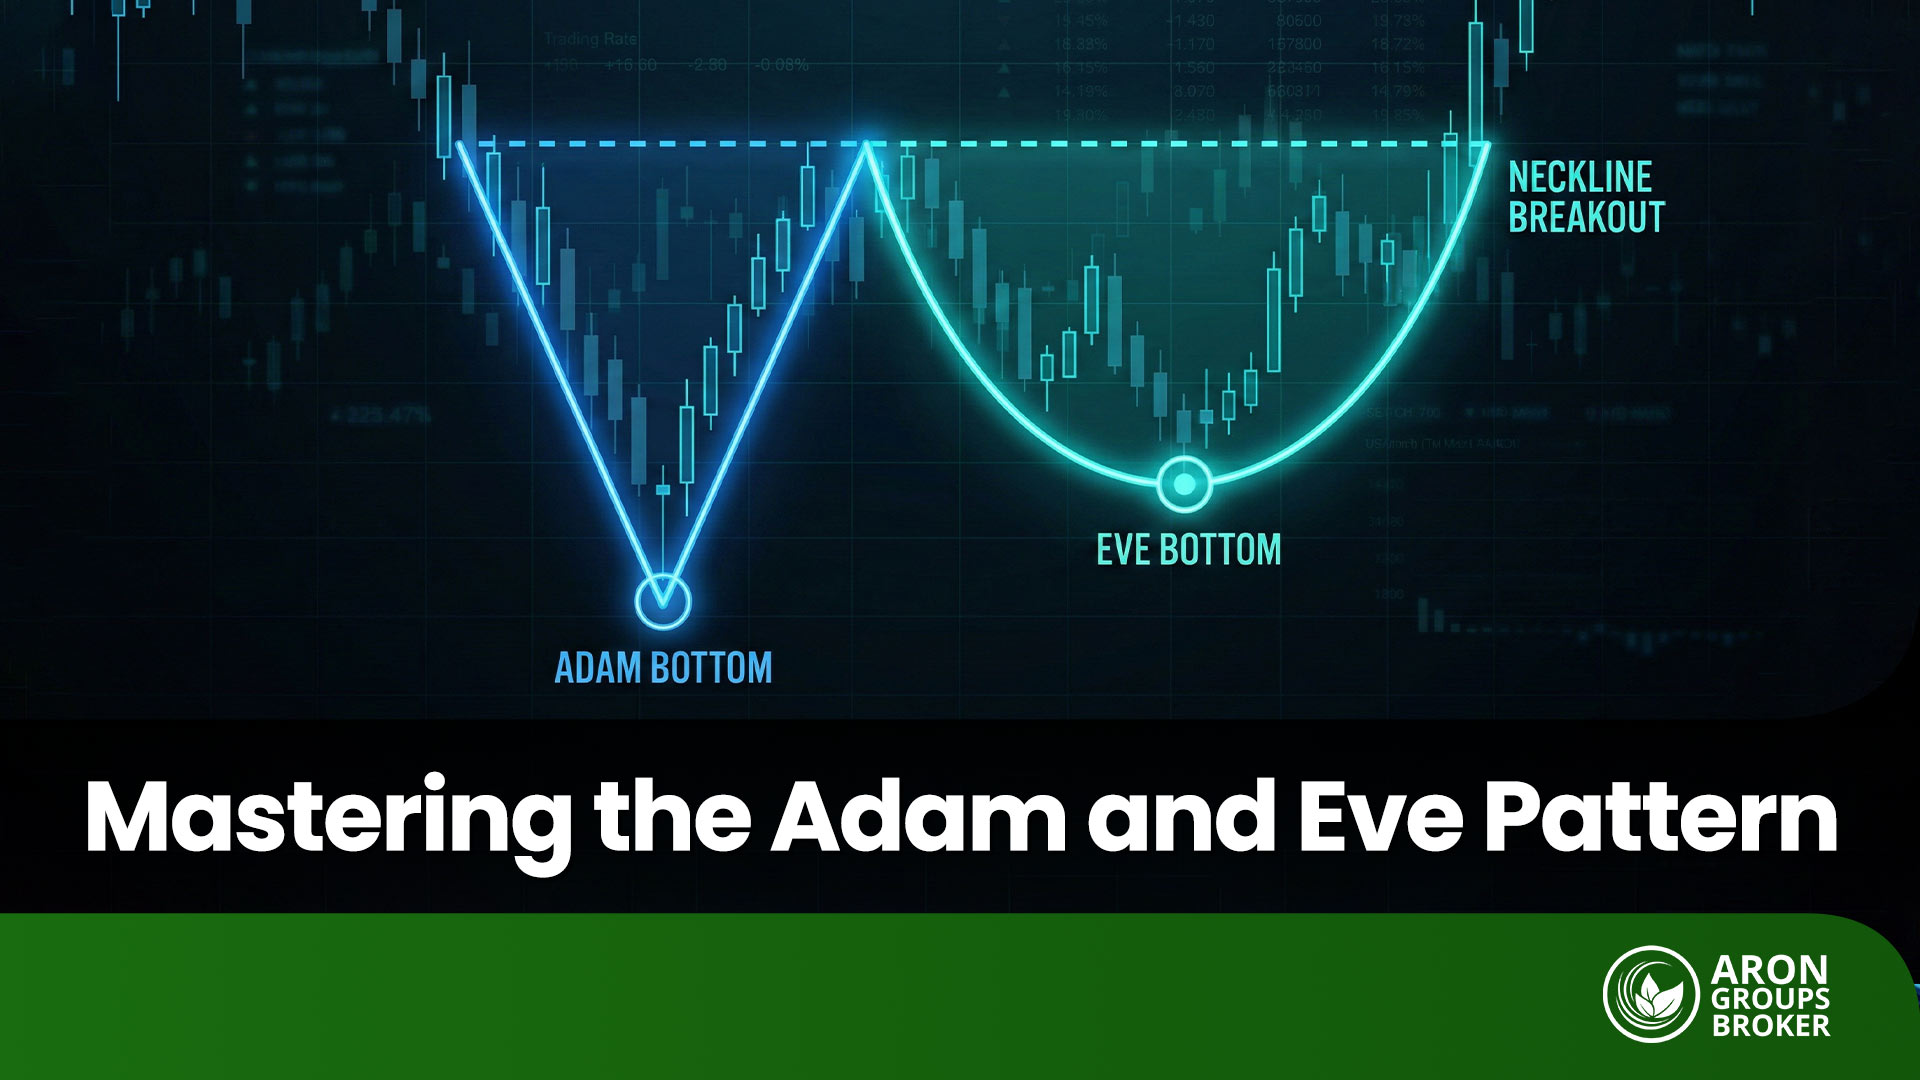
  • RSI is a momentum oscillator. It measures the speed and change of price moves, usually on a 0–100 scale.
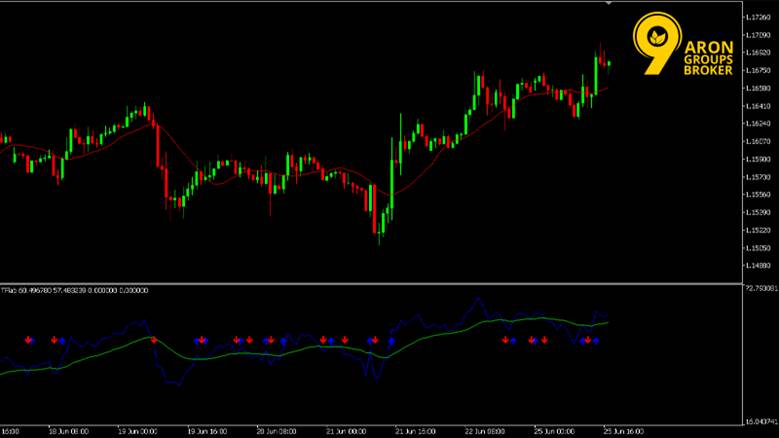
  • An RSI arrow indicator turns RSI conditions into discrete signals (arrows). The exact logic depends on the specific tool/script.
  • In MT4/MT5, arrow indicators are typically implemented using indicator buffers with an arrow drawing style.
  • Arrows are best treated as alerts, not automatic entries. RSI can stay overbought or oversold for long periods in strong trends.
  • The indicator performs best when paired with a simple filter: a trend filter (e.g., moving average) or key levels.
sms-star

Important note: The RSI Arrow Indicator is not a single indicator. Many versions exist, with different rules.

What Is the RSI Arrow Indicator?

According to TradingFinder, an RSI arrow indicator is a custom overlay (or subwindow tool) that takes RSI’s continuous oscillator output and converts it into yes/no signals. The goal is speed and clarity, not deeper analysis.

How the RSI Arrow Indicator Generates Buy and Sell Arrows

Most RSI arrow tools generate arrows from one of these behaviours:

  • Level cross/exit signals
    • Buy an arrow when RSI rises back above a lower level (e.g., 30).
    • Sell arrow when RSI falls back below an upper level (e.g., 70).
  • Midline signals
    • Buy an arrow when RSI crosses above 50.
    • Sell arrow when RSI crosses below 50.
  • Momentum shift signals (less common, but used)
    • Arrow when RSI slope flips, and a threshold is met.

MQL4 explains that on MT4/MT5, arrows are usually drawn via indicator buffers set to arrow styles. That’s a standard custom-indicator approach.

sms-star

Remember: The arrow is not magic. It’s just a visual wrapper around one RSI rule.

How RSI Arrow Differs from the Standard RSI Indicator

Standard RSI gives you a full oscillator curve, so you can read:

  • momentum strength
  • persistence (staying above/below certain zones)
  • divergences (if you use them)

An RSI arrow indicator compresses that into discrete events (arrow appears or not). This makes decisions simpler, but it also removes context, especially the difference between a shallow RSI dip and a deep momentum shift.

Why Traders Use the RSI Arrow Indicator

Traders use arrows because they reduce chart-reading friction. Instead of interpreting RSI continuously, you get a clear prompt. The trade-off is that you must add rules to avoid low-quality arrows.

Turning RSI Momentum into Clear Entry Signals

Investopedia notes that RSI is widely used to spot momentum conditions and potential overbought/oversold zones.
Arrows turn that into actionable signals, which help with:

  • speed (less interpretation)
  • consistency (same rule every time)
  • alerts (easier to automate later)

A practical way to use arrows responsibly:

  • Let the arrow be your attention trigger.
  • Use price action to decide the entry (key level break, rejection, or trend continuation).

Where the RSI Arrow Indicator Performs Best

Arrows tend to perform best when RSI behaviour is more stable, and mean-reversion is realistic.

Best-fit conditions:

  • Range-bound markets where price regularly oscillates between support and resistance (RSI levels have more meaning).
  • Trends with adjusted RSI expectations, where you only take arrows that align with the trend direction (e.g., buy arrows in uptrends, ignore sell arrows).

Where arrows weaken:

  • Strong trends without a trend filter (RSI can stay overbought/oversold, and arrows can fire early).
  • Choppy, low-quality sessions where RSI flips quickly (too many signals).
sms-star

Important note: If you want arrows to work, you usually need one extra rule: a trend filter or a key level filter.


How to Download the RSI Arrow Indicator

Before anything else, treat RSI arrow indicator MT4 as a category, not a single official tool. Different versions use different rules (and some are poorly coded). Download only from sources you trust, and prefer indicators where you can see the logic or at least the settings clearly.

Download and Installation the RSI Arrow Indicator for MT4 and MT5

Most RSI arrow indicators come as either compiled files or source files:

  • MT4: .ex4 (compiled) or .mq4 (source)
  • MT5: .ex5 (compiled) or .mq5 (source)

A clean install process (Windows) is:

  • MT4/MT5, then File, then Open Data Folder
Installation the RSI Arrow Indicator
  • Go to:
    • MT4: MQL4 then Indicators
    • MT5: MQL5 then Indicators
  • Paste the indicator file into that folder
RSI Arrow Indicator for MT4 and MT5
  • Restart the platform or refresh the Navigator list
How to Trade Smarter with the RSI Arrow Indicator
Download RSI Arrow Indicator
  • If you only have a source file (.mq4/.mq5), open it in MetaEditor and Compile
RSI Arrow Indicator
sms-star

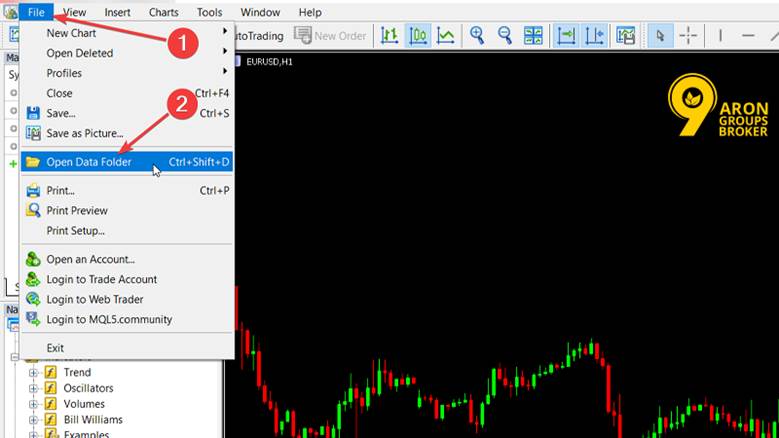
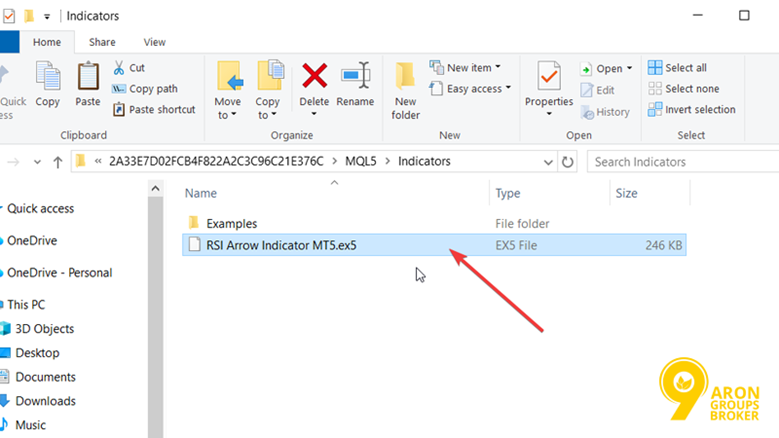
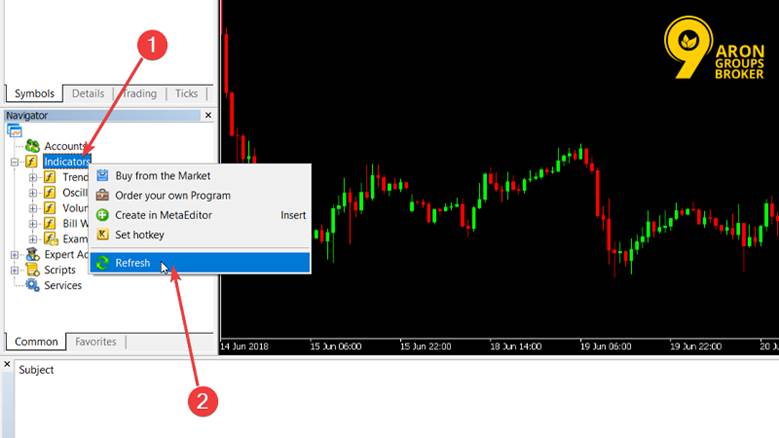
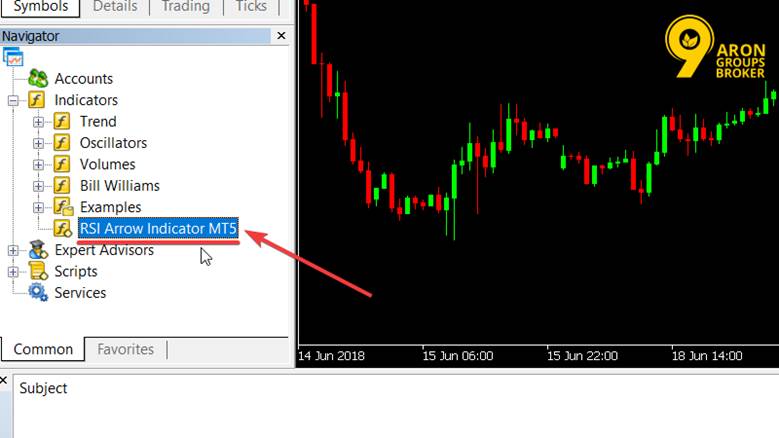
Tip: If the indicator doesn’t show up, it’s usually one of three issues: wrong folder, not compiled, or the file is for MT4, but you tried MT5 (or vice versa).

Using RSI Arrow Indicator on TradingView

TradingView does not use MT4/MT5 files. You have two realistic options:

Option A: Use a Public Library script

  • Open Indicators, then Scripts and search for an RSI arrow-style script
  • Add it to your favourites so you can reuse it easily

Option B: Use Pine Editor (if you have the code)

  • Open Pine Editor
  • Create a new indicator script, paste the code, Save, then Add to chart

Configuring the RSI Arrow Indicator for Accurate Signals

Arrows feel accurate when they match the market’s behaviour. Your job is to tune the indicator so the arrows appear in conditions you actually want to trade.

Optimising RSI Period and Signal Levels

Most RSI-based tools start from common defaults:

  • RSI length: often 14
  • Overbought/oversold levels: commonly 70 / 30

How to tune without overfitting:

  • If you want fewer, cleaner arrows, increase the RSI length slightly (slower).
  • If you want faster arrows, reduce the RSI length (more signals, more noise).
  • If the market trends strongly, consider using less aggressive levels (e.g., 60/40) rather than expecting clean 70/30 mean-reversion every time. RSI can stay overbought/oversold for long periods.

Setting Alerts for RSI Arrow Indicator Entries

Alerts depend on the platform and the specific indicator version.

MT4/MT5

  • MetaTrader supports alerts via the Terminal/Toolbox, then Alerts tab (price/time alerts).
  • For arrow alerts specifically, the indicator must be coded to trigger alerts (pop-up/push/email). If your RSI arrow indicator has settings like AlertOnArrow / SendNotification, enable those. (If it doesn’t, you won’t reliably get arrow-fired alerts without extra coding.)

TradingView

  • Alerts can be created on indicators, but they work best when the script includes alert triggers.
  • Create an alert, then choose the indicator in the Condition dropdown, and select the arrow condition (if the script provides it).

Choosing the Right Timeframe for Trading Strategy

The timeframe controls how chatty arrows become.

A simple rule-set:

  • 1–5 min: lots of arrows; best if you have a strong filter (trend + key levels).
  • 15–60 min: fewer arrows; better signal stability and easier risk management.
  • Daily: arrows can be very slow but often cleaner.

If your arrow indicator feels amazing on 1-minute but unusable live, it’s usually the timeframe noise, not your skill.

Does the RSI Arrow Indicator Repaint?

Some do. Some don’t. And some half repaint (signals look stable only after the candle closes). You need to test the exact version you’re using.

What Repainting Means in Arrow Indicators

Repainting is when an indicator changes past signals after new candles form. TradingView describes repainting behaviour as plots changing after refresh/recalculation, which is one common form that traders worry about.

Practical interpretation:

  • Normal behaviour: the current candle can change while it’s forming.
  • Problem behaviour: arrows on closed candles disappear, move, or appear later.

How to Test an RSI Arrow Indicator for Repainting

Use playback tools, not screenshots.

MT4/MT5 test (best practical method)

  • Run the Strategy Tester in visual mode and watch whether arrows change on already-closed candles as new bars form.

TradingView test

  • Use Bar Replay to simulate the market forward and compare signals as they appear in real time vs what you see on the fully formed chart.
  • Also, be aware that TradingView notes that scripts can show different results after refresh in repainting-type scenarios.
sms-star

Important note: If an arrow only becomes final after the candle closes, you must trade it as a closed-candle signal. Treating it as an instant signal is how traders get trapped.

Trading with the RSI Arrow Indicator in Live Markets

In live markets, an RSI arrow indicator should be treated as a signal prompt, not an autopilot system. RSI is a momentum oscillator and can stay overbought or oversold for longer than most traders expect, especially in trends. Your job is to add context so you only act on the arrows that fit the market phase.

Using the RSI Arrow Indicator in Trending Conditions

Trends are where most RSI arrow traders get trapped, because they try to fade strength too early.

A safer trend rule-set:

  • In an uptrend, prioritise buy arrows and ignore most sell arrows.
  • In a downtrend, prioritise sell arrows and ignore most buy arrows.

Why this works: RSI can remain elevated in strong uptrends and depressed in strong downtrends, which makes raw overbought/oversold arrows unreliable as reversal triggers.

Practical execution (simple):

  • Define trend with higher highs/higher lows (or lower highs/lower lows).
  • Wait for a pullback.
  • Take the arrow only if it aligns with the trend direction.
sms-star

Don’t forget: In trends, use RSI arrows to join the move, not to fight it.

Trading Reversals with RSI Arrow and Key Levels

Reversals are where arrows feel powerful. They can also be where you lose money fastest. The fix is structure.

Use arrows only at key levels, such as:

  • Prior swing high/low
  • Range boundary
  • Clear support/resistance zone

A practical reversal model:

  1. Price reaches a key level.
  2. RSI arrow prints (oversold/overbought exit or midline shift).
  3. Price confirms with a rejection or break of minor structure.
  4. You enter with a defined stop beyond the level.

This is the difference between a signal and a trade.

sms-star

Tip: A reversal arrow in the middle of nowhere is usually noise.

Combining the RSI Arrow Indicator with Moving Averages

Moving averages help you filter arrows by trend and reduce overtrading.

Investopedia explains that moving averages smooth price action and are commonly used to identify trend direction.

A simple MA filter that works well with RSI arrows:

  • Use one MA (e.g., 50 EMA or 200 EMA) as a trend gate.
  • Only take buy arrows when price is above the MA.
  • Only take sell arrows when price is below the MA.

If you want a second filter without clutter:

  • Use a faster MA (e.g., 20 EMA) to time pullbacks in the direction of the trend.
sms-star

Tip: The arrow gives you timing. The moving average gives you permission.


Performance Strengths and Limitations of RSI Arrow

An RSI arrow indicator is not a replacement for skill. It is a tool that can reduce decision friction if you use it in the right conditions.

When the RSI Arrow Indicator Adds the Most Value

RSI arrows add the most value when:

  • The market is range-bound, and mean-reversion is realistic. RSI was designed to measure momentum, and overbought/oversold frameworks tend to work better in ranges.
  • You already have a clear plan, and arrows act as an execution cue.
  • You combine it with one simple filter (trend MA, key levels, or session rules).
  • You use it for alerts and then decide with context.

Market Conditions Where Signals May Weaken

Signals often weaken when:

  • The market is in a strong trend (RSI stays stretched; reversal arrows appear too early).
  • Volatility is choppy, and price whipsaws (too many arrows).
  • The indicator repaints or behaves differently in real time vs closed candles (you must test this with replay/visual backtest).
  • You trade arrows without a stop plan (arrow-based trading without defined risk is the fastest way to blow up).

Conclusion

The RSI arrow indicator can make trading simpler by turning RSI conditions into clear buy/sell prompts. But the arrows are only as good as the rules around them. Use arrows with trend filters in trending markets, use arrows at key levels for reversals, and always manage risk with clear stops. Most importantly: test for repainting and treat arrows as closed-candle signals unless you have proof they are stable in real time. That is how you trade smarter.

Continue Reading
not-found
calendar 12 April 2026
Rate this article
Plugin not installed

Leave a Reply

Your email address will not be published. Required fields are marked *

No thanks