


A trading strategy built on support and resistance lines focuses on identifying optimal entry and exit points using support and resistance levels (zones where the price is likely to reverse when it touches them).
In this article, we will define support and resistance, explain how to identify support and resistance levels on the chart, review the advantages and disadvantages of this approach, discuss risk management within this strategy, and explore how trader psychology influences these resistance and support lines.
If you’re interested in this topic and looking for key insights to make better use of support and resistance in your trading, don’t miss this article.

- Support and resistance are among the most universal market concepts, which makes them adaptable to any trading style from short term scalping to long term investing.
- These levels work effectively because they reflect collective market behavior, meaning traders naturally gravitate toward the same price zones over time.
- Support and resistance become more powerful when aligned with broader market structure rather than being used as isolated lines on a chart.
- The strategy remains relevant across all asset classes, including forex, stocks, commodities, and crypto, making it one of the most versatile analytical tools available.
Definition of Support and Resistance in Technical Analysis
As mentioned in an article about support and resistance on strike.money, support, and resistance are key concepts in technical analysis that appear in almost every trading strategy and in most indicators. These levels are important because they reflect the core interaction of market forces, meaning supply and demand.
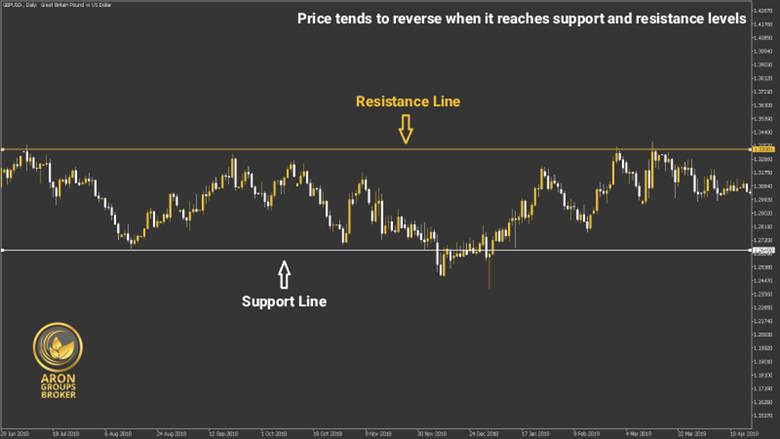
We know that when supply becomes stronger than demand, prices fall. When demand becomes stronger than supply, prices rise. It is clear that neither rising nor falling prices continues forever and market forces eventually return to balance. On price charts, there are certain price zones that show where buyers dominate sellers or where sellers dominate buyers. These price zones are called support and resistance levels, which we will define in detail below.
Support Levels
In a downtrend, sellers have the upper hand over buyers. This dominance causes the price to fall continuously. However, after the price reaches a certain level, for different reasons, including the belief that the asset is undervalued, buyers begin to enter the market. The number of buyers increases more and more until, at a specific price level or zone, their strength becomes greater than the strength of the sellers. This price level at which the downward movement reverses and the price begins to rise is known as a support level.
Resistance Levels
At the end of an uptrend, the price encounters a resistance line. An uptrend forms when buyers dominate sellers. However, at some point in the uptrend, some traders believe that the price has risen too much and is likely to drop soon. As a result, they start selling their assets and exiting the market. The selling continues until, at a certain price level, the strength of the sellers becomes greater than the strength of the buyers. This level, where the price reverses downward after reaching it, is called a resistance level.
Identifying Support and Resistance Levels in the Forex Market
There are different methods for identifying support and resistance levels. Some of these methods include the following
- Trendlines;
- Round Numbers;
- Technical Indicators.
Trendlines
In the market, price movement is more often seen in upward or downward trends rather than fluctuating within a fixed range. In an uptrend or downtrend, a trendline can act as a dynamic support or resistance line whose level changes along with the price.
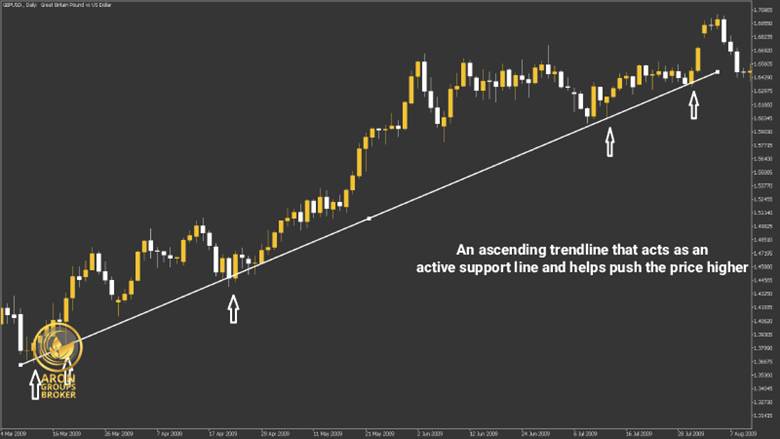
For example, in the uptrend shown below, you can see that the trendline acted as a support line and helped the price climb higher and higher.
In contrast, a downward trendline can serve as a resistance line that does not allow the price to rise.
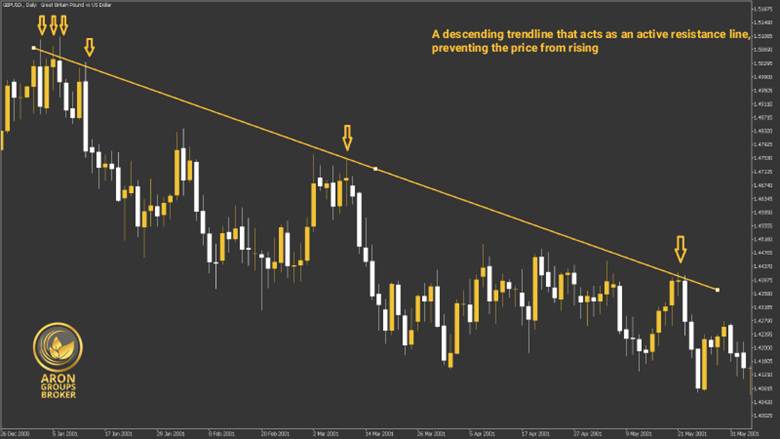

According to luxalgo: When drawing a trendline, validity significantly increases if the price touches the line at least three times; without three or more touches the level may not act as strong support or resistance
Round Numbers
Another method for identifying support and resistance lines is round numbers. Support and resistance levels often form around round numbers because many traders, especially beginners, prefer to enter or exit trades at round price levels. Another reason is that many stop loss and take profit orders are set at round numbers.
A large number of orders for any reason causes the market to react strongly at these levels. For example, imagine we are at the end of an uptrend for a stock and the price is at 59.2 dollars. Many traders believe they have made enough profit. In this situation, it is very likely that most profit targets are set at 60 dollars. When the price reaches 60, a large number of sell orders are executed. This means the number of sellers becomes so large that it stops the price from rising further. In fact, the high number of sell orders at the round number 60 causes the resistance line to form at this price.
Technical Indicators for Identifying Support and Resistance
Technical indicators are among the most effective tools for identifying support and resistance and for improving timing when entering or exiting trades. Combining support and resistance lines with other indicators is especially helpful for traders who are not yet confident in detecting support and resistance levels on their own.
Some of the most commonly used indicators for this purpose include the following:
- Moving Average;
- Fibonacci;
- Pivot Point;
- Bollinger Bands.
Moving Average
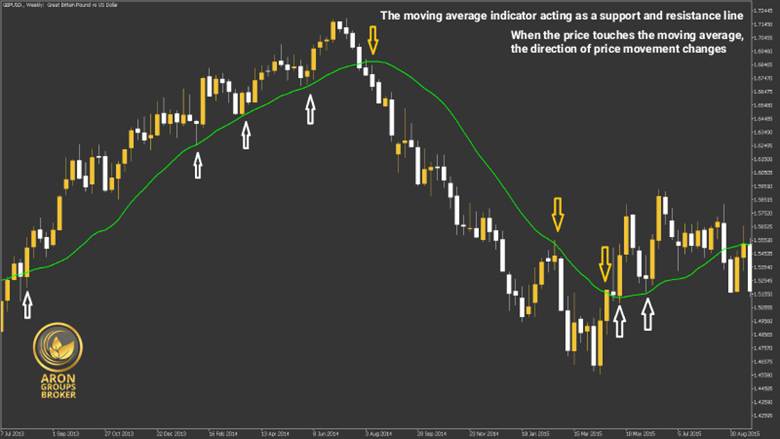
In the chart below, you can see how the moving average indicator acts as dynamic support and resistance during both upward and downward trends. This is one of the clearest examples of how support and resistance levels change as the market moves.
When the price chart is above the moving average, the moving average becomes a support level. In this situation, each pullback toward the rising moving average can be viewed as a buying opportunity for anyone who wants to trade support and resistance.
When the price chart is below the moving average, the moving average acts as a resistance level. Each pullback toward this line can be considered an exit signal. This behavior helps traders better understand what is support and resistance in trading and how these resistance and resistance lines guide market reactions.
Fibonacci
According to investopedia, the Fibonacci tool highlights potential support and resistance levels on the price chart.
Both Fibonacci retracement and Fibonacci expansion are powerful tools for identifying support and resistance levels. Below you can see two examples of how Fibonacci is used in uptrends and downtrends for support and resistance trading.
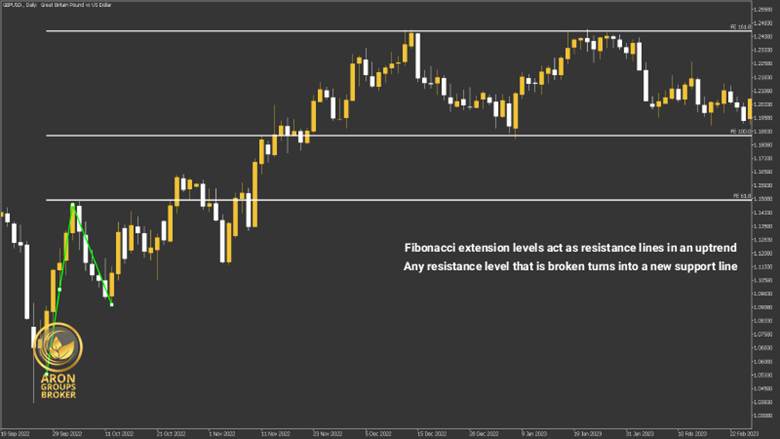
Fibonacci Expansion in an Uptrend
In an uptrend, Fibonacci expansion levels help identify resistance. In the chart below, notice how the 168 point 1 Fibonacci level acted as a strong resistance line and did not allow the price to rise further. When the price reacts to a resistance level like this, traders may consider it a sell signal.
Any resistance level that breaks can later turn into a new support level. This pattern is common when analyzing support level and resistance level behavior.
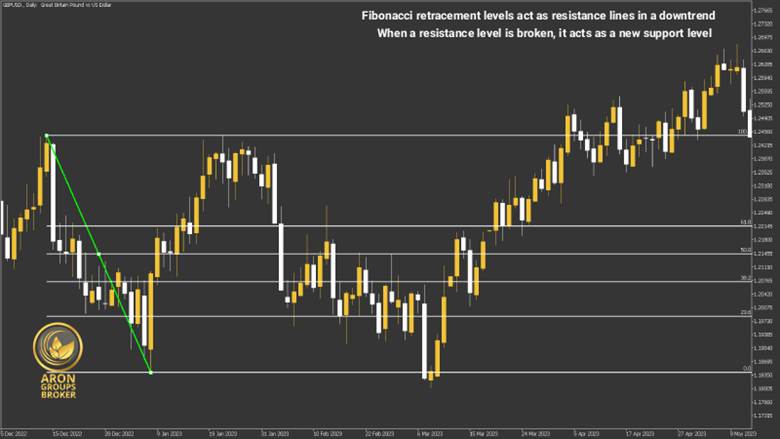
Fibonacci Retracement in a Downtrend
In a downtrend, Fibonacci retracement levels typically act as resistance. When the price reaches these levels, it often changes direction and falls again. Touching a Fibonacci retracement level in a downtrend is usually interpreted as a sell signal.
A resistance level that has been broken once can act as a new support level the next time price touches it. This is one of the foundations of support and resistance trading in both forex and stock support and resistance analysis.
Pivot Point
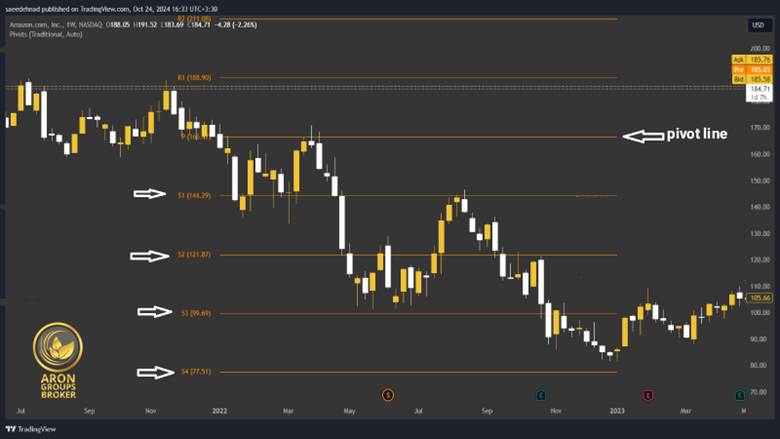
The pivot point indicator identifies support and resistance based on the key levels from the previous trading day.
If the price moves above the pivot line, the market is considered to be in an uptrend and price interacts with pivot resistance levels labeled R1, R2, and so on
If the price moves below the pivot line, the market is in a downtrend and price reacts to pivot support levels labeled S1, S2, and so on
For example, in the chart below, the price touches pivot support levels during a downtrend and these levels prevent further decline. Whenever a support level breaks, it becomes a new resistance line in the future. This is another clear example of how traders can trade support and resistance using pivot levels.
To find accurate entry and exit points with pivot points, look for moments when price bounces upward from a support level or turns downward from a resistance level.
Bollinger Bands
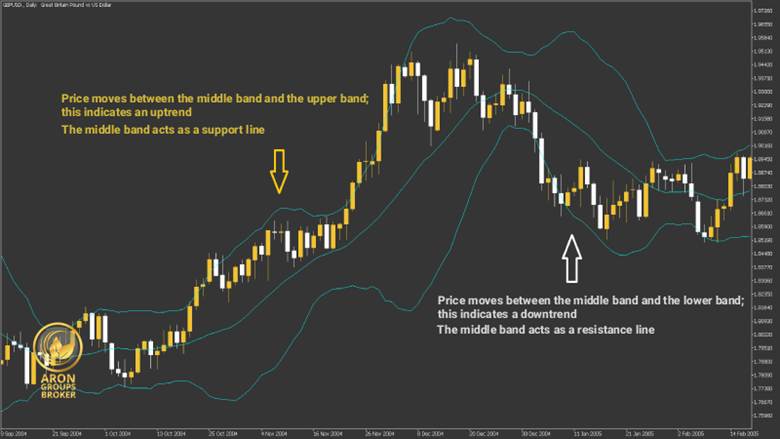
Bollinger Bands consist of three lines, including a middle line and an upper and lower band. Bollinger Bands are based on the idea that price eventually returns to the middle line, which represents the average price.
The middle line is a simple moving average and depending on the direction of the trend, it becomes either a support line or a resistance line.
When the price chart moves between the middle line and the upper band, the trend is upward and the middle line acts as support. A pullback toward the middle line in this situation is a buy signal
When the price moves between the middle line and the lower band, the trend is downward and the middle line acts as resistance. A pullback toward this line becomes a sell signal
These behaviors help traders better understand support and resistance and improve their ability to trade support and resistance effectively.
The Role of Trading Volume in Identifying Support and Resistance
Trading volume plays an important role in identifying strong support and resistance. Although tools and indicators can help mark support and resistance levels on the chart, some levels are more reliable than others. Several factors increase the strength of support and resistance levels, including the following
- A greater number of price reactions to the level.
- A higher time frame, which usually creates stronger support and resistance levels, for example, daily charts compared to one-hour charts.
- A stronger and steeper trend before the price reaches the level, which makes the support level and resistance level more meaningful.
- A higher trading volume at support and resistance levels.
When trading volume around support and resistance levels increases, it shows that these levels were strong in the past and that traders still remember them. This memory effect makes traders react again when the price reaches the same support and resistance levels.
Even if technical analysis or fundamental analysis does not accurately predict where support and resistance levels may form, a high volume of active traders at these zones can create real market reactions. Price may slow, bounce, or reverse completely when volume confirms resistance and support levels.
This is why volume is an essential part of support-and-resistance trading. It strengthens the credibility of support and resistance levels and helps traders trade them with greater confidence. Understanding how volume interacts with these levels also helps answer the question of what support and resistance in trading are, and why certain stock or forex support and resistance levels are more influential than others.
A breakout above a well-tested support or resistance level accompanied by high trading volume tends to indicate a sustainable trend shift, whereas breakouts on low volume often fail or reverse.
Key Points in Support and Resistance Trading
According to an article on the priceaction website about trading on support and resistance, once you can identify support and resistance levels, you can begin placing trades based on these levels. When applying a trading strategy that uses support and resistance, keep the following key points in mind
- Use higher time frames to draw support and resistance lines, such as daily or weekly charts.
Trade only at support and resistance levels that have high reliability
- Look for confirmation signals for entries and exits by using additional tools and strategies, such as price action and fundamental analysis, before taking a trade.
- Enter a long position at a support level and exit at a resistance level.
- Enter a short position at a resistance level and exit at a support level.
- Follow proper risk management throughout your support and resistance trading.
- A breakout of support and resistance levels can be a sign of a strong trend beginning. Therefore, stay alert to breakouts of support and resistance levels and be prepared to enter trades in the direction of the breakout.
These guidelines help traders understand how to trade support and resistance more effectively and improve decision-making when dealing with support and resistance levels or lines across different market conditions.
Risk Management in the Support and Resistance Strategy
Risk management in the support and resistance strategy involves setting stop loss and take profit orders in a way that protects the trader while taking advantage of support and resistance levels. Within this strategy, two main types of trades can be executed
- Long position;
- Short position.
Long Position
To take a long position using support and resistance, follow these steps:
- Identify the support and resistance lines.
- Enter the trade when the price bounces upward from the support level.
- Place your stop loss close to the support line and set your take profit target near the resistance level.
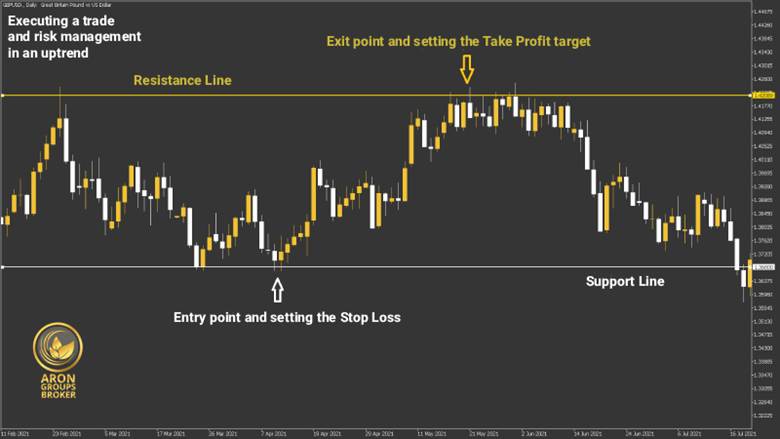
This process helps traders who want to trade support and resistance with a structured plan that respects support level and resistance level behavior.
Short Position
To take a short position within support and resistance trading and apply proper risk management, follow these steps:
- Identify the support and resistance lines.
- Enter the trade when the price reverses downward from the resistance line.
- Place your stop loss close to the resistance line so that you limit potential losses if the price moves upward.
- Set your take profit target near the support level.
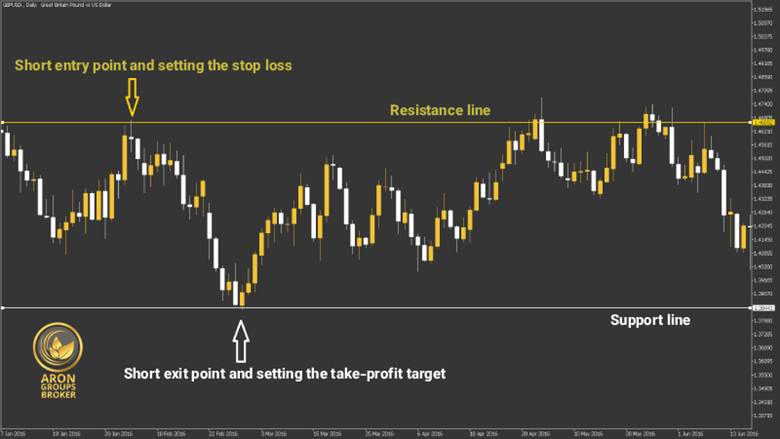
These steps help traders understand what support and resistance in trading and how resistance and support lines can guide both entries and exits. Traders who use support and resistance consistently can gain a clearer view of market structure whether they trade forex or stock support and resistance setups.
Trader Psychology in Using Support and Resistance Levels
Trader psychology plays a major role in how support and resistance levels form and how the market reacts to them. If all traders acted purely based on logic, support and resistance might not work as effectively. But in reality, most traders make decisions driven by emotion rather than pure logic, and this emotional decision making strengthens support and resistance levels on the chart.
For example, if price growth stopped in the past when it reached a specific price level that we can call level X, traders give that level a special meaning. They start to believe that price may stop again when it reaches the same level X. Because of this belief, many traders place exit orders at that level which often happens to be a round number. The large number of exit orders creates strong selling pressure which gives sellers an advantage over buyers. This emotional reaction from traders turns level X into a real resistance level.
This does not necessarily mean that level X is a resistance level predicted by technical analysis or fundamental analysis. Instead, the support and resistance levels often form because of the collective emotional behavior of traders. That emotional behavior transforms certain price zones into genuine resistance and support lines in the market. This is a key concept for anyone studying what is support and resistance in trading or for traders who want to trade support and resistance more effectively.
Advantages and Disadvantages of a Trading Strategy Based on Support and Resistance
Using a trading strategy built around support and resistance can offer both advantages and disadvantages. Below are the main points traders often consider when working with support and resistance levels.
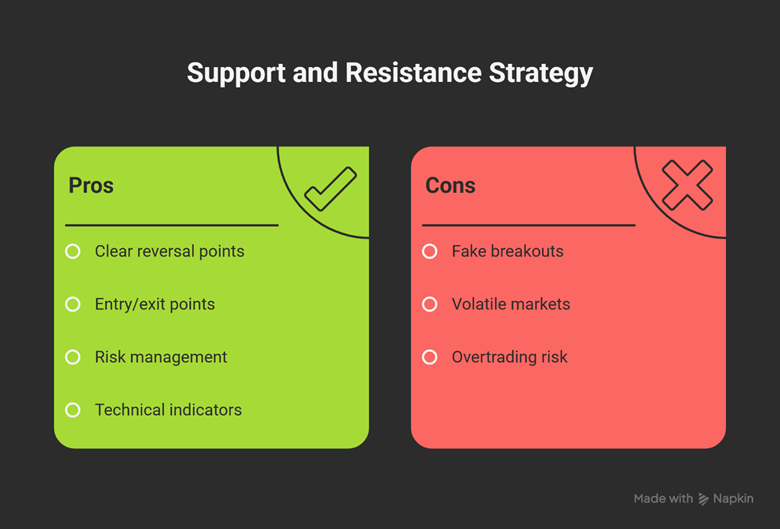
Advantages of Using a Support and Resistance Strategy include:
- It gives traders a clear view of potential market reversal points
- It is very helpful for identifying entry and exit points and for setting risk management orders
- Many technical indicators are available to help traders draw support and resistance levels accurately
These benefits make support and resistance trading a widely used method among traders who want structured and disciplined analysis. It also helps traders understand what is support and resistance in trading and improves their ability to trade support and resistance with confidence.
Disadvantages of Using Support and Resistanceinclude:
- There is always a possibility of fake breakouts which can cause early entries or early exits
- In highly volatile markets, previous support and resistance levels may lose reliability and become misleading
- Relying only on support and resistance to find trading opportunities can lead to overtrading and increased risk for traders
These limitations mean that traders should combine support and resistance levels with other tools and avoid depending solely on resistance and support lines. By doing so, they can manage risk better and improve decision making whether they analyze forex or stock support and resistance setups.
Support and resistance levels observed on higher time-frames (daily, weekly) carry greater credibility and are more reliable than those on shorter time-frames, especially when multiple time-frames align.
Comparing the Support and Resistance Strategy with Other Trading Strategies
It is easy to say that compared to many other trading strategies, the support and resistance strategy is one of the most widely used methods among traders. But can we also say that it is the best strategy available?
The answer is that although support and resistance levels are highly effective and offer a broad and often accurate view of potential market reversal points, relying too heavily on these levels can be misleading and may cause problems for traders. This is especially true because no technical indicator or trading tool can offer complete certainty. This uncertainty applies to support and resistance levels as well.
Therefore, the best way to use support and resistance levels is to combine them with other trading strategies such as trend trading, price action, fundamental analysis, and more. When traders use support and resistance levels alongside additional strategies, they gain a clearer and more reliable view of market structure and are less likely to make emotional or impulsive decisions.
After price reaches a support level, the market often experiences a bounce. This reaction is one of the fundamental behaviors that helps traders understand what support and resistance in trading and how support and resistance levels interact with price movement. It also helps traders who want to trade support and resistance or analyze resistance and support lines in different market conditions.
Conclusion
Support and resistance help traders understand where market forces shift between buyers and sellers. Support levels show where buying pressure strengthens and prevents further decline, while resistance levels indicate where selling pressure increases and stops movement upward. These support and resistance levels can be identified through tools such as the moving average and Fibonacci, and they highlight zones where price is likely to react or reverse.
Because price movement around support and resistance is never guaranteed, proper risk management is essential. Traders who want to trade support and resistance should use stop loss orders and confirm their trades with additional technical indicators or price action signals. Using these methods helps traders understand what support and resistance in trading and improves the reliability of support and resistance trading in different market conditions.