


Within every price chart, there are hidden points that shape the market’s future direction and influence upcoming moves. Swing highs and swing lows are exactly these key points, peaks and troughs that help you spot trend changes earlier. Traders seeking a more precise read of market structure will see only an incomplete picture without understanding these swing points.
In this article, we explain what swings are, how to identify them, and how they support trend analysis and strategy design.

- Swing highs and swing lows are clear reversal points, typically identifiable within about 20 candles and spotted visually.
- A Swing High forms when price reaches a peak and then declines, while a Swing Low forms after hitting a bottom and rebounding.
- Trend direction and strength can be analyzed by tracking swing patterns; higher highs and higher lows suggest an uptrend.
- Lower highs and lower lows indicate a downtrend, helping traders confirm whether bearish structure is still intact.
- Swings help define entry and exit areas and set stop-loss levels, and they can be combined with other indicators.
What Do Swing High and Swing Low Mean?
Swing Highs and Swing Lows are two essential concepts in technical analysis, representing the turning points of price action on a chart. These swing points mark the highest and lowest price levels within a short period, usually fewer than twenty candles on most timeframes.
Each point behaves differently compared to nearby price data, helping traders read market structure and anticipate potential trend reversals with precision.
What Is a Swing High?
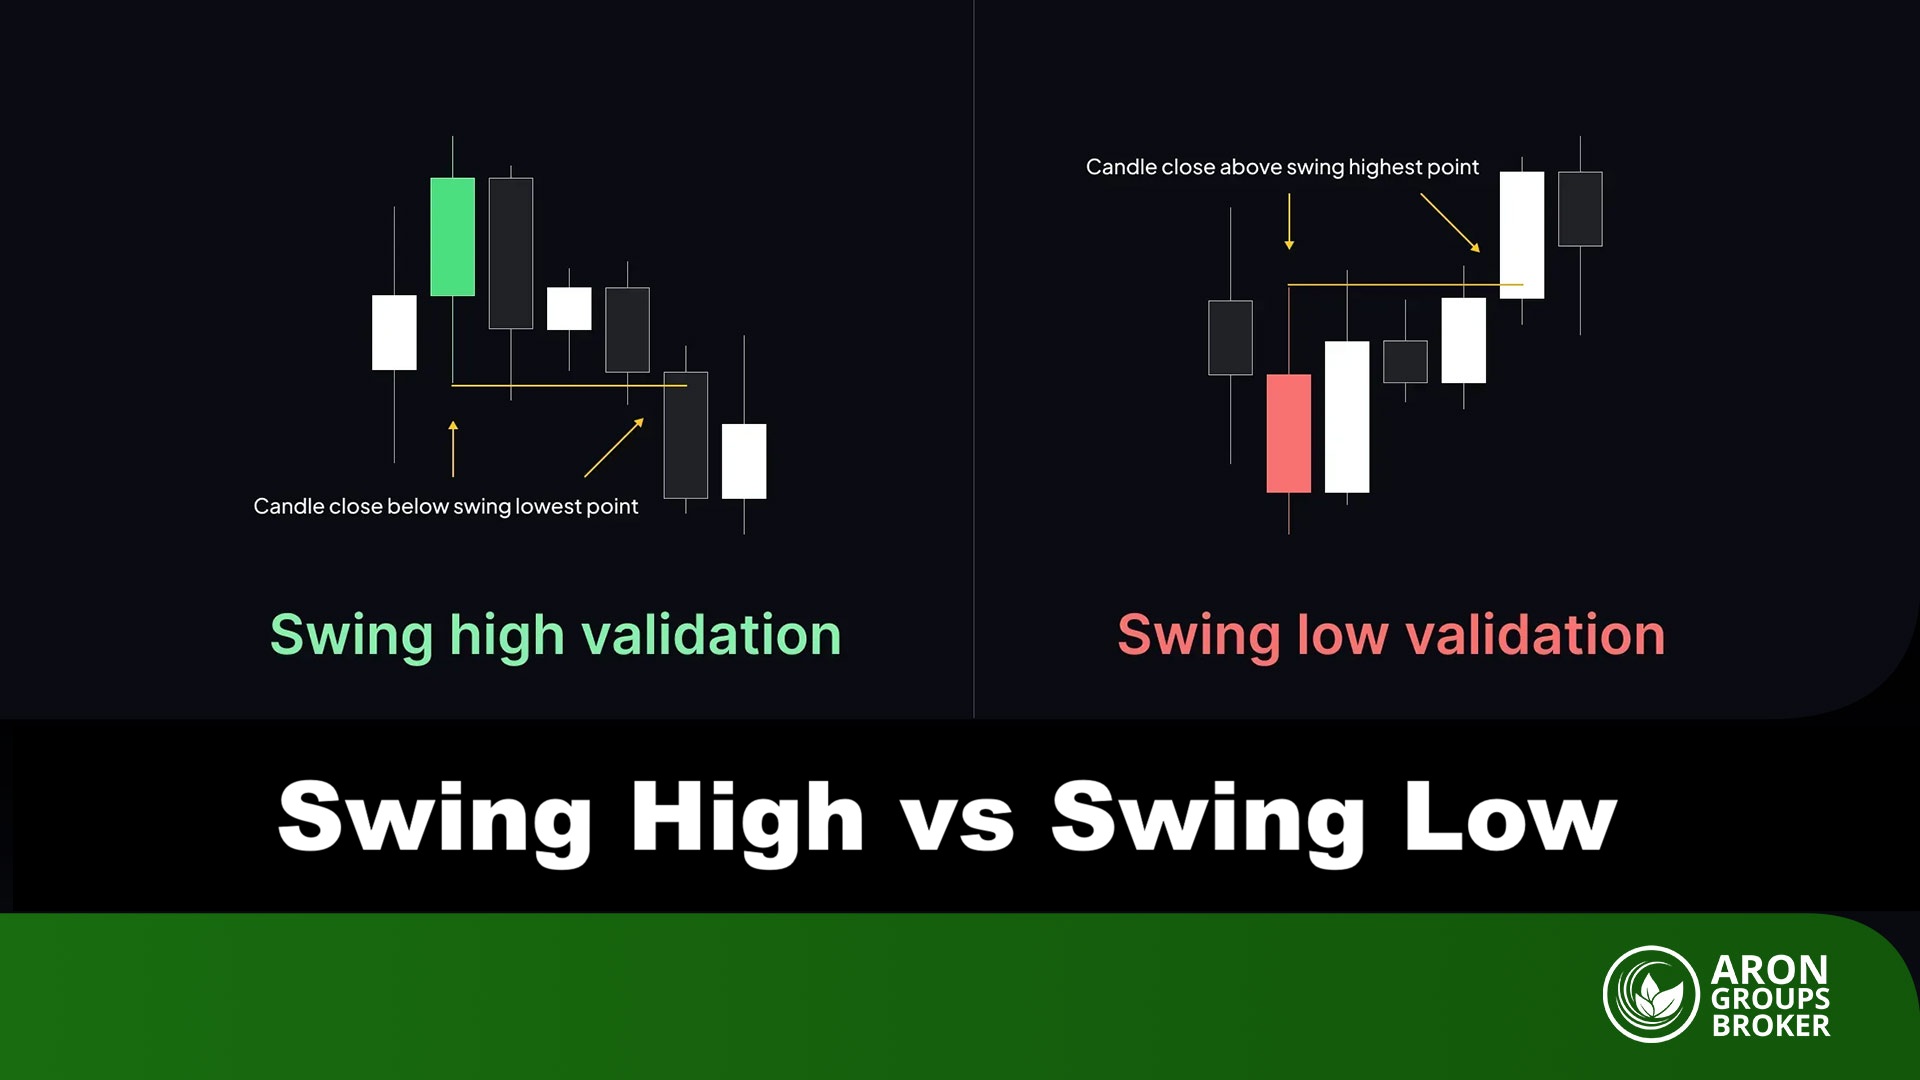
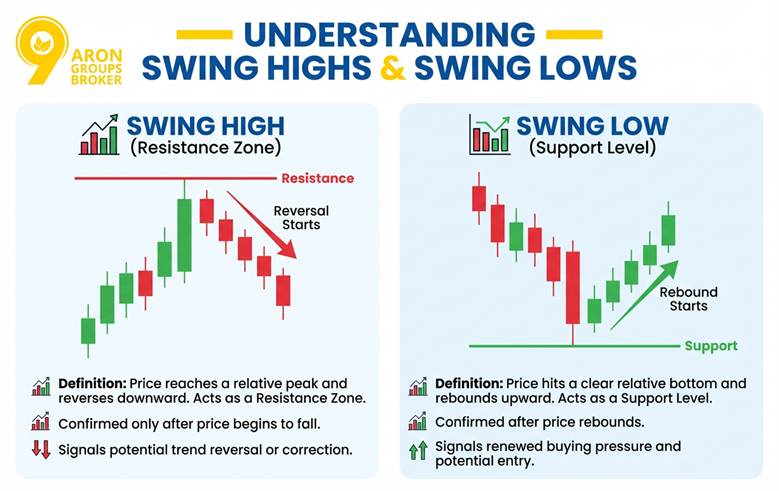
A Swing High occurs when an asset’s price reaches a new relative peak and then reverses downward, starting a corrective or bearish move.
This high usually stands above surrounding candles and is confirmed only after price begins to fall and the reversal becomes visible.
In trend analysis, identifying swing highs helps traders locate resistance zones and evaluate whether the upward momentum is weakening or continuing. Until the decline actually starts, the swing high remains unconfirmed, meaning the market could still extend higher before a confirmed reversal.
What Is a Swing Low?
According to Investopedia, a Swing Low represents a chart point where price hits a clear relative bottom and then rebounds upward from that level. This low defines the lowest price within a chosen period and signals renewed buying pressure after a temporary drop in momentum.
In different timeframes, swing lows may vary, offering traders flexibility to interpret price action based on their preferred strategy or holding horizon. Overall, swing lows act as visual support levels, helping confirm trend direction and identify potential entry zones within the broader market structure.
How to Identify Swing Highs and Swing Lows on a Chart?
Identifying Swing Highs and Swing Lows is crucial for trend analysis and spotting market reversal points. These points can be identified by combining Price Action, candlestick patterns, and the right time frame.
Using Price Action to Identify Swing Highs and Swing Lows
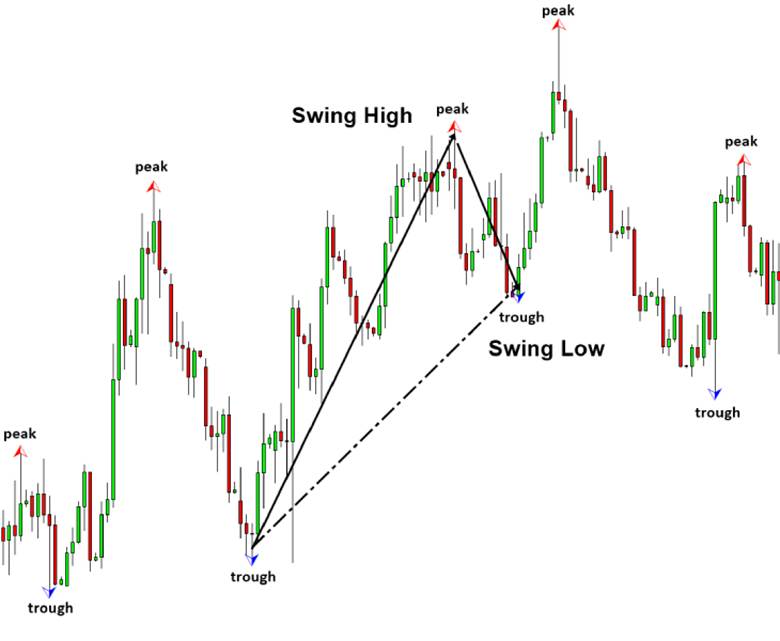
Swing Highs and Swing Lows in Price Action are recognized when a peak (Swing High) or trough (Swing Low) stands out compared to surrounding candles.
Combining with Candlestick Patterns
Candlestick patterns like the hammer, engulfing, or three black crows can confirm the formation of Swing Highs and Swing Lows.
For example:
- Point 1 in the image is a Swing High because it is higher than adjacent candles, followed by a price decrease.
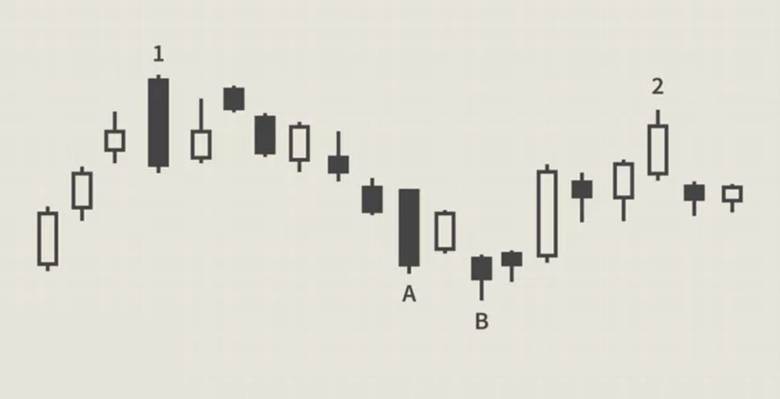
- Point B is a Swing Low, as the price dropped to its lowest point and then reversed.
Difference Between Swing Highs/Swing Lows and Classic Tops/Bottoms
Classic tops and bottoms refer only to the highest or lowest price over a period. They are often used in basic analysis. These levels may not stand out on charts and may not prompt a market reaction.
In contrast, Swing Highs and Swing Lows are defined by price behavior and strong reversals compared to adjacent candles. They show where buyers or sellers have gained strength and shifted the trend. Therefore, they are more valuable for Market Structure Trading, Price Action, and trading strategies.
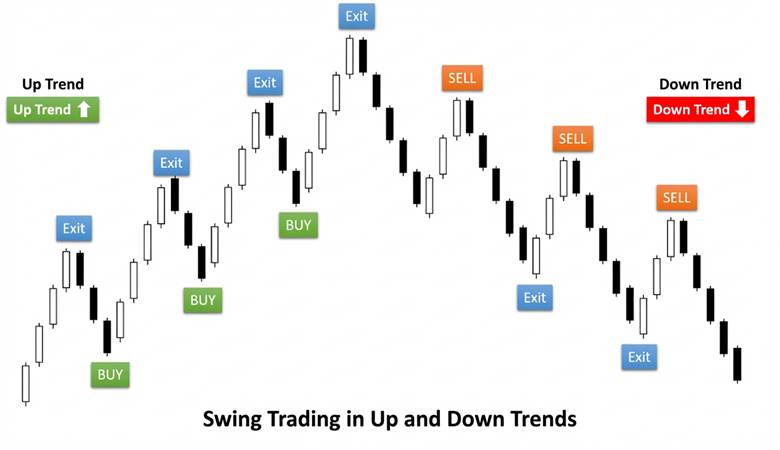
The chart below clearly shows how Swing Highs and Swing Lows define the market’s direction:
- Swing Highs are marked by points where the price rises and then falls.
- Swing Lows are marked by the lowest points where the price reverses.
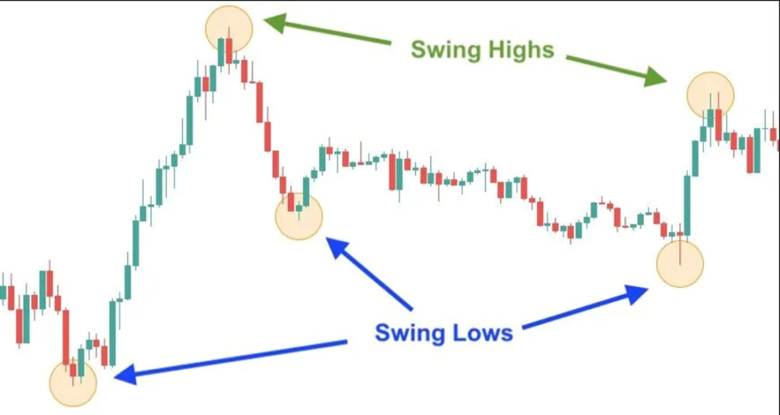
Unlike classic tops and bottoms, Swing Points respond to actual price behavior, mapping the market structure.
Best Timeframe for Identifying Swing Points
The chosen time frame is crucial for accurately identifying Swing Highs and Swing Lows. It impacts price noise and signal reliability. On short-term time frames like 1-minute to 15-minute charts, rapid, smaller Swing Highs and Swing Lows appear. These are often noisy, increasing the chance of false signals.
Long-term time frames, like daily, weekly, or monthly charts, display more significant, stable Swing Points. They reflect the main market trends but reduce quick entry and exit opportunities.
Mid-term time frames, like 1-hour, 4-hour, or daily charts, offer the best balance between accuracy and reducing noise. They allow traders to identify meaningful Swing Highs and Swing Lows while basing decisions on the actual trend structure.
Using multi-timeframe analysis is recommended. A trader can identify key Swing Points on higher time frames and use lower time frames for timing entries and exits. The right time frame should align with the trader’s strategy and goals.
| Trading Style | Appropriate Time Frame for Swing Analysis |
|---|---|
| Swing Trading | 1 to 4 hours, or daily |
| Day Trading | 5 to 30 minutes |
| Position Trading | Daily or weekly time frames |

Swing points are more reliable on larger time frames, but they appear more slowly. Lower time frames are more sensitive, but they have more noise.
Application of Swing Highs and Swing Lows in Trend and Market Structure Analysis
When the market is in a steady uptrend, higher highs and higher lows typically form. In this case, each new Swing High is higher than the previous one, and each Swing Low is lower than the last. This structure indicates that buyers still control the market.
In contrast, during a downtrend, lower highs and lower lows form, showing seller dominance and strong bearish pressure.
| Trend Type | Swing Behavior | Market Structure Interpretation |
|---|---|---|
| Uptrend | Higher Highs (HH) and Higher Lows (HL) | Buyer strength, continuation of the uptrend |
| Downtrend | Lower Highs (LH) and Lower Lows (LL) | Seller dominance, continuation of the downtrend |
Identifying Trend Changes or Price Corrections
One important use of Swing Highs and Swing Lows is determining if the market trend is changing or just correcting.
For example, if the market is rising and forms higher highs and lows, but suddenly a lower high or low appears, this may signal a trend reversal.
In a downtrend, if a higher low or high suddenly forms, it may signal the end of the downtrend and the start of an uptrend.
In many market analysis methods, such as Dow Theory, if the price breaks a Swing High or Swing Low, it is typically considered a warning of a trend change.
Useful Tools and Indicators for Identifying Swing Highs and Swing Lows
To identify Swing Highs and Swing Lows more accurately, there are tools that help traders detect reversal points faster.
Using the Zigzag Indicator
The Zigzag Indicator is a visual tool that automatically marks Swing Highs and Swing Lows on the chart. It removes small price noise and highlights major price movements.
The Zigzag Indicator works based on price percentage changes or candle counts. It shows a new high or low when the price changes significantly.
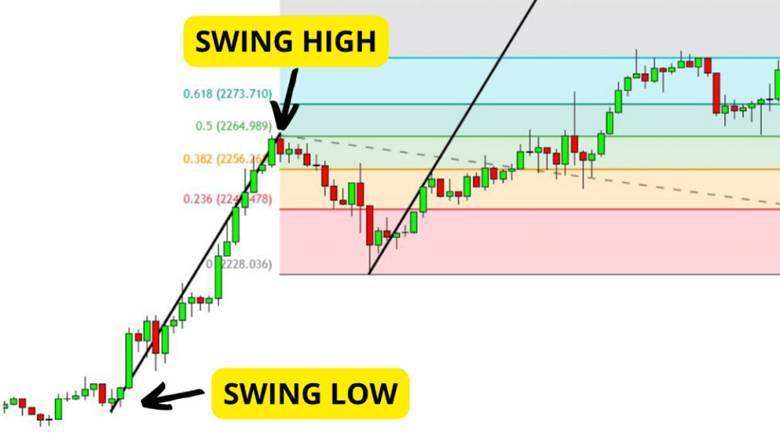
Fibonacci’s Role in Identifying and Analyzing Swing Highs and Lows
The Fibonacci tool is widely used to analyze price fluctuations. Combining Fibonacci with Swing Highs and Swing Lows helps identify potential price reversals.
This tool helps you mark areas where the price is likely to stop, reverse, or bounce.
Combining Swing Highs and Lows with ATR or RSI Indicators
To improve Swing High and Swing Low analysis, combine them with indicators like ATR or RSI for better accuracy.
Analyzing Volatility with ATR
The ATR (Average True Range) indicator measures market volatility. If a Swing High or Swing Low forms during high volatility, it is stronger.
ATR also helps determine a logical stop loss alongside Swing Lows or Swing Highs for better risk management.
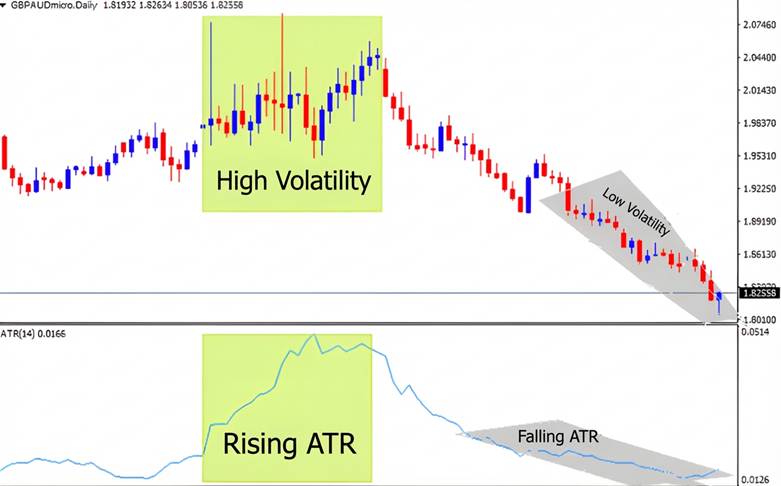
The chart above shows price fluctuations, and the chart below displays the ATR indicator. In the green section, ATR rises, indicating high market volatility.
In the gray section, a decrease in ATR suggests lower volatility and a calmer market. This relationship helps analyze Swing Points with greater strength during volatile conditions.
Analyzing Market Strength with RSI
The RSI (Relative Strength Index) indicator shows if the market is overbought or oversold.
For example:
- If RSI is above 70 and a Swing High forms, a price reversal is likely.
- If RSI is below 30 and a Swing Low forms, a price reversal upwards may occur.
Swing High and Swing Low Trading Strategy
Swing Highs and Swing Lows are not just simple points on a chart; they can serve as the foundation for a precise trading strategy.
These strategies include identifying price reversal zones, determining entry and exit points, setting appropriate stop-loss levels, and avoiding common analysis mistakes.
How to Determine Entry and Exit Points with Swing Highs and Swing Lows
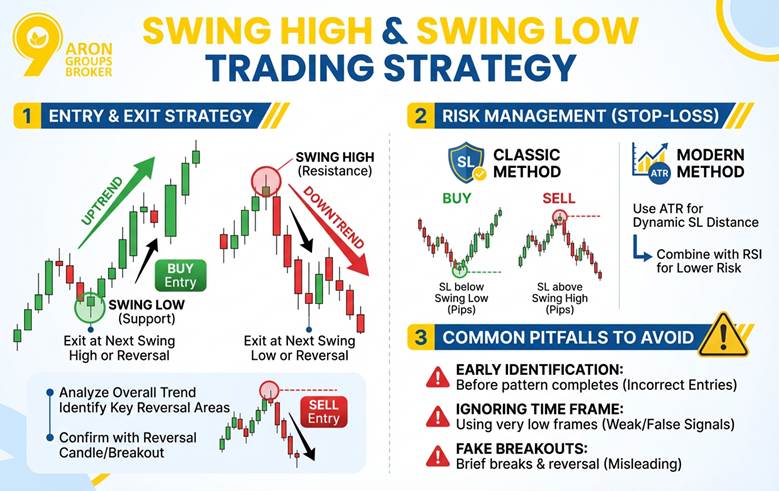
To enter a trade intelligently using Swing Highs and Swing Lows, first, identify the key price reversal areas.
Suggested steps:
- Analyze the overall trend (uptrend or downtrend).
- Find a Swing Low in an uptrend or a Swing High in a downtrend.
- Enter the trade after confirming the reversal (e.g., using a reversal candle or a breakout).
For example, in an uptrend, when the price rises above a Swing Low and a bullish candle confirms the movement, you can enter a buy trade. The Swing Low acts as a support level.
How to Set Stop-Loss Levels Using Swing Highs and Swing Lows
Placing a logical stop-loss is an integral part of risk management in Swing High and Swing Low-based trades.
Classic Method:
- For a buy trade, place the stop-loss a few pips below the Swing Low.
- For a sell trade, place the stop-loss a few pips above the Swing High.
Modern Method:
- Use the ATR to calculate a dynamic stop-loss distance based on market volatility.
- Combine Swing Highs and Swing Lows with indicators like RSI to find lower-risk entry points.
Common Mistakes in Swing High and Swing Low Analysis
While Swing Highs and Swing Lows are powerful tools, they can lead to mistakes if not used carefully.
- Early Identification of Swing Points: Identifying a Swing High or Swing Low before the pattern completes can lead to incorrect entries.
- Ignoring the Appropriate Time Frame: Using very low time frames may produce many weak signals that can lead to false entries.
- Fake Breakouts: Sometimes, the price briefly breaks a previous Swing High or Swing Low, only to reverse direction. This phenomenon can mislead inexperienced traders.
Tip:
Always confirm Swing Points by combining Price Action, volume, and indicators to avoid getting tricked by rapid market movements or noise.
Conclusion
Swing Highs and Swing Lows are not just chart points; they are tools for understanding market positioning and potential movement. Understanding this oscillating structure allows you to make more precise trades, smarter stop-losses, and better entry and exit points.
Combining them with tools like Fibonacci, oscillators, and Price Action analysis gives deeper insights into price behavior at a glance. This skill is developed by practicing, analyzing real charts, and comparing Swing Highs and Swing Lows across various time frames.