


In the dynamic world of financial markets, awareness of risk is not just a wise choice but an undeniable necessity. One of the most well-known and practical tools for measuring and managing this risk is Value at Risk (VaR). This metric, which transforms the complexity of market fluctuations into a straightforward, understandable number, helps investors and managers assess the worst-case scenario and determine how much their investments might be at risk of loss under adverse conditions.
If you want to learn how to make smarter financial decisions using a simple statistical tool, don’t miss the rest of this article.

- Value at Risk (VaR) indicates the maximum potential loss within a specified confidence level and time period, represented by a single number.
- Due to its widespread adoption by regulatory bodies and financial institutions, Value at Risk (VaR) has become a universal language for expressing and comparing risk across global markets.
- A key limitation of Value at Risk (VaR) is that it does not predict losses beyond the defined threshold, potentially overlooking the severity of rare or extreme losses.
What is Value at Risk (VaR) and What Are Its Applications?
As stated on Investopedia, Value at Risk (VaR) is a statistical measure used to assess the maximum potential loss of a specific investment, a portfolio, or a company over a defined time period and with a specified confidence level. In other words, VaR indicates the likelihood that the loss on an investment will not exceed a specified amount.
VaR primarily focuses on systematic risk, as this tool is designed to measure overall market risk and its associated fluctuations.
With the help of Value at Risk (VaR), investment managers and investors can understand the extent of their exposure to potential losses and take necessary actions to avoid such risks.
Main Applications of Value at Risk (VaR)
The primary applications of Value at Risk (VaR) can be summarized in three key areas:- Risk Management: Risk managers can compare the calculated VaR with established Risk Limits to decide whether they need to reduce trading positions. Additionally, by combining VaR with Stress Testing, they can evaluate the impact of extreme market scenarios on the portfolio.
- Financial Reporting and Regulatory Compliance: Banks and financial institutions are required under the Basel Accords to calculate and report the VaR of their trading portfolios to demonstrate they have sufficient capital to cover potential losses. In this way, VaR serves as a standard indicator that helps stakeholders and regulators understand an organization’s overall risk.
- Capital Allocation and Portfolio Optimization: VaR is an efficient tool for managing capital. By using Value at Risk (VaR), investors can identify which parts of a portfolio generate the highest risk and allocate capital to assets with suitable returns and manageable risk. Additionally, as a quantitative measure, VaR allows comparisons between different strategies, markets, or financial instruments.

While VaR measures potential short-term risks, Drawdown analyzes long-term risks and assesses significant losses, as well as the time required to recover to peak levels.
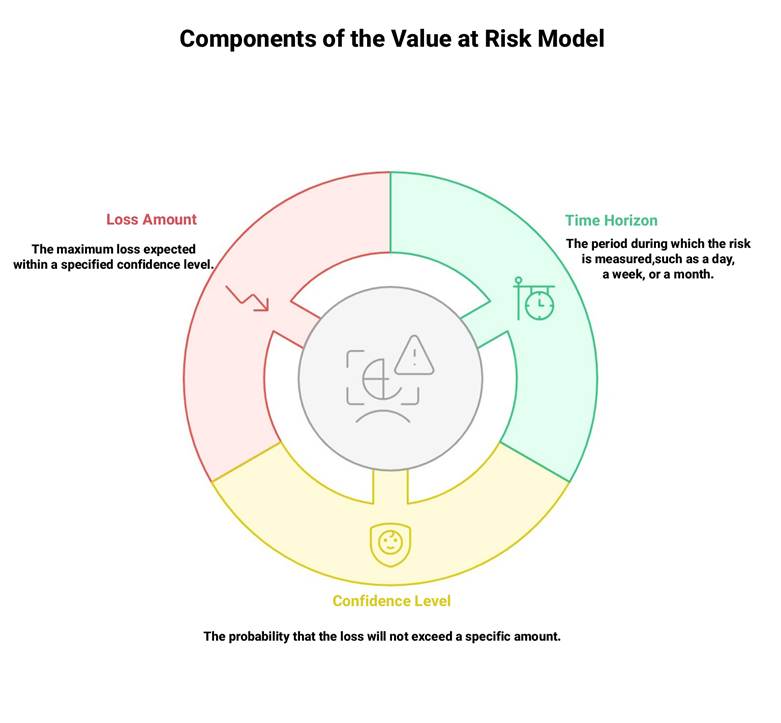
Key Components of the Value at Risk (VaR) Model
The VaR model is based on three main components:
- Time Horizon: The period over which the risk is measured (e.g., one day, one week, or one month). For example, a 1-day VaR indicates the maximum potential loss over a single day.
- Confidence Level: The percentage probability that the loss will not exceed a certain amount. The most commonly used confidence levels in Value at Risk (VaR) are 95% and 99%. For instance, if the VaR at a 99% confidence level is 5 billion dollars, it means that on only 1% of days a loss greater than 5 billion dollars is expected.
- Loss Amount: The VaR value or the maximum expected loss with a specified confidence level over a defined time horizon. Value at Risk (VaR) is typically expressed in monetary units (e.g., dollars), but it can also be reported as a percentage of portfolio value. For example, VaR = 3% means that, with a certain probability, the maximum expected portfolio loss over the specified time period is 3%.
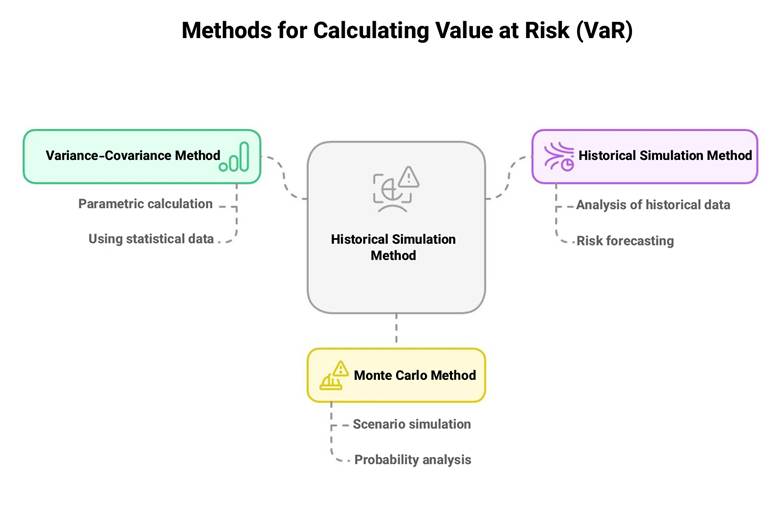
Common Methods for Calculating Value at Risk (VaR)
There are various methods for calculating Value at Risk (VaR), with the most common ones being:
- Variance-Covariance Method (Parametric Method);
- Historical Simulation Method;
- Monte Carlo Simulation Method;
Variance-Covariance Method (Parametric Method)
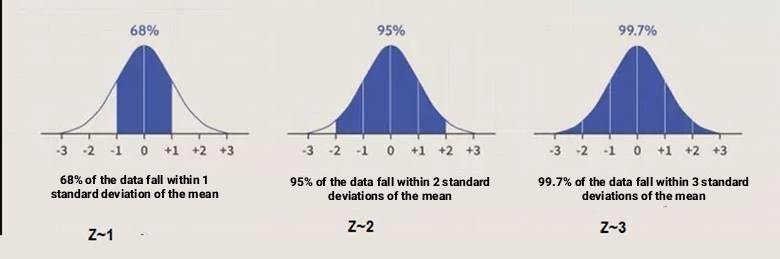
In this method, focusing on the future, the expected value or mean of the assets is calculated first, followed by potential losses as the standard deviation of returns. Since it is assumed that asset returns follow a normal distribution, the maximum loss can be calculated at the specified confidence level.
A normal distribution is a statistical distribution with a symmetric, bell-shaped curve, indicating that most data points are concentrated around the mean. In the figure below, you can see examples of normal distribution curves.
Formula for calculating VaR using the Variance-Covariance Method (Parametric Method):
VAR = (Z ✖ σ) ✖ V
Where:
- Z: The coefficient corresponding to the confidence level, taken from the normal distribution curve (for 95%, it’s about 1.65, and for 99%, it’s about 2.33);
- σ: The standard deviation (volatility) of the portfolio or asset, calculated from historical return data;
- V: The current value of the asset or portfolio (in monetary units).
Practical Example:
Suppose your portfolio includes an asset worth 1 billion dollars, with a daily return standard deviation of 2%, and the confidence level is 95% (i.e., Z = 1.65):
VaR = 1.65 ✖ 0.02 ✖ 1,000,000,000 = 33,000,000
This means that, with a 95% probability, the daily loss will not exceed $ 33 million.
Historical Simulation Method
In this method, historical price and return data are collected and sorted from the largest losses to the highest gains. The Value at Risk (VaR) is directly extracted from the actual distribution of the data. This method does not require an assumption of normality for the data, but its accuracy depends on the quality and length of the historical data.
The main assumption behind historical simulation is that past return behavior can reliably represent and predict future outcomes.
Monte Carlo Simulation Method
This method involves simulating a large number of random scenarios for price movements and calculating returns to estimate the distribution of losses. The Monte Carlo simulation method offers high flexibility and can model complex market scenarios. However, it is computationally intensive and requires significant processing power.
Applications of Value at Risk (VaR) in Financial Markets and Investment
The applications of Value at Risk (VaR) in financial markets and investment can be categorized into several key areas, each contributing to better capital management and more effective risk control:
Using Value at Risk (VaR) in Portfolio Management
Investors and fund managers use Value at Risk (VaR) to understand the maximum potential loss they may face under worst-case conditions. Moreover, by calculating portfolio value-at-risk across different portfolios, they can select the optimal combination of return and risk.
In addition, VaR serves as a practical tool for monitoring daily changes in portfolio risk driven by market fluctuations. By tracking VaR over time, managers gain a clearer picture of how market volatility affects overall exposure.
The Role of Value at Risk (VaR) in Banking and Financial Institutions
Banks and financial institutions are required under the Basel Accords to report their Value at Risk (VaR) to ensure sufficient regulatory capital is maintained to cover potential risks. In this context, VaR risk management plays a critical role in safeguarding the financial system’s stability and ensuring compliance with international regulations.
The Basel Committee generally considers a 10-day Value at Risk (VaR) with a 99% confidence level as the mandatory regulatory standard.
This benchmark plays a central role in VaR risk management and is widely used within value at risk models in finance to assess capital adequacy under extreme market conditions.
Application of Value at Risk (VaR) in Derivatives Markets and Algorithmic Trading
In options contracts, futures markets, and algorithmic trading, Value at Risk (VaR) helps ensure that trading strategies are executed with precise risk control. VaR allows traders and institutions to better understand the impact of leverage and extreme price volatility on the total value of their positions.
In these advanced markets, different value at risk models in finance are often employed to capture complex risk dynamics and enhance decision-making accuracy.
Advantages and Disadvantages of Value at Risk (VaR)
Like any financial tool, Value at Risk (VaR) has its own strengths and limitations. Below, we review the most important pros and cons of Value at Risk in risk measurement and VaR risk management.
Advantages of Value at Risk (VaR)
The key advantages of Value at Risk (VaR) include:
- Simple and easy to understand: Value at Risk provides a single numerical figure that represents the maximum potential loss over a specific time horizon and confidence level.
- Enables risk comparison: Value at Risk allows for direct comparison of risk between different assets, portfolios, and companies, making it a powerful benchmarking tool in portfolio value at risk analysis.
- Applicable to a wide range of asset classes: Value at Risk can be used for equities, bonds, derivatives, commodities, and currencies, making it a versatile value at risk model across financial markets.
- Widely used in capital management and regulatory compliance: VaR risk management plays a central role in both internal risk control and meeting regulatory requirements.
- Flexible calculation methods: Value at Risk can be calculated using different approaches, including the parametric method, historical simulation, and Monte Carlo simulation—each representing major value at risk models in finance.
Disadvantages of Value at Risk (VaR)
Despite its popularity, Value at Risk (VaR) also has several important limitations:- Dependent on restrictive assumptions: Many Value at Risk models assume that returns follow a normal distribution—an assumption that often fails during real-world market turbulence.
- Only shows the loss threshold, not extreme losses: Value at Risk indicates the maximum expected loss up to a certain confidence level but does not reveal how severe losses can be beyond that point.
- Highly dependent on historical data quality: The accuracy of the VaR value strongly depends on the length and quality of historical data. Incomplete or short datasets can lead to misleading value at risk example outcomes.
- Ignores liquidity risk in crisis conditions: Value at Risk assumes assets can be liquidated easily, even during market crashes, which is not always realistic.
- Complex and computationally expensive for large portfolios: In large multi-asset portfolios, calculating portfolio value at risk becomes highly complex and costly, often requiring advanced systems used mainly by banks and major financial institutions.
If data from a calm and low-volatility year is used to calculate Value at Risk (VaR), the estimated VaR value will be lower than the actual level of risk, leading to an underestimation of real market exposure.
Difference Between Value at Risk (VaR) and Other Risk Management Tools
Value at Risk (VaR) is one of the most widely used indicators in risk management, but its method and objective differ from other risk assessment tools. Below, we review the differences between VaR and several other important tools.
Difference Between Value at Risk (VaR) and Standard Deviation
Value at Risk (VaR) estimates the maximum potential loss over a specific time horizon and at a given confidence level, while standard deviation only measures the dispersion of returns around the mean and is not sensitive to the direction of movement (profit or loss).
In simple terms, VaR answers the question “In the worst case, how much could we lose?”, while standard deviation only tells us “How volatile are the returns?”
Difference Between Value at Risk (VaR) and Beta
Value at Risk (VaR) expresses absolute risk in numerical terms (monetary or percentage), whereas Beta measures the relative risk of an asset compared to the overall market.
VaR focuses on measuring the maximum potential loss, while Beta focuses on the correlation of an asset’s movements with the market index and shows how much more or less volatile an asset is compared to the market.
Difference Between Value at Risk (VaR) and Stress Testing
Value at Risk (VaR) is usually calculated based on historical data or statistical modeling and reflects normal market conditions. In contrast, stress testing simulates extreme and abnormal scenarios such as market crashes or liquidity crises.
In other words, VaR shows the range of losses under typical conditions, while stress testing reveals the impact of crisis scenarios.
Difference Between Value at Risk (VaR) and CVaR (Loss Beyond the VaR Confidence Level)
Value at Risk (VaR) only reports losses up to a specific threshold at the defined confidence level, but CVaR goes further and calculates the average loss that occurs in scenarios worse than that threshold.
In practice, if VaR says “In 95 percent of cases, you will not lose more than X dollars,” CVaR specifies “In the worst 5 percent of cases, what the average loss will be.”
Safer investments such as U.S. stocks rarely exceed VaR, but in unstable assets such as emerging markets, cryptocurrencies, or small market capitalization stocks, higher CVaR levels are observed.
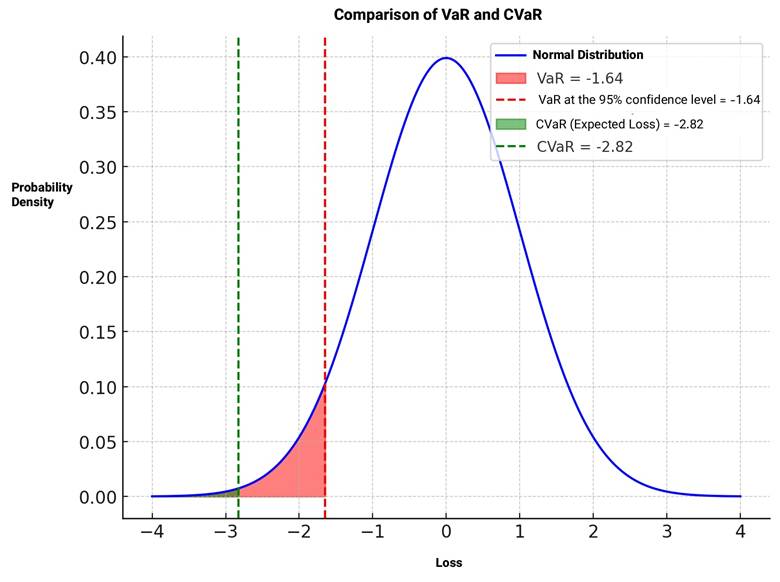
In the chart above:
- VaR is marked as the cutoff point at the 95% confidence level, and losses that exceed this amount are shown in the red area.
- CVaR (the average loss in the worst-case scenarios) represents the average losses that occur beyond the VaR threshold and is shown in the green area.
- This chart clearly illustrates how CVaR calculates the average losses that are more severe than VaR.
| Feature | Value at Risk (VaR) | Standard Deviation | Beta | Stress Testing |
|---|---|---|---|---|
| Definition | Maximum potential loss at a given confidence level and time horizon | Dispersion of returns around the mean | Relative risk of an asset compared to the market | Simulating extreme and abnormal market scenarios |
| Unit | Currency (Toman, Dollar) or Percentage | Percentage | Relative | Usually numeric |
| Type of Risk | Absolute (Monetary or Percentage) | Relative | Relative | Crisis and abnormal |
| Market Conditions | Normal | Normal | Normal | Crisis and abnormal |
According to Investor's wiki, although a small CVaR is an ideal indicator for investment, high-growth investments often have large CVaR values.
Conclusion
Value at Risk (VaR) is a powerful tool for quantifying and controlling risk in financial markets. Despite its specific limitations, it continues to be used as a reference indicator in capital management, regulatory compliance, and the design of trading strategies.


