


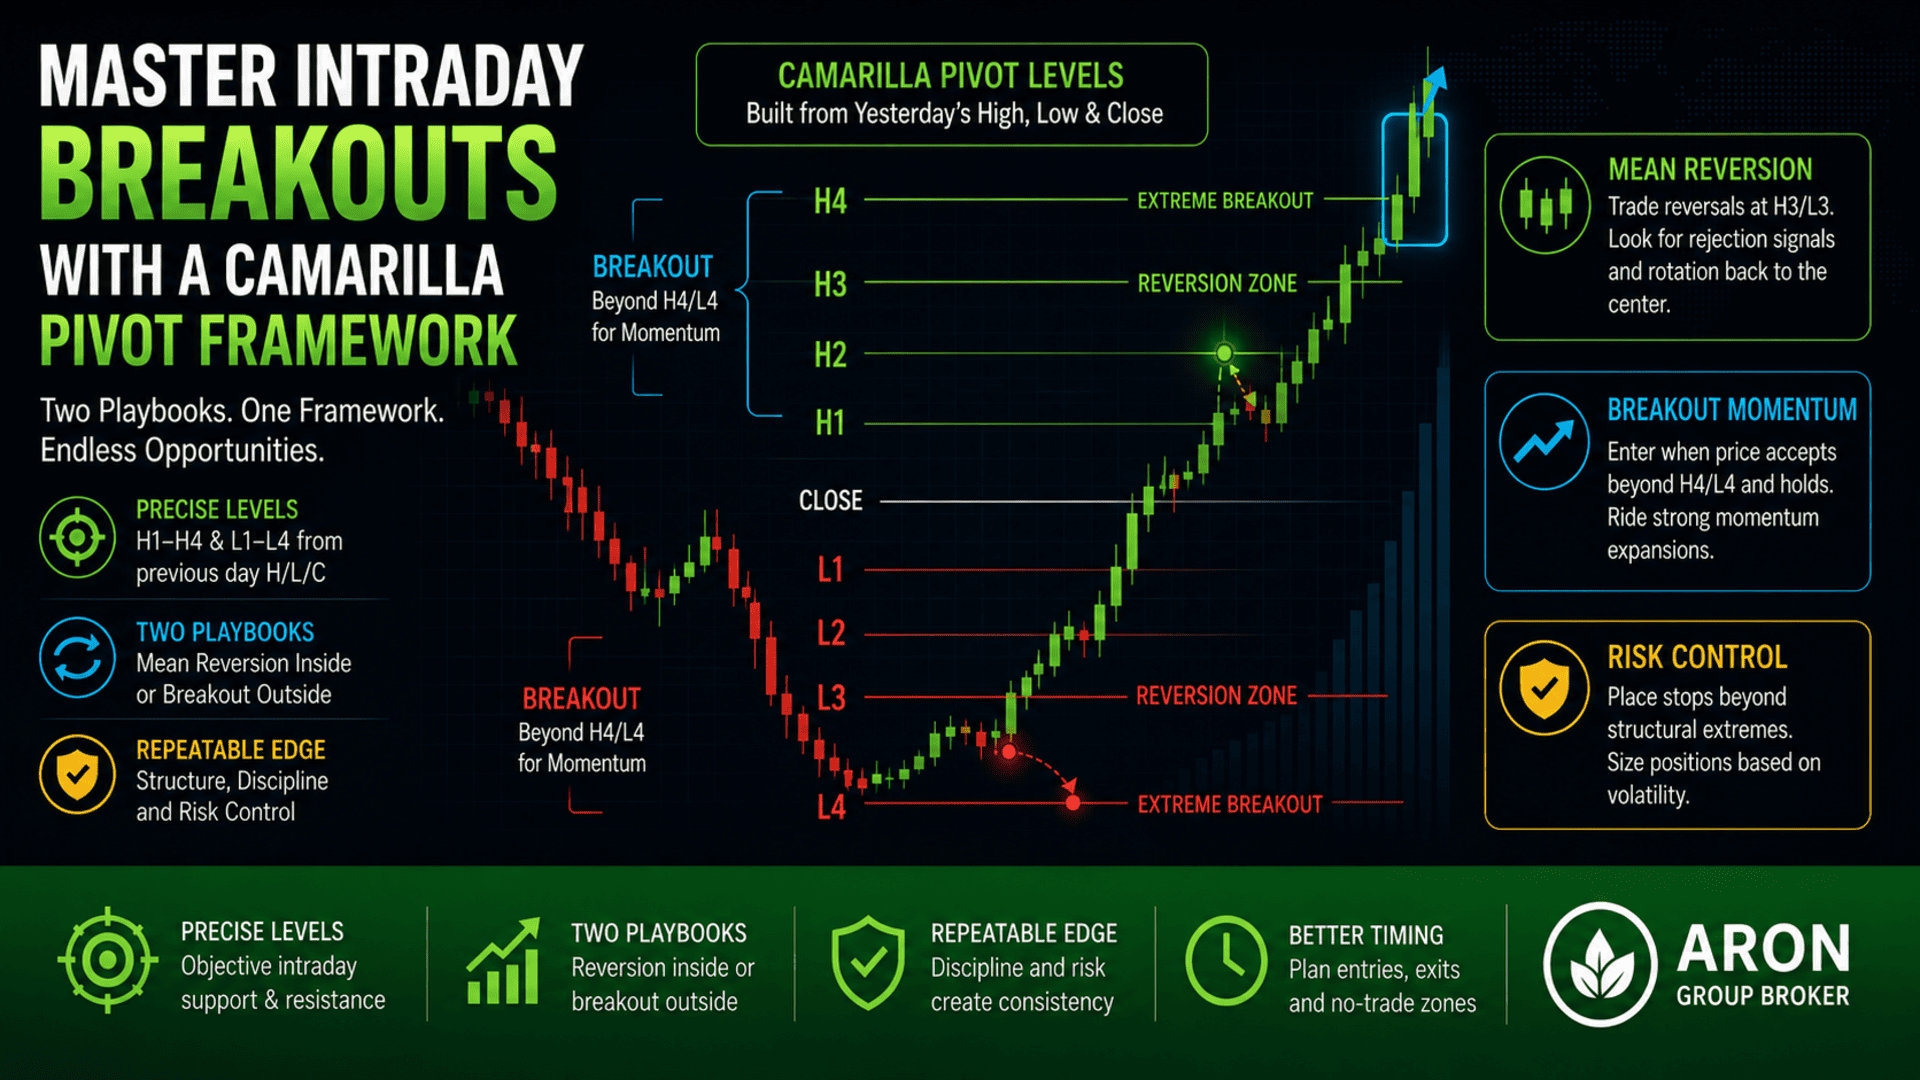


The Camarilla pivot trading strategy is an intraday framework that uses the previous day’s high, low, and close to plot precise support and resistance bands (H1–H4 and L1–L4). Traders then use those bands for two clear playbooks: mean reversion around the inner levels, or momentum breakouts beyond the outer levels. The real question is: are you using the levels to follow a repeatable plan, or are you treating them like magic lines and reacting to every touch?

- Camarilla pivots are math-based intraday support and resistance levels built from the previous day’s H/L/C, designed for short-term decision-making.
- The core structure is four levels above the close (H1–H4) and four below (L1–L4), with H3/L3 often treated as reversion zones and H4/L4 as breakout extremes.
- Compared with classic pivot points, Camarilla emphasises tighter, more actionable bands around the close, and is often used for both reversion and breakout logic.
- Wider spacing between levels typically reflects range expansion (more volatility), while tighter spacing suggests range contraction (more compression).
- The cleanest breakout trades happen when price accepts beyond H4/L4, not when it briefly spikes through and snaps back.

Important note: Pivot levels are reference points. Your risk control (stop placement and sizing) is what makes the strategy survivable.
Key Concepts Behind the Camarilla Pivot Trading Strategy
Camarilla pivots are built for intraday structure. They give you a daily map of where price is likely to react so that you can plan entries, exits, and no-trade zones with less emotion.
Origins of Camarilla Pivot Points from Floor Trader Techniques
According to Invesopedia, Camarilla pivots are a variation of pivot-point methods that evolved from practical floor trader ideas: take the previous session’s prices, generate objective levels, and trade reactions at those levels.
They’re widely attributed to a late-1980s development and are often described as being designed for intraday precision rather than long-horizon investing.
How Camarilla Differs from Standard and Fibonacci Pivots
Classic pivot points usually start with a central pivot (often based on the previous period’s H/L/C average) and then derive support/resistance levels from that pivot.
PivotBoss explains that Camarilla pivots, by contrast, produce a set of tighter bands around the close and are commonly used with a reversion-inside/breakout-outside mindset, with a focus on the upper/lower outer bands.
Fibonacci pivot variations apply Fibonacci retracement ratios to the prior range, which is a different design logic than Camarilla’s fixed multipliers.
H3: Using Intraday Support and Resistance for Precision Trading
Pivot strategies are popular because they translate the abstract idea of support/resistance into mathematically derived levels, which helps with objective planning.
In Camarilla terms, the most practical use is:
- treat the levels as zones for decision, not as guaranteed turning points
- only act when price behaviour confirms (rejection for reversion, acceptance for breakout)
Calculating Camarilla Pivot Levels Accurately
You can calculate Camarilla levels by hand, but most traders rely on platform indicators. Either way, you should understand the inputs so you can sanity-check levels and avoid wrong-session data.
Applying Previous Day High, Low and Close in the Camarilla Formula
Camarilla pivots are derived from the previous day’s High (H), Low (L), and Close (C), using the prior day’s range = (H − L).
A commonly used set of Camarilla equations is:
| Level | Formula (Range = H − L) |
|---|---|
| H1 | C + Range × (1.1/12) |
| H2 | C + Range × (1.1/6 |
| H3 | C + Range × (1.1/4) |
| H4 | C + Range × (1.1/2) |
| L1 | C − Range × (1.1/12) |
| L2 | C − Range × (1.1/6) |
| L3 | C − Range × (1.1/4) |
| L4 | C − Range × (1.1/2) |
Remember: Make sure your previous day matches the session your market uses (especially in FX/CFDs). Different feeds can shift H/L/C.
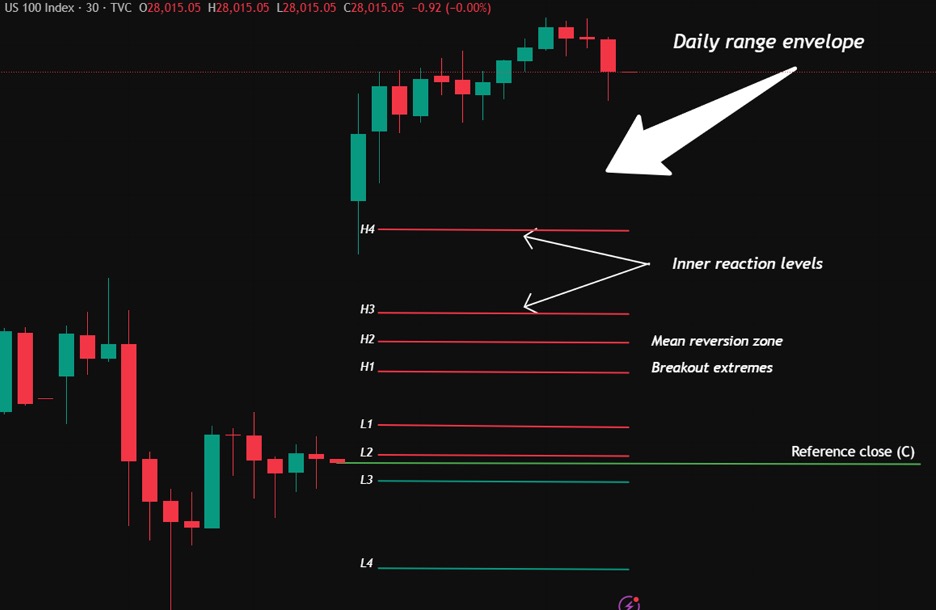
Understanding H1–H4 and L1–L4 Level Structures
The practical interpretation most traders use is:
- Inner levels (H1–H2 / L1–L2): minor intraday reaction zones
- Mid levels (H3 / L3): frequently treated as mean-reversion boundaries
- Outer levels (H4 / L4): treated as structural extremes where breakouts can accelerate if price accepts beyond them
This H3/L3 for reversion, H4/L4 for breakout mapping, is a common, explicit teaching pattern.
What Range Expansion and Contraction Signals for the Session
Because Camarilla levels scale with the prior day’s range, the spacing between H4 and L4 gives you a quick volatility clue:
- Wide spacing: prior day had a large range, then expect more movement potential (range expansion)
- Tight spacing: prior day had a small range, then expect more compression and chop risk (range contraction)
That doesn’t predict direction. It helps you choose tactics: reversion setups tend to be cleaner in compression, while true momentum breakouts are easier to justify when the market can actually travel.
Executing Momentum Breakouts with Camarilla Pivots
Breakout trading with Camarilla is not price touched H4, go long. It’s about whether price accepts beyond the extreme and holds enough to signal a genuine momentum move.
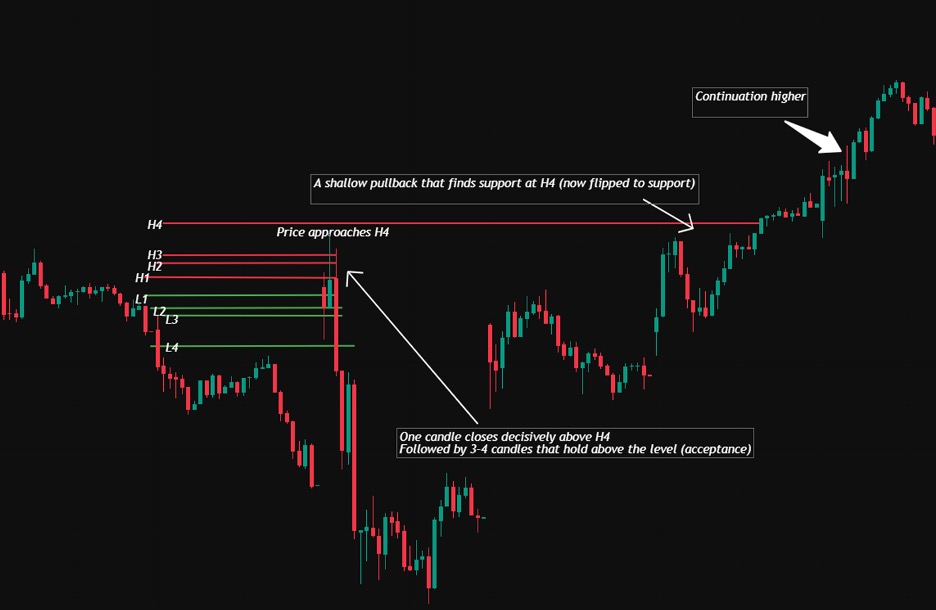
Identifying Valid Momentum Breakouts Beyond H4 and L4
A simple breakout definition:
- Bullish breakout: price moves above H4 and shows acceptance (not an instant snap-back).
- Bearish breakout: price moves below L4 and shows acceptance.
Many traders treat H4/L4 as with-trend trigger zones when breached, while treating H3/L3 as the against-trend reversion zones.
Practical entry discipline (to reduce chase):
- wait for a close beyond H4/L4 or a retest that holds
- avoid entering on the first spike through the level (that’s where traps live)
Confirming Breakouts Using Volatility and Market Structure
Pivot levels alone are not enough. Confirmation helps reduce false breakouts.
Useful confirmation cues:
- Volatility expansion: candles widen, and follow-through appears (not one isolated wick)
- Structure shift: the market stops rejecting the level and starts building above/below it
- Intraday momentum: pullbacks become shallow and are quickly bought/sold
Pivots are commonly used alongside other tools for better reliability, rather than as a standalone trigger.
Managing False Breakouts and Liquidity Sweeps
False breakouts are common near obvious levels. A typical trap looks like:
- a quick push beyond H4/L4
- immediate rejection back inside
- continuation in the opposite direction
If that happens, treat it as information:
- don’t average in
- tighten risk rules
- Consider switching to mean reversion logic only if the market shows stable rotation inside the bands
Pivot points are objective levels, but price can still overshoot them, so risk management and confirmation are essential.
Trading Mean Reversion at Camarilla Pivot Levels
As reported by Investopedia, Mean reversion is the inside-the-bands playbook. Instead of betting on a trend day, you assume price will rotate back toward the centre of the session range—but only when rejection is clear and the market is not in strong momentum mode. Mean reversion is commonly discussed as a strategy that looks for prices to revert back toward an average after extended moves.
Using H3 and L3 as Mean Reversion Trading Zones
A common Camarilla interpretation is:
- H3 / L3 act like a mean-reversion boundary
- H4 / L4 represent more extreme zones where breakouts can accelerate if acceptance holds
This reversion at H3/L3, breakout beyond H4/L4 framing is widely used by Camarilla traders.
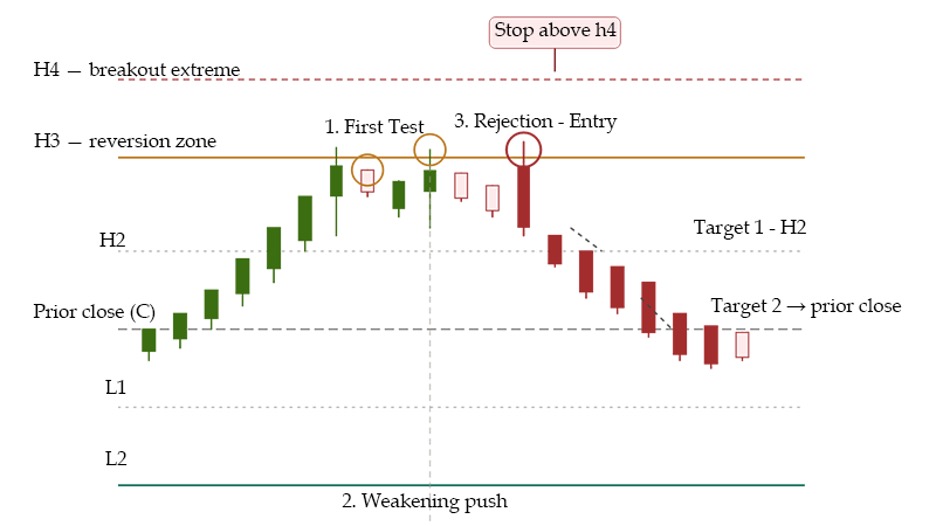
A practical mean reversion approach:
- If price reaches H3, you look for bearish rejection (failure to hold above) and rotate lower.
- If the price reaches L3, you look for bullish rejection and rotate higher.
- If price is slicing through H3/L3 without reacting, treat it as a warning that conditions are trending rather than reverting.
Tip: Don’t assume reversion just because H3/L3 is touched. Wait for rejection.
Spotting Exhaustion from Responsive Traders for Reversal Entries
Responsive traders are a useful idea: instead of initiating breakouts, they respond when price gets extended into a level and starts to stall.
What exhaustion often looks like near H3/L3:
- The push into the level loses speed (smaller candles).
- Wicks appear and close, failing to hold beyond the level.
- Multiple attempts to push further fail.
These are price-action signals that momentum is fading. Momentum oscillators can also help, but your core confirmation should be the market failing to sustain progress beyond the level.
Remember: In mean reversion, the level is not the entry. The failure to continue is the entry.
Setting Targets Within Intraday Support and Resistance Bands
Mean reversion targets should be realistic and inside the map.
Practical target hierarchy:
- First target: the next inner level (e.g., H2/L2)
- Second target: the session’s centre / fairer area (often around the prior close or central pivot logic, depending on your chart tool)
- Final target (optional): the opposite band only if rotation is clean and conditions are stable
This keeps targets aligned with intraday support and resistance rather than hoping for a full reversal. Pivot points are used specifically to map intraday levels, which is why they work well for this style.
Risk and Position Management in Camarilla Pivot Trades
Camarilla levels are precise. Your risk needs to be precise, too. Most losses in pivot trading come from one of two errors: stopping too tight in noisy conditions, or staying too large when volatility expands.
Placing Stops Beyond Camarilla Structural Extremes
Stop placement should reflect the logic of the playbook you’re using.
For mean reversion at H3/L3
- A common approach is to place stops beyond the more extreme boundary (often beyond H4 for shorts, or beyond L4 for longs), because a sustained move through H4/L4 can signal regime change toward breakout behaviour.
For breakout trades beyond H4/L4
- Stops often sit back inside the level that should hold if the breakout is real (e.g., failed acceptance back inside H4/L4 is your invalidation).
Don’t forget: Your stop must match your scenario. If you use a breakout stop on a mean reversion idea, you will get chopped out.
Position Sizing Based on Intraday Volatility
Volatility should control your size, not your confidence.
A practical way to think about it:
- Wider intraday ranges, then wider stop distances, then smaller size
- Narrow intraday ranges, then tighter stops possible, then slightly larger size (still controlled)
Position sizing is a core risk concept: you choose the number of units so that a stop-out is a predefined loss, not a surprise.
A simple rule:
- If you must double your risk to keep the trade alive, skip the trade.
Adjusting Exposure in Trending vs Range-Bound Markets
This is where many traders misuse Camarilla.
- In range-bound markets, mean reversion around H3/L3 can be productive.
- In trending markets, repeated reversion attempts often fail, and you should shift to a breakout/continuation mindset or trade smaller.
Practical regime cues:
- If price holds beyond H4/L4 with follow-through, reduce mean reversion attempts.
- If price rotates neatly between bands and rejects extremes, reversion logic becomes more reasonable.
Mean reversion is not a belief system. It is a conditional tactic.
Integrating Camarilla Pivot Strategy into a Complete Trading Plan
Camarilla works best as a daily routine. You map levels, define your scenario (reversion or breakout), then execute only when price behaviour confirms.
Aligning Trades with Broader Market Structure
Pivot levels are intraday. Market structure is the bigger story.
Before taking trades, ask:
- Is the market trending or rotating?
- Are we near a major swing high/low from a higher timeframe?
- Is today likely to be a trend day (strong momentum) or a range day (rotation)?
Using pivot points alongside broader structure is a common approach to improve reliability, rather than treating pivots as standalone signals.
Using Volume, Momentum, and Floor Trader Pivots to Filter Signals
Pivot levels give you where. Filters give you whether.
Useful filters:
- Momentum: Does price accelerate through a level or stall?
- Volume (if available): Does volume expand on the move, or fade?
- False breakout behaviour: Does price spike and reverse, or accept and hold?
These filters help you avoid trading every touch and instead trade the touches that actually matter.
Building a Repeatable Daily Breakout and Reversion Routine
A daily routine makes Camarilla more objective.
A simple checklist:
- Mark Camarilla levels from the prior day’s H/L/C.
- Decide your primary scenario:
- Reversion if the market is rotating
- breakout if the market is building pressure toward H4/L4
- Define:
- entry trigger
- stop location
- first and second targets
- Trade only the cleanest setups and stop after a defined number of losses.
This is how you avoid pivot overtrading.
Conclusion
The Camarilla pivot trading strategy gives you a clean intraday framework: H1–H4 and L1–L4 levels derived from the previous day’s range and close. Use H3/L3 as conditional mean-reversion zones when price shows exhaustion, and treat H4/L4 as structural extremes where breakout acceptance can shift the session into momentum mode. Keep stops logical, size by volatility, and run a repeatable daily plan. When you do that, pivots stop being lines on a chart and become a decision system.


