Intermarket Analysis is one of the most powerful yet underused tools in Forex trading. Many traders focus only on price charts, indicators like RSI or MACD, and entry signals. However, currencies do not move in isolation. They are deeply connected to other financial markets such as bonds, equities, and commodities.
For example, a rise in US bond yields can strengthen the dollar, or a stock market crash can push traders toward safe-haven currencies like the Japanese yen.
In this article, you will learn how Cross Asset Analysis works in real trading conditions. You will also see practical examples of Forex Bonds Correlation, DXY Forex Correlation, and the Equity Forex Relationship. This will help you read the market more deeply and improve your trade timing.
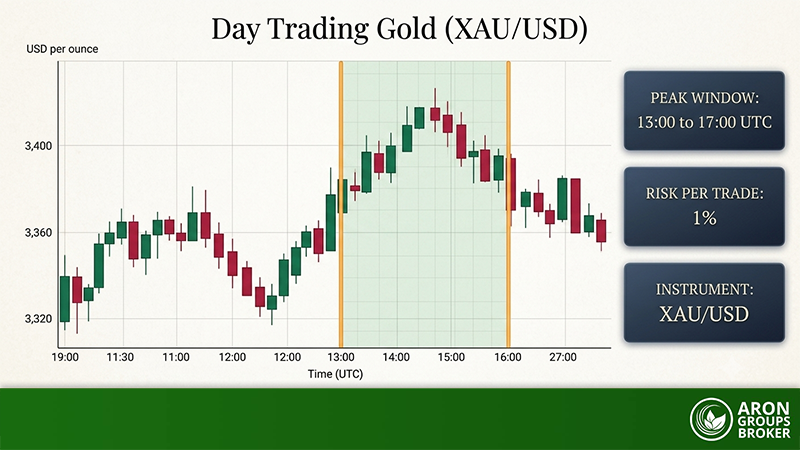
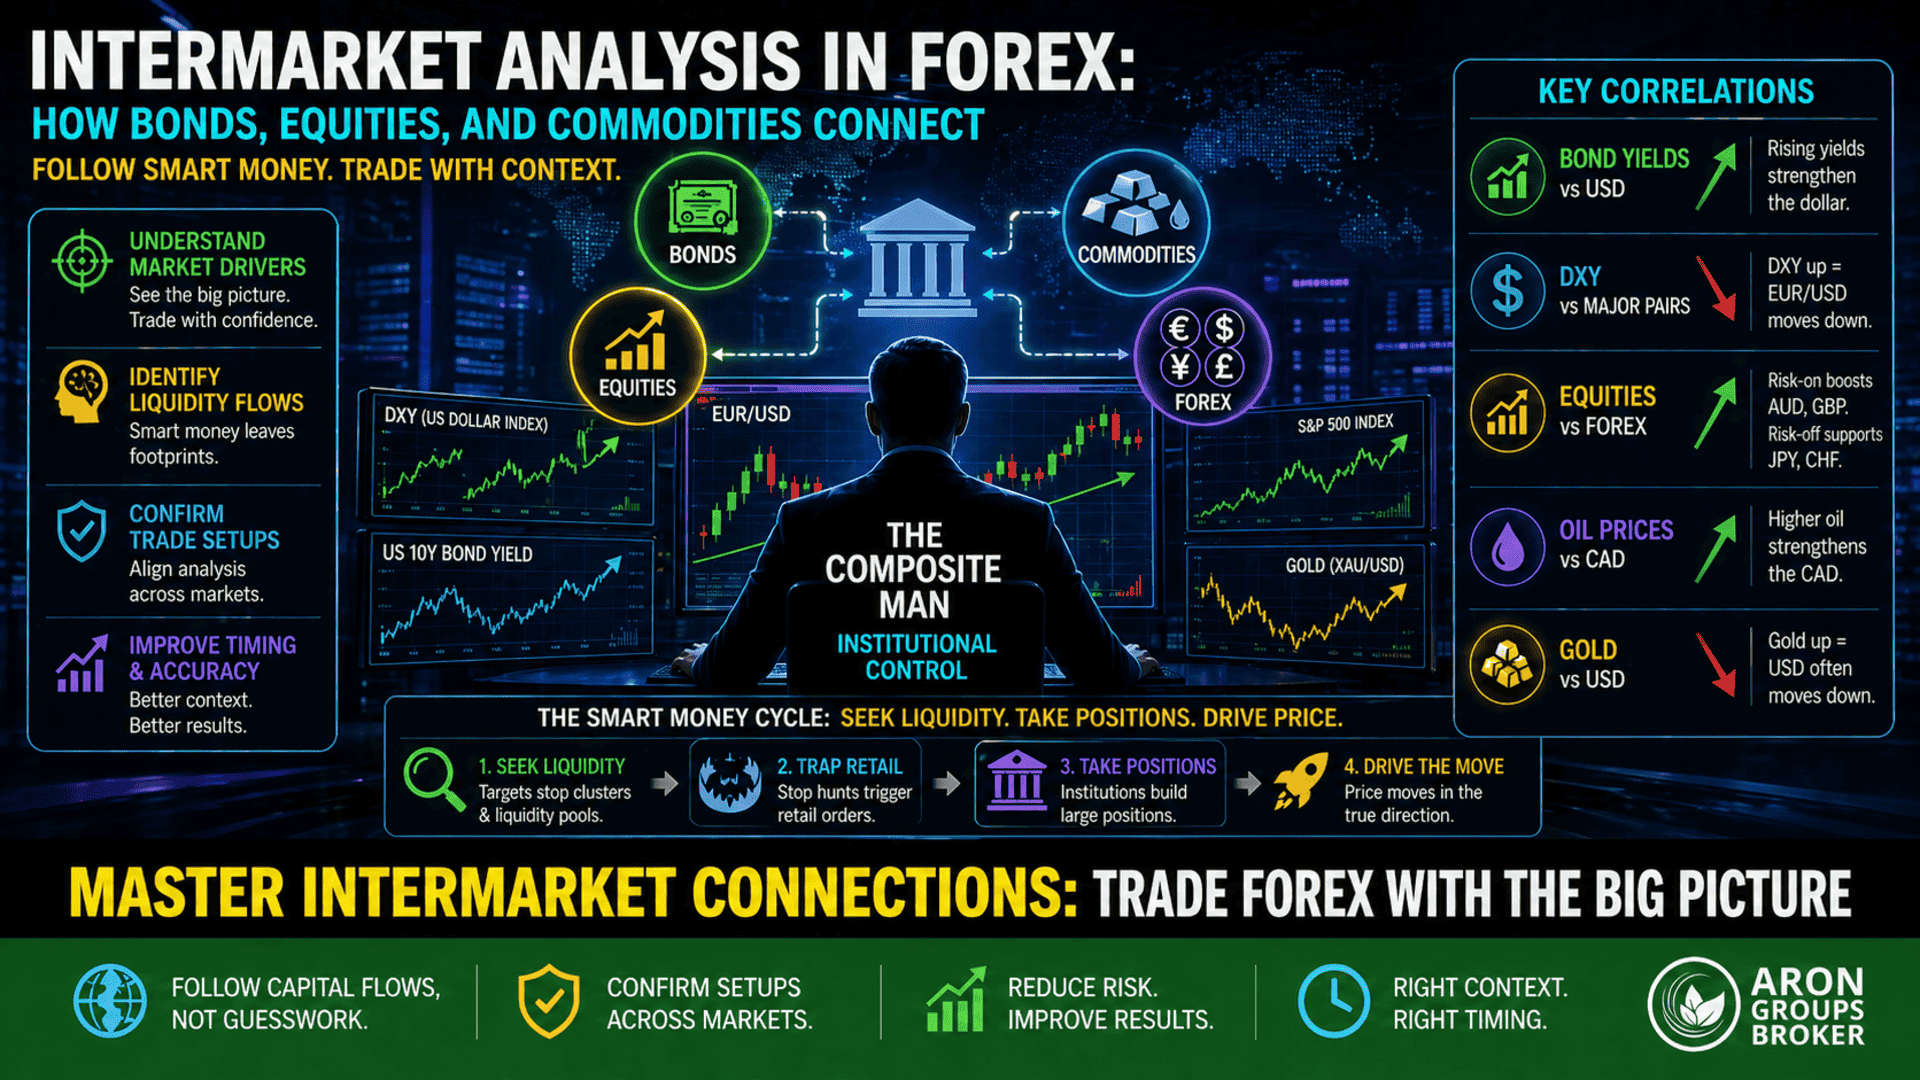
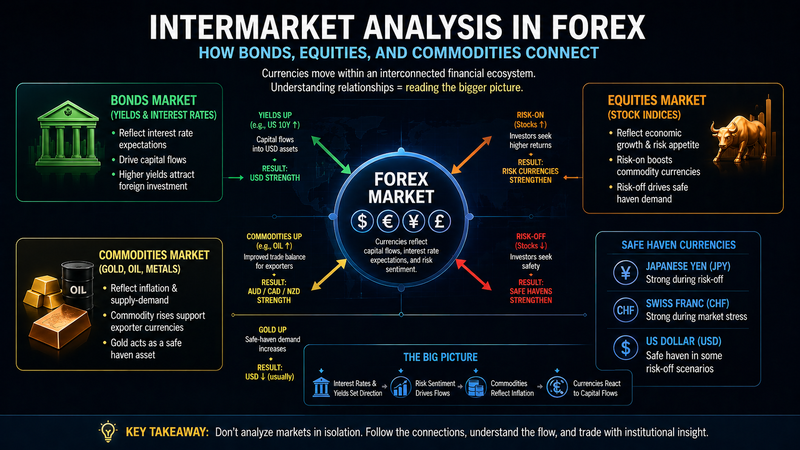
- Intermarket Analysis provides a structural edge by linking Forex movements to bonds, equities, and commodities rather than relying only on technical indicators.
- Forex Bonds Correlation is a primary driver: rising yields—especially in the US—typically strengthen the currency through capital inflows.
- DXY Forex Correlation helps track overall USD strength, and its breakouts often lead major currency pair movements, such as EUR/USD and GBP/USD.
- Equity Forex Relationship reflects market sentiment, where risk-on environments support currencies like AUD and GBP, while risk-off flows strengthen JPY and CHF.
- Cross-asset analysis improves trade accuracy, but only when correlations are used with macro context, not as fixed rules.
What Is Intermarket Analysis and Why It Matters in Forex Trading
According to the forexgeek, intermarket Analysis is the process of analysing how different financial markets—Forex, bonds, equities, and commodities—interact and influence each other. In practice, currencies do not move independently. They respond to capital flows, interest rate expectations, and global risk sentiment. Understanding these Intermarket Relationships allows traders to move beyond isolated chart patterns and interpret the underlying drivers of price action. This creates a structural edge, especially in volatile or news-driven environments.
Understanding Intermarket Relationships Across Asset Classes
Intermarket Relationships are built on cause-and-effect dynamics between asset classes. Each market reflects a different part of the global financial system:
- Bonds reflect interest rate expectations
- Equities reflect growth and risk appetite
- Commodities reflect inflation and supply-demand conditions
- Forex reflects capital flows between economies
For example:
If US bond yields rise while equity markets remain stable, this signals capital inflow into USD-denominated assets. As a result, the USD strengthens, and pairs like EUR/USD tend to decline.
Q: Can Forex move without other markets?
A: Forex can move independently in the short term due to technical factors, liquidity shifts, or isolated news events, but over the long term, currency trends are almost always driven and sustained by broader intermarket forces such as bond yields, equity sentiment, and macroeconomic capital flows.
Before entering any trade, ask: “Which asset class is driving this move?” If you cannot answer, your setup is incomplete.
How Cross Asset Analysis Improves Trading Decisions
Cross Asset Analysis enhances trade quality by aligning signals across multiple markets. Instead of relying solely on indicators, you validate your idea through macro confirmation.
A simple workflow:
- Identify a Forex setup (e.g., breakout or reversal)
- Check bond yields (direction of interest rates)
- Check equity markets (risk-on or risk-off)
- Check commodities (inflation or safe-haven demand)
Example Trade Setup:
- EUR/USD breaks below 1.0800
- US yields increase by 0.25%
- S&P 500 declines 1.8%
- Gold rises
This alignment confirms USD strength.
Q: What if signals are mixed?
A: Avoid the trade. Lack of alignment increases failure probability.
Alignment across assets increases the probability more than any single indicator.
The Bond Market’s Influence on Forex: Understanding Forex Bonds Correlation
According to forexopher, correlation is statistical relationsip between different assets.
Forex Bonds Correlation explains how changes in bond yields influence currency strength. When yields rise, currencies tend to appreciate as global investors seek higher returns. Ignoring this relationship leads to incomplete analysis and misinterpretation of market moves.
Interest Rates, Yields, and Currency Strength
Bond yields are directly linked to interest rates. When central banks tighten monetary policy, yields increase, making that currency more attractive.
Mechanism:
- Higher interest rates → higher bond yields
- Higher yields → more foreign capital inflow
- Increased demand → stronger currency
The spread between two countries’ yields is often more important than the yield itself.
How Bond Market Movements Signal Forex Trends
Bond markets often act as leading indicators for the Forex market. Institutional capital reacts to yield changes more quickly than retail traders, making bond movements an early signal of currency trends.
Key metrics to monitor:
- US 2Y and 10Y yields
- Yield spreads (e.g., US–EU, US–Japan)
- Yield curve structure (steepening or inversion)
Q: Do bond signals always work?
A: No. During major news releases (e.g., CPI, central bank meetings), correlations may temporarily break.
Watch yield breakouts on higher timeframes (daily/weekly). These often trigger sustained Forex trends, not just short-term moves.
DXY and Forex Correlation: How the US Dollar Index Drives Currency Markets
The US Dollar Index (DXY) is one of the most critical tools in Intermarket Analysis. It measures the strength of the US dollar against a basket of major currencies, including EUR, JPY, and GBP. Because USD is the base or quote currency in most Forex pairs, DXY Forex Correlation provides a direct view of overall dollar strength.
Understanding this relationship helps traders anticipate moves in pairs such as EUR/USD, GBP/USD, and USD/JPY with greater precision.
Interpreting DXY Forex Correlation in Real Time
DXY and Forex pairs typically move in opposite directions when USD is the quote currency. This is a structural relationship, not a coincidence.
Core Rule:
- DXY ↑ → USD strengthens → EUR/USD ↓
- DXY ↓ → USD weakens → EUR/USD ↑
However, real-time interpretation requires context. Traders must assess whether DXY movement is driven by:
- Rising bond yields
- Risk sentiment shifts
- Macroeconomic news (e.g., CPI, Fed decisions)
Q: Can DXY and EUR/USD move in the same direction?
A: Yes, but rarely. It happens when EUR-specific fundamentals dominate.
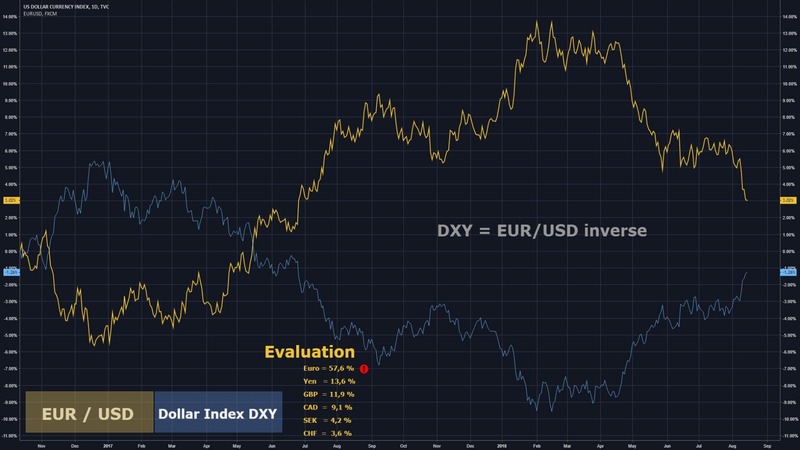
Mark key support/resistance levels on DXY. Breakouts often precede strong Forex trends by several hours or even days.
Practical Examples of USD Strengths and Weaknesses
Understanding DXY Forex Correlation becomes more powerful when applied to real scenarios.
Scenario 1: USD Strength (Bearish EUR/USD)
- DXY breaks above resistance at 103.50
- US yields increase by 0.2%
- EUR/USD drops from 1.0950 to 1.0820
Scenario 2: USD Weakness (Bullish EUR/USD)
- DXY falls below 101.00
- US yields decline
- EUR/USD rises from 1.0700 to 1.0900
Scenario 3: Mixed Signal
DXY flat, but EUR/USD drops
→ Likely EUR weakness, not USD strength
Combine DXY with bond yields. If both move in the same direction, the Forex signal becomes significantly stronger.
Equity Markets and Forex: The Equity Forex Relationship Explained
Equity markets play a crucial role in shaping Forex trends through global risk sentiment. The Equity Forex Relationship describes how investors allocate capital during periods of optimism (risk-on) or uncertainty (risk-off). When stock markets rise, traders seek higher returns and move into riskier currencies. When markets fall, capital flows into safe-haven currencies. This dynamic is essential for understanding intraday and swing-level currency movements.
Risk-On vs Risk-Off Sentiment and Currency Flows
The concept of risk sentiment is central to Cross Asset Analysis.
Risk-On Environment:
- Stock markets rise (e.g., S&P 500 +2%)
- Investors seek yield and growth
- Risk currencies strengthen (AUD, NZD, GBP)
- Safe havens weaken (JPY, CHF, USD in some cases)
Risk-Off Environment:
- Stock markets fall sharply
- Investors reduce exposure to risk
- Capital flows into safe havens
Always check equity indices before entering trades. A strong trend in equities often dictates the direction of Forex
Stock Market Crashes and Safe Haven Currencies
During major equity sell-offs, the Forex market shifts rapidly toward safe-haven currencies. This is one of the most reliable Intermarket Relationships.
Safe-Haven Assets:
- Japanese Yen (JPY)
- Swiss Franc (CHF)
- US Dollar (USD, depending on context)
- Gold (commodity confirmation)
Q: Is USD always a safe haven?
A: Not always. During US-specific crises, USD can weaken despite global risk-off.
In sharp equity declines, avoid trend-following strategies. Instead, focus on momentum and volatility-based setups in safe-haven pairs.
Commodities and Currencies: The Role of Gold, Oil, and Metals
Commodities are a critical component of Intermarket Analysis because they directly reflect inflation expectations, global demand, and geopolitical risk. Currencies—especially those tied to resource exports—respond quickly to commodity price movements. Understanding this connection allows traders to anticipate Forex trends through Cross Asset Analysis rather than reacting solely to price. Gold, oil, and industrial metals each influence currencies differently, but all play a measurable role in shaping market direction.
Gold and USD Inverse Correlation in Forex
Gold and the US dollar typically have an inverse relationship. When the USD strengthens, gold tends to fall, and when the USD weakens, gold often rises. This is primarily because gold is priced in USD globally.
Core Logic:
- USD ↑ → Gold becomes more expensive → demand falls → Gold ↓
- USD ↓ → Gold becomes cheaper → demand rises → Gold ↑
However, this relationship can break during extreme risk events.
Q: When does gold rise with USD?
A: During severe market stress, both can rise as safe-haven assets.
If gold and USD rise together, it signals deep risk-off sentiment. Avoid normal trend assumptions in such conditions.
Oil Prices and Commodity-Linked Currencies (CAD, AUD)
Oil and industrial commodities have a strong impact on currencies tied to exports, especially the Canadian dollar (CAD) and Australian dollar (AUD).
Mechanism:
- Oil prices ↑ → Canada earns more export revenue → CAD strengthens
- Commodity demand ↑ → Australia benefits → AUD strengthens
Example (Oil & CAD):
- Oil rises from $70 to $85 (+21%)
- USD/CAD falls from 1.3600 to 1.3200
Example (Commodities & AUD):
- Iron ore prices increase
- AUD/USD rises from 0.6500 to 0.6700
Q: Does oil always control CAD?
A: Not always. Interest rates and USD strength can override commodity effects.
Track oil (WTI) and copper alongside AUD and CAD pairs. Divergence between them often signals upcoming reversals in Forex.
Building a Practical Intermarket Analysis Framework for Traders
A structured Intermarket Analysis framework allows traders to move from random observations to repeatable decision-making. Instead of checking markets casually, you create a consistent process that integrates bonds, equities, commodities, and Forex into one analytical view. This approach reduces emotional trading and improves timing, especially in volatile conditions. The goal is not to analyse everything, but to focus on the key drivers that influence your specific currency pair.
Combining Bonds, Equities, and Commodities in One View
To apply Cross Asset Analysis effectively, you need to simplify the process into a repeatable checklist.
Step-by-step framework:
- Step 1: Identify Forex direction (trend, breakout, or range)
- Step 2: Check bond yields (e.g., US 10Y direction)
- Step 3: Analyse equity sentiment (risk-on vs risk-off)
- Step 4: Review commodities (gold, oil, metals)
Q: What if only one market confirms?
A: The setup is weak. Multi-asset confirmation is required for higher probability.
Focus on 2–3 key assets (e.g., DXY, US10Y, S&P 500) instead of tracking too many markets.
Using TradingView and MetaTrader for Cross-Asset Analysis
Modern trading platforms allow traders to integrate multiple markets into a single workflow. This is essential for real-time Intermarket Analysis.
On TradingView:
- Use multi-chart layout (e.g., EUR/USD, DXY, US10Y, S&P 500)
- Apply correlation analysis visually
- Set alerts on key levels across assets
On MetaTrader (MT4/MT5):
- Monitor the execution of Forex pairs
- Use custom indicators for USD strength or yield proxies
- Combine with external data (e.g., bond yields from economic calendars)
Create a fixed dashboard layout in your trading platform and do not change it frequently. Consistency improves pattern recognition.
Common Mistakes in Intermarket Analysis and How to Avoid Them
While Intermarket Analysis is powerful, many traders misuse it by oversimplifying relationships or ignoring context. Correlations are dynamic, not fixed. Markets evolve in response to macroeconomic conditions, central bank policies, and geopolitical events.
One of the biggest errors is assuming that correlations always hold. In reality, correlations change depending on macro conditions.
Another mistake is Ignoring Macroeconomic Events and News Catalysts. Macro events redefine market structure faster than technical or intermarket signals.
So, always check the economic calendar before trading. Avoid entering positions just before high-impact news.
Conclusion
Intermarket Analysis transforms Forex trading from a chart-based activity into a macro-driven decision process. By understanding how bonds, equities, and commodities interact with currencies, traders gain a deeper view of market structure and capital flows.
Instead of relying only on indicators, you learn to interpret why price moves and where they are likely to go next. Whether it is Forex Bonds Correlation, DXY Forex Correlation, or the Equity Forex Relationship, each component adds a layer of confirmation and clarity.
The key is consistency. Apply a structured framework, focus on a few critical assets, and always consider the macroeconomic context. Over time, this approach leads to better timing, fewer false signals, and more confident execution.