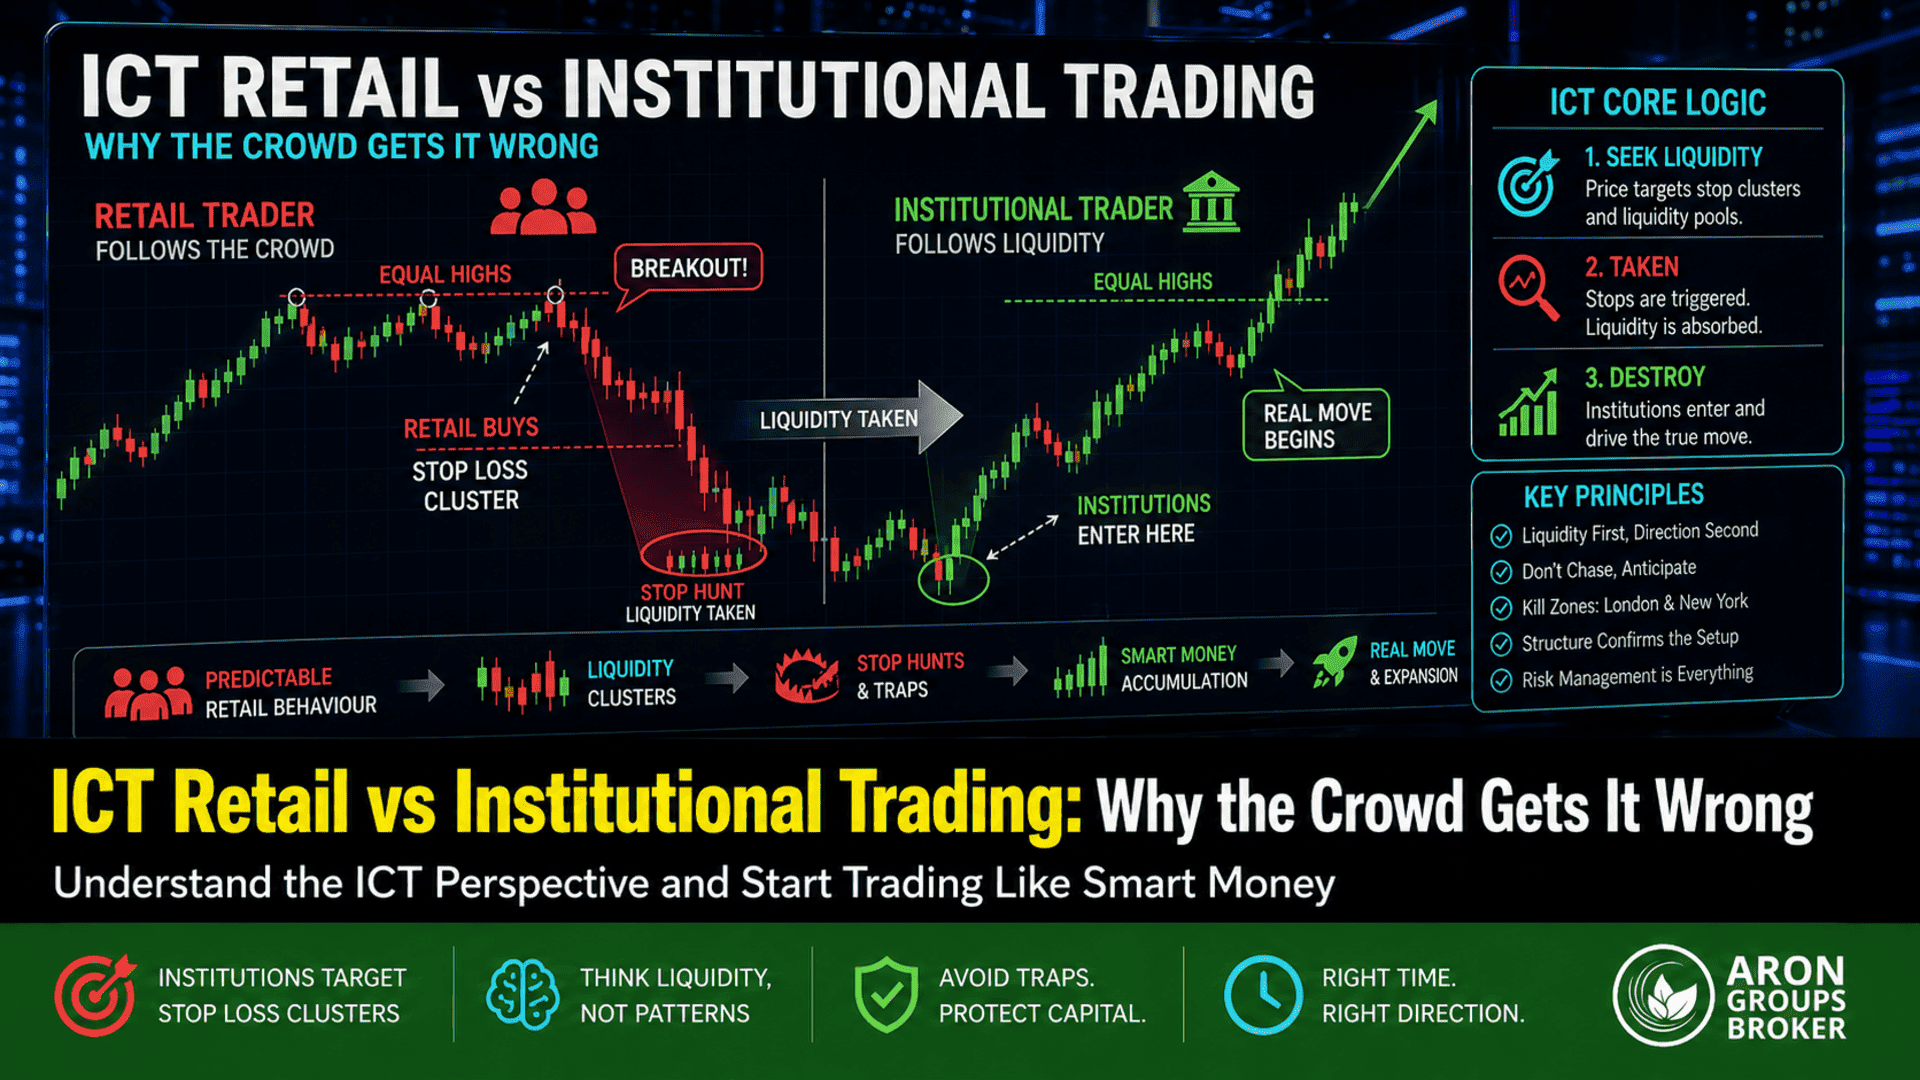


In financial markets, most traders believe they are competing against price. In reality, they are competing against institutions. The concept of ICT Retail vs Institutional Trading explains why the majority of retail traders consistently lose, while large players extract liquidity with precision.
Retail traders often rely on common tools such as support and resistance, trendlines, and breakout strategies. However, these methods are predictable. Institutions use this predictability to locate clusters of stop-loss orders and leverage them to fuel their positions.
From an ICT institutional perspective, price moves with intent, targeting liquidity pools where retail traders are most exposed. Understanding this shift—from reacting to price, to anticipating liquidity—is the key difference between losing and consistently profitable trading.

- In ICT Retail vs Institutional Trading, markets move toward liquidity pools, not random price direction
- Why Retail Traders Lose: They trade breakouts and indicators without understanding liquidity context
- In Smart Money vs Retail, institutions target stop-loss clusters created by predictable retail behaviour
- Retail Trader Mistakes ICT highlights that obvious levels (equal highs/lows) are liquidity targets, not strong support/resistance
- The ICT Institutional Perspective focuses on timing entries after liquidity sweeps, not during breakout moves
Understanding the Core Difference Between Retail and Institutional Trading
At its core, the difference between retail and institutional trading is not about tools—it is about intent and scale. Retail traders typically react to price movements, while institutions engineer those movements. This gap explains why many common strategies fail when applied without deeper context.
Who Are Retail Traders and How They Operate
Retail traders are individuals trading with personal capital through platforms like MetaTrader or TradingView. Their decisions are often based on visible patterns: support and resistance, trendlines, RSI divergences, or simple breakout setups.
A typical retail approach looks like this:
- Price breaks above resistance → buy
- Stop-loss placed just below the breakout level
For example, if EUR/USD breaks 1.1000, many retail traders enter long with stops at 1.0980. This creates a predictable liquidity cluster.
The issue is not the tools themselves. It is the lack of context. Retail traders focus on what the price is doing, not why it is doing it. This leads to repeated losses, especially in volatile conditions.
Q: Is retail trading always wrong?
A: No. The logic can be valid, but timing and context are often misaligned with how institutions operate.
How Institutional Traders Move the Market
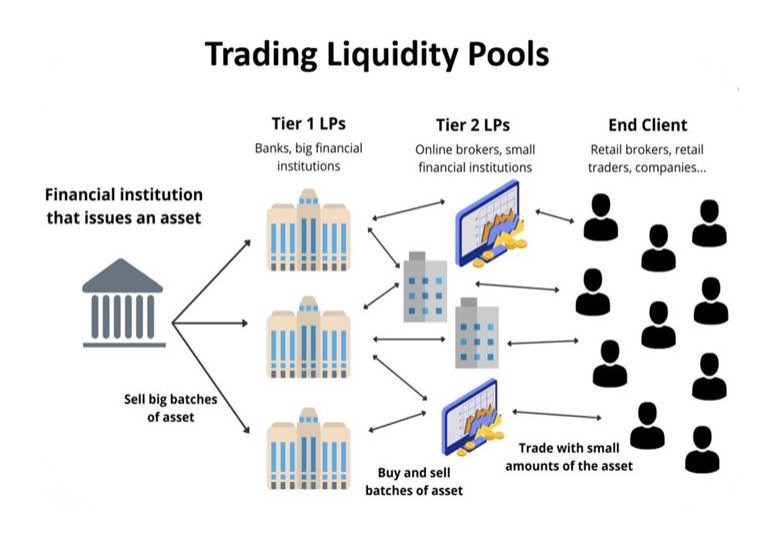
According to Skilling, Institutional traders are large entities such as banks, hedge funds, and financial institutions that trade significant capital and move markets by targeting liquidity and executing high-volume orders.
They cannot enter or exit positions instantly without affecting the price. Instead, they:
- Seek liquidity to fill large orders
- Move price toward areas with high stop concentration
- Use volatility to mask their true intentions
For instance, before pushing EUR/USD higher, institutions may first drive the price below 1.1000 to trigger retail stop-losses. This provides the liquidity needed to accumulate long positions.
This is why markets often show “false breakouts.” From an institutional perspective, these are not false—they are engineered moves designed to access liquidity.
ICT Institutional Perspective: How Smart Money Thinks
To understand ICT Retail vs Institutional Trading, you must shift from price-based thinking to liquidity-based thinking. Institutions do not chase trends. They build positions where liquidity is available, often against the prevailing market direction.
Liquidity as the Primary Objective
Liquidity is the fuel of the market. Every trade requires a counterparty. For institutions, this means one thing: they must find areas where many orders already exist.
These areas include:
- Equal highs and equal lows
- Previous day highs/lows
- Obvious support and resistance zones
Example:
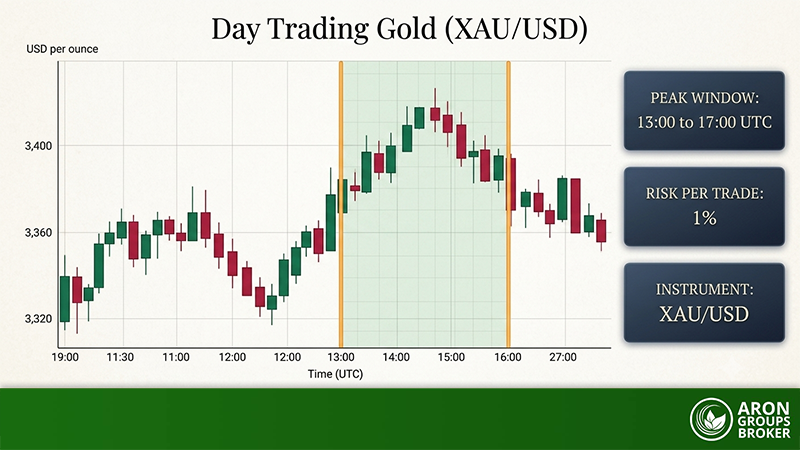
If gold (XAU/USD) forms equal highs at 5200, retail traders see resistance. Institutions see a pool of buy-stop orders above that level.
Price is then pushed above 5200:
- Retail breakout traders buy
- Short sellers get stopped out
Institutions use this liquidity to enter sell positions at a better price.
Q: Why does price reverse after a breakout?
A: Because the breakout itself was used to collect liquidity, not to start a trend.
Order Flow and Market Manipulation Explained
Order flow refers to the real-time interaction of buy and sell orders. According to the forexscalpers, Institutions influence this flow by creating imbalances.
This often appears as:
- Sudden spikes during low liquidity periods
- Sharp moves during news releases
- Fake directional bias before real moves
For example, during a major economic release, EUR/USD may spike upward quickly. Retail traders interpret this as bullish momentum. However, institutions may use this spike to distribute sell orders into aggressive buying pressure.
This is commonly referred to as “manipulation,” but in practice, it is simply how large orders are executed efficiently.
Why Retail Traders Lose: Structural Disadvantages
Retail traders do not lose because they lack intelligence. They lose because they operate within a structure designed around institutional execution. Without understanding this structure, even disciplined traders fall into predictable traps.
Lack of Information and Delayed Data Access
Institutions have access to deeper layers of market data, including:
- Interbank liquidity flows
- Large order positioning
- Faster execution infrastructure
Retail traders, in contrast, rely on:
- Broker price feeds
- Lagging indicators
- Publicly available news
This creates a timing disadvantage. By the time a retail trader reacts to a signal, institutions have often already positioned themselves.
Example:
A bullish RSI divergence appears on GBP/USD. Retail traders enter long. However, institutions may already be selling into that buying pressure, using it as exit liquidity.
The issue is not the indicator—it is the delay in interpretation relative to institutional positioning.
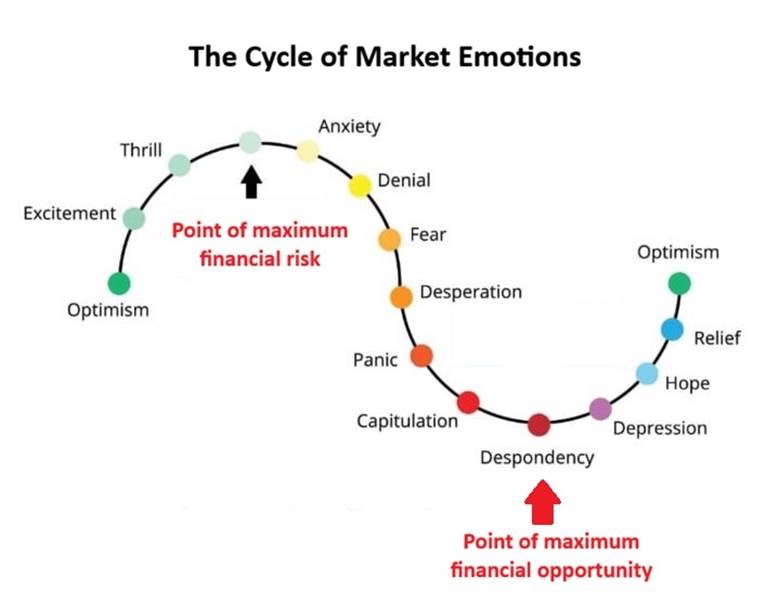
Emotional Decision-Making and Cognitive Biases
Beyond structural issues, psychology plays a critical role. Retail traders often:
- Chase price after strong moves
- Move stop-losses to avoid being wrong
- Overtrade after losses
Consider this scenario:
Price breaks resistance, moves 20 pips, then pulls back. A retail trader who entered late feels pressure and closes early. Moments later, the price reverses completely and hits the original stop zone.
This cycle repeats because decisions are driven by emotion rather than a structured understanding of liquidity.
Q: Can psychology alone fix trading performance?
A: No. Without a correct market model (like the ICT institutional perspective), psychological improvements have a limited impact.
Retail Trader Mistakes
Most retail trading errors are not random—they are patterned and repeatable. These mistakes stem from ignoring liquidity and focusing only on visible price action. Once you recognise these patterns, you start seeing why the same setups fail again and again.
Trading Breakouts Without Liquidity Context
Breakout trading is one of the most common retail strategies. The logic is simple: when the price breaks a key level, momentum should continue.
However, without a liquidity context, this logic becomes flawed.
Example:
- GBP/USD breaks above 1.2700 resistance
- Retail traders enter long
- Stops are placed below 1.2680
From an ICT perspective, this breakout creates liquidity:
- Buy orders from breakout traders
- Stop-loss orders from sellers
Institutions often reverse price after the breakout because they now have enough liquidity to take the opposite position.

Do not trade the breakout. Trade the reaction after liquidity is taken.
Misplacing Stop Losses in Obvious Zones
Retail traders tend to place stop-losses in predictable areas:
- Below support
- Above resistance
- Under equal lows or above equal highs
These locations are not “safe.” They are targets.
Example:
If BTC forms equal lows at $40,000, many traders place stops at $39,800. This creates a dense liquidity pool. Price is often driven into that zone before reversing upward.
A stop-loss is not just protection—it is liquidity for someone else. The more obvious the level, the higher the probability it gets swept
Smart Money vs Retail: The Role of Liquidity Pools
Liquidity pools are the foundation of ICT Retail vs Institutional Trading. They represent areas where large volumes of orders are concentrated. Institutions do not guess direction—they systematically target these pools.
Equal Highs and Lows as Targets
Equal highs and equal lows are among the clearest liquidity signals in the market.
Why? Because they attract predictable behaviour:
- Retail traders see resistance at equal highs → they sell
- Others place buy stops above those highs
This creates a layered liquidity pool.
For example, gold forms equal highs at 5200:
- Short sellers enter at 5200
- Buy stops accumulate at 5210–5215
Institutions push price above 5200:
- Shorts get stopped out
- Breakout buyers enter
Then the price reverses sharply.
Equal highs/lows are rarely strong barriers—they are magnets for price.
Stop Hunts and Liquidity Sweeps in Practice
Stop hunting is simply a targeted move into a liquidity pool. It is not random volatility.
Typical sequence:
- Price consolidates → builds equal highs/lows
- Liquidity accumulates
- Price spikes into that zone
- Immediate reversal follows
Retail traders see a breakout. Institutions see completed execution.
The move before the trend is often the trap. The real move starts after liquidity is cleared.
Institutional vs Retail Entry Models
The difference in entry models is where performance diverges most clearly. Retail traders enter based on confirmation. Institutions enter based on positioning and timing around liquidity.
Retail Entry Patterns vs ICT Entry Concepts
Retail entries typically rely on:
- Breakouts
- Indicator signals (RSI oversold/overbought)
- Trend continuation patterns
For example, if RSI shows an oversold condition, the trader buys. But the price continues to fall because the liquidity below has not yet been absorbed.
ICT entry concepts focus on:
- Liquidity sweeps
- Market structure shifts
- Imbalances (fair value gaps)
Instead of entering during momentum, ICT traders wait for liquidity to be taken, for the structure to shift, and for the price to retrace into an imbalance.
Optimal Trade Entry (OTE) and Precision Timing
OTE (Optimal Trade Entry) is an ICT concept based on Fibonacci retracement levels, typically between 62% and 79%. It is used after a liquidity event and structure shift.
Example:
- Price sweeps liquidity below equal lows
- Market shifts bullish
- Price retraces into 70% Fibonacci zone
- Entry is taken there with a tight stop
This provides:
- Better risk-to-reward (e.g., 1:3 or higher)
- Higher probability due to alignment with institutional behaviour
Q: Why not enter immediately after the sweep?
A: Because institutions often retrace price to rebalance orders before the real move begins.
How Institutions Exploit Retail Behaviour
Institutions do not trade against the market—they trade against positioning. Retail behaviour is highly consistent, which makes it exploitable. By understanding where retail traders are likely to enter and place stops, institutions can design price movements that trigger those actions and use them as liquidity.
Inducing False Moves and Market Traps
False moves are not accidental. They are deliberate setups designed to create participation in the wrong direction.
Typical pattern is as follows:
- Price approaches a key level
- A strong breakout occurs
- Retail traders enter with momentum
- Price reverses sharply
Example:
NASDAQ breaks above a clear resistance at 15,000. Retail traders see strength and go long. Within minutes, the price drops back below the level and continues lower.
From an ICT institutional perspective, the breakout attracted buyers, and their orders provided liquidity for institutions to sell.
These traps often occur at session opens (London session/New York), key technical levels, and after consolidation ranges.
Q: Why do traps happen repeatedly?
A: Retail positioning is predictable and clustered in the same areas.
News Events and Volatility as Liquidity Tools
High-impact news events are one of the most efficient tools for institutions. They create volatility, widen spreads, and trigger large volumes of orders in seconds.
For example, during a Federal Reserve announcement, EUR/USD spikes by 50–80 pips in either direction within minutes. Retail traders react emotionally—buying spikes or panic selling.
Institutions use this environment to:
- Execute large orders without revealing intent
- Trigger stop-loss clusters rapidly
- Enter positions at optimal prices
News does not create direction—it accelerates liquidity events. The second move is usually more reliable than the first.
How to Shift from Retail Thinking to Institutional Mindset
Transitioning from a retail mindset to an institutional perspective is not about adding more indicators. It is about changing how you interpret price entirely. The focus moves from patterns to intent, from reaction to anticipation.
Reading Market Structure Through ICT Concepts
Market structure, in ICT terms, is not just about higher highs and lower lows. It is about understanding when and why structure shifts.
Key elements include:
- Liquidity sweeps (before directional moves)
- Break of structure (confirmation of intent)
- Fair value gaps (areas of imbalance)
So, a practical approach is as follows:
- Identify liquidity first
- Wait for the market structure shift
- Enter on retracement, not impulse
Building a Smart Money-Based Trading Framework
A structured approach is essential. Without it, ICT concepts become inconsistent.
A basic framework:
- Identify higher timeframe bias (e.g., daily trend)
- Mark key liquidity zones (equal highs/lows, session highs/lows)
- Wait for liquidity sweep
- Confirm with the market structure shift
- Enter using OTE or imbalance zones
- Target opposing liquidity
Table: How to Shift from Retail Thinking to Institutional Mindset
| Step | Retail Approach | Institutional (ICT) Approach | Practical Example |
|---|---|---|---|
| 1. Bias | Follows the trend blindly | Defines higher timeframe bias | Gold is trending up on a daily basis |
| 2. Level Marking | Draws support/resistance | Identifies liquidity pools | Equal lows at 1920 |
| 3. Entry Trigger | Breakout entry | Waits for liquidity sweep | Price dips below 1920 first |
| 4. Confirmation | Uses indicators (RSI, MACD) | Uses market structure shift | Break of short-term high |
| 5. Entry Timing | Enters during momentum | Enters on retracement (OTE/FVG) | Entry at 1930 pullback |
| 6. Stop Placement | Obvious zones | Beyond liquidity extremes | Below sweep low |
| 7. Target | Fixed RR or resistance | Targets opposing liquidity | Target 1960 highs |
Conclusion
The core idea behind ICT Retail vs Institutional Trading is simple: markets move to facilitate large orders, not to confirm retail patterns. Most retail traders lose because they react to price, while institutions anticipate liquidity.
By shifting your focus from indicators to liquidity, from breakouts to sweeps, and from impulse entries to structured timing, you align yourself with how the market actually operates. This does not guarantee immediate success, but it removes the structural disadvantage that traps most traders.